patent · US5660602A
Hydrogen enriched natural gas as a clean motor fuel
26 August 1997
Page 1 — bibliographic record
United States Patent (19) 11 Patent Number: 5,660,602 Collier, Jr. et al. 45 Date of Patent: Aug. 26, 1997 54 HYDROGEN ENRICHED NATURAL GAS AS 4,223,642 9/1980 Okubo ......................................... 123/3 A CLEAN MOTOR FUEL 4,376,097 3/1983 Emelock ... ... 422/189 4,508,064 4/1985 Watanabe. ... 123/1 A 75 Inventors: Robert Kirk Collier, Jr., Merritt 4,520,763 6/1985 Lynch et al. ............................ 123/1 A Island; Robert Louis Hoekstra, 4,569,890 2/1986 Barthel ...... 48/197 FM o 4,722,303 2/1988 Leonard ...................................... 123/3 Oviedo;11.David Neal Mulligan, 5,139002 wo 8/1992 Lynch et al. ... . 123/575
Titusville; Douglas Edward Hahn, 5,156,114 10/1992 Gunnerman ............................. 23/1 A Melbourne, all of Fla. 5,176,809 1/1993 Simuni ........... . . 204/273 o 5,207,185 5/1993 Greiner et al. .............................. 123/3 (73) Assignee: University of Central Florida, 5248,566 9/1993 Kumar et al... ... 429/9 Orlando, Fla. 5,293,857 3/1994 Meyer ........................................ 123/3 5,297,515 3/1994 Gale et al. .................................. 123/3 21 Appl. No.: 611,400 OTHER PUBLICATIONS 22 Filed: Mar. 4, 1996 "Clean Automotive Fuel, engine Emissions Using Natural Rel OP i 8 Gas. Hydrogen-Enriched Natural Gas, Manufactured From elated U.S. Application Data Coal (Synthane)” D.B. Eccleston and R. D. Fleming, 63 Continuation of Ser. No. 237,900, May 4, 1994, abandoned. Bartlesville Energy R Center, Bartlesville, OK, Bureau of 6 Mines Automotive Exhaust Emissions Program, Technical I 51) int. Cl. ..................... C01B 300 Report-48, Feb. 1972, US Dept of the Interior. 52 U.S. Cl. ... . . 48/127.3; 48/197 FM: "Fuel Economy and Emissions of Lean Burn Engines”, 123/1A; 123/3; 123/276 Harrow et al., IMech. E. HQ Conference publications, pp.
58 Field of Search ............................ 48/127.3, 197 FM, 39-50, Jun. 1979.
Primary Examiner-Timothy McMahon 56) References Cited Attorney, Agent, or Firm-Brian S. Steinberger; Law
1275,252 8/1918 Harris ................................ 48/199 FM 57 ABSTRACT : A: Beit al. i.e. FM A fuel mixture is disclosed. In a preferred embodiment, an 1628.066 5527 Rose. ...g6, alternative gaseous fuel for operating a combustion engine 1863,636 6/1932 Quelch ............................... 48/197 FM includes approximately 21 to 50%. Hydrogen and the rest 1936,155 11/1933 Florez ..... ... 48/199 FM natural gas constituants such as combinations of Methane, 1936,156 11/1933 Florez ..... ... 48/199 FM Carbon Dioxide, Nitrogen, Ethane, Propane, Iso-Butane, 2.956,093 10/1960 Nicolai ... ... 48/199 FM N-Butane, Iso Pentane, N-Pentane, and Hexanes Plus. Cur 3,759,679 9/1973 Franz et al...... ... 48/199 FM rent production engines without any substantial modifica 3,976,034 8/1976 Shinohara et al........................... 123/3 tions can take this alternative fuel. This alternative fuel is
lean burning and emits emissions that are below current legal standards 4,112,876 9/1978 Mentschel ....... ... 123/3 9.
4,131,086 12/1978 Noguchi et al. ... 123/3 4,143,620 3/1979 Noguchi et al. ............................ 123/3 10 Claims, 20 Drawing Sheets
XHAUSTEMISSIONS FOR NATURAL GAS AND HYDROGENMIXTURES
aX 500 O% Hydrogen 120
2 400 r- Total Oxides of C)
Nitrogen 2 300 Unburned 90 9t
Hydrocarbons
EQUIWALENCE RATIO
Page 2
Drawing sheet — no readable text.
Page 3
Drawing sheet — no readable text.
Page 4
Drawing sheet — no readable text.
Page 5
Drawing sheet — no readable text.
Page 6
Drawing sheet — no readable text.
Page 7
Drawing sheet — no readable text.
Page 8
Drawing sheet — no readable text.
Page 9
Drawing sheet — no readable text.
Page 10
Drawing sheet — no readable text.
Page 11
Drawing sheet — no readable text.
Page 12
Drawing sheet — no readable text.
Page 13
Drawing sheet — no readable text.
Page 14
Drawing sheet — no readable text.
Page 15
Drawing sheet — no readable text.
Page 16
Drawing sheet — no readable text.
Page 17
Drawing sheet — no readable text.
Page 18
Drawing sheet — no readable text.
Page 19
Drawing sheet — no readable text.
Page 20
Drawing sheet — no readable text.
Page 21
Drawing sheet — no readable text.
Page 22
HYDROGEN ENRCHED NATURAL GAS AS produced and engine thermal efficiency was substantially A CLEAN MOTOR FUEL increased over stock gasoline configurations. The article mentions that in order to "operate a vehicle on fuel mixtures
This application is a Continuation of application Ser. No. of gasoline and hydrogen, an onboard source of hydrogen is 08/237,900 filed on May 4, 1994, now abandoned entitled: 5 required. Onboard storage of hydrogen, either as a com Hydrogen Enriched Natural Gas As A Clean Motor Fuel. pressed gas, as a liquid at cryogenic temperature, or as a This invention relates to fuels, and in particular to a hydrode is not a practical solution today. Direct generation hydrogen and natural gas mixture used as a fuel for com of hydrogen from gasoline in an onboard reactor was bustion engines. This invention was funded in part under selected as the best solution to the problem.” The main contract no. DCA 92SE20061505026 from the Florida O problem with this device was that the reactor described has Energy Office. not been adopted due to the complexity of the device.
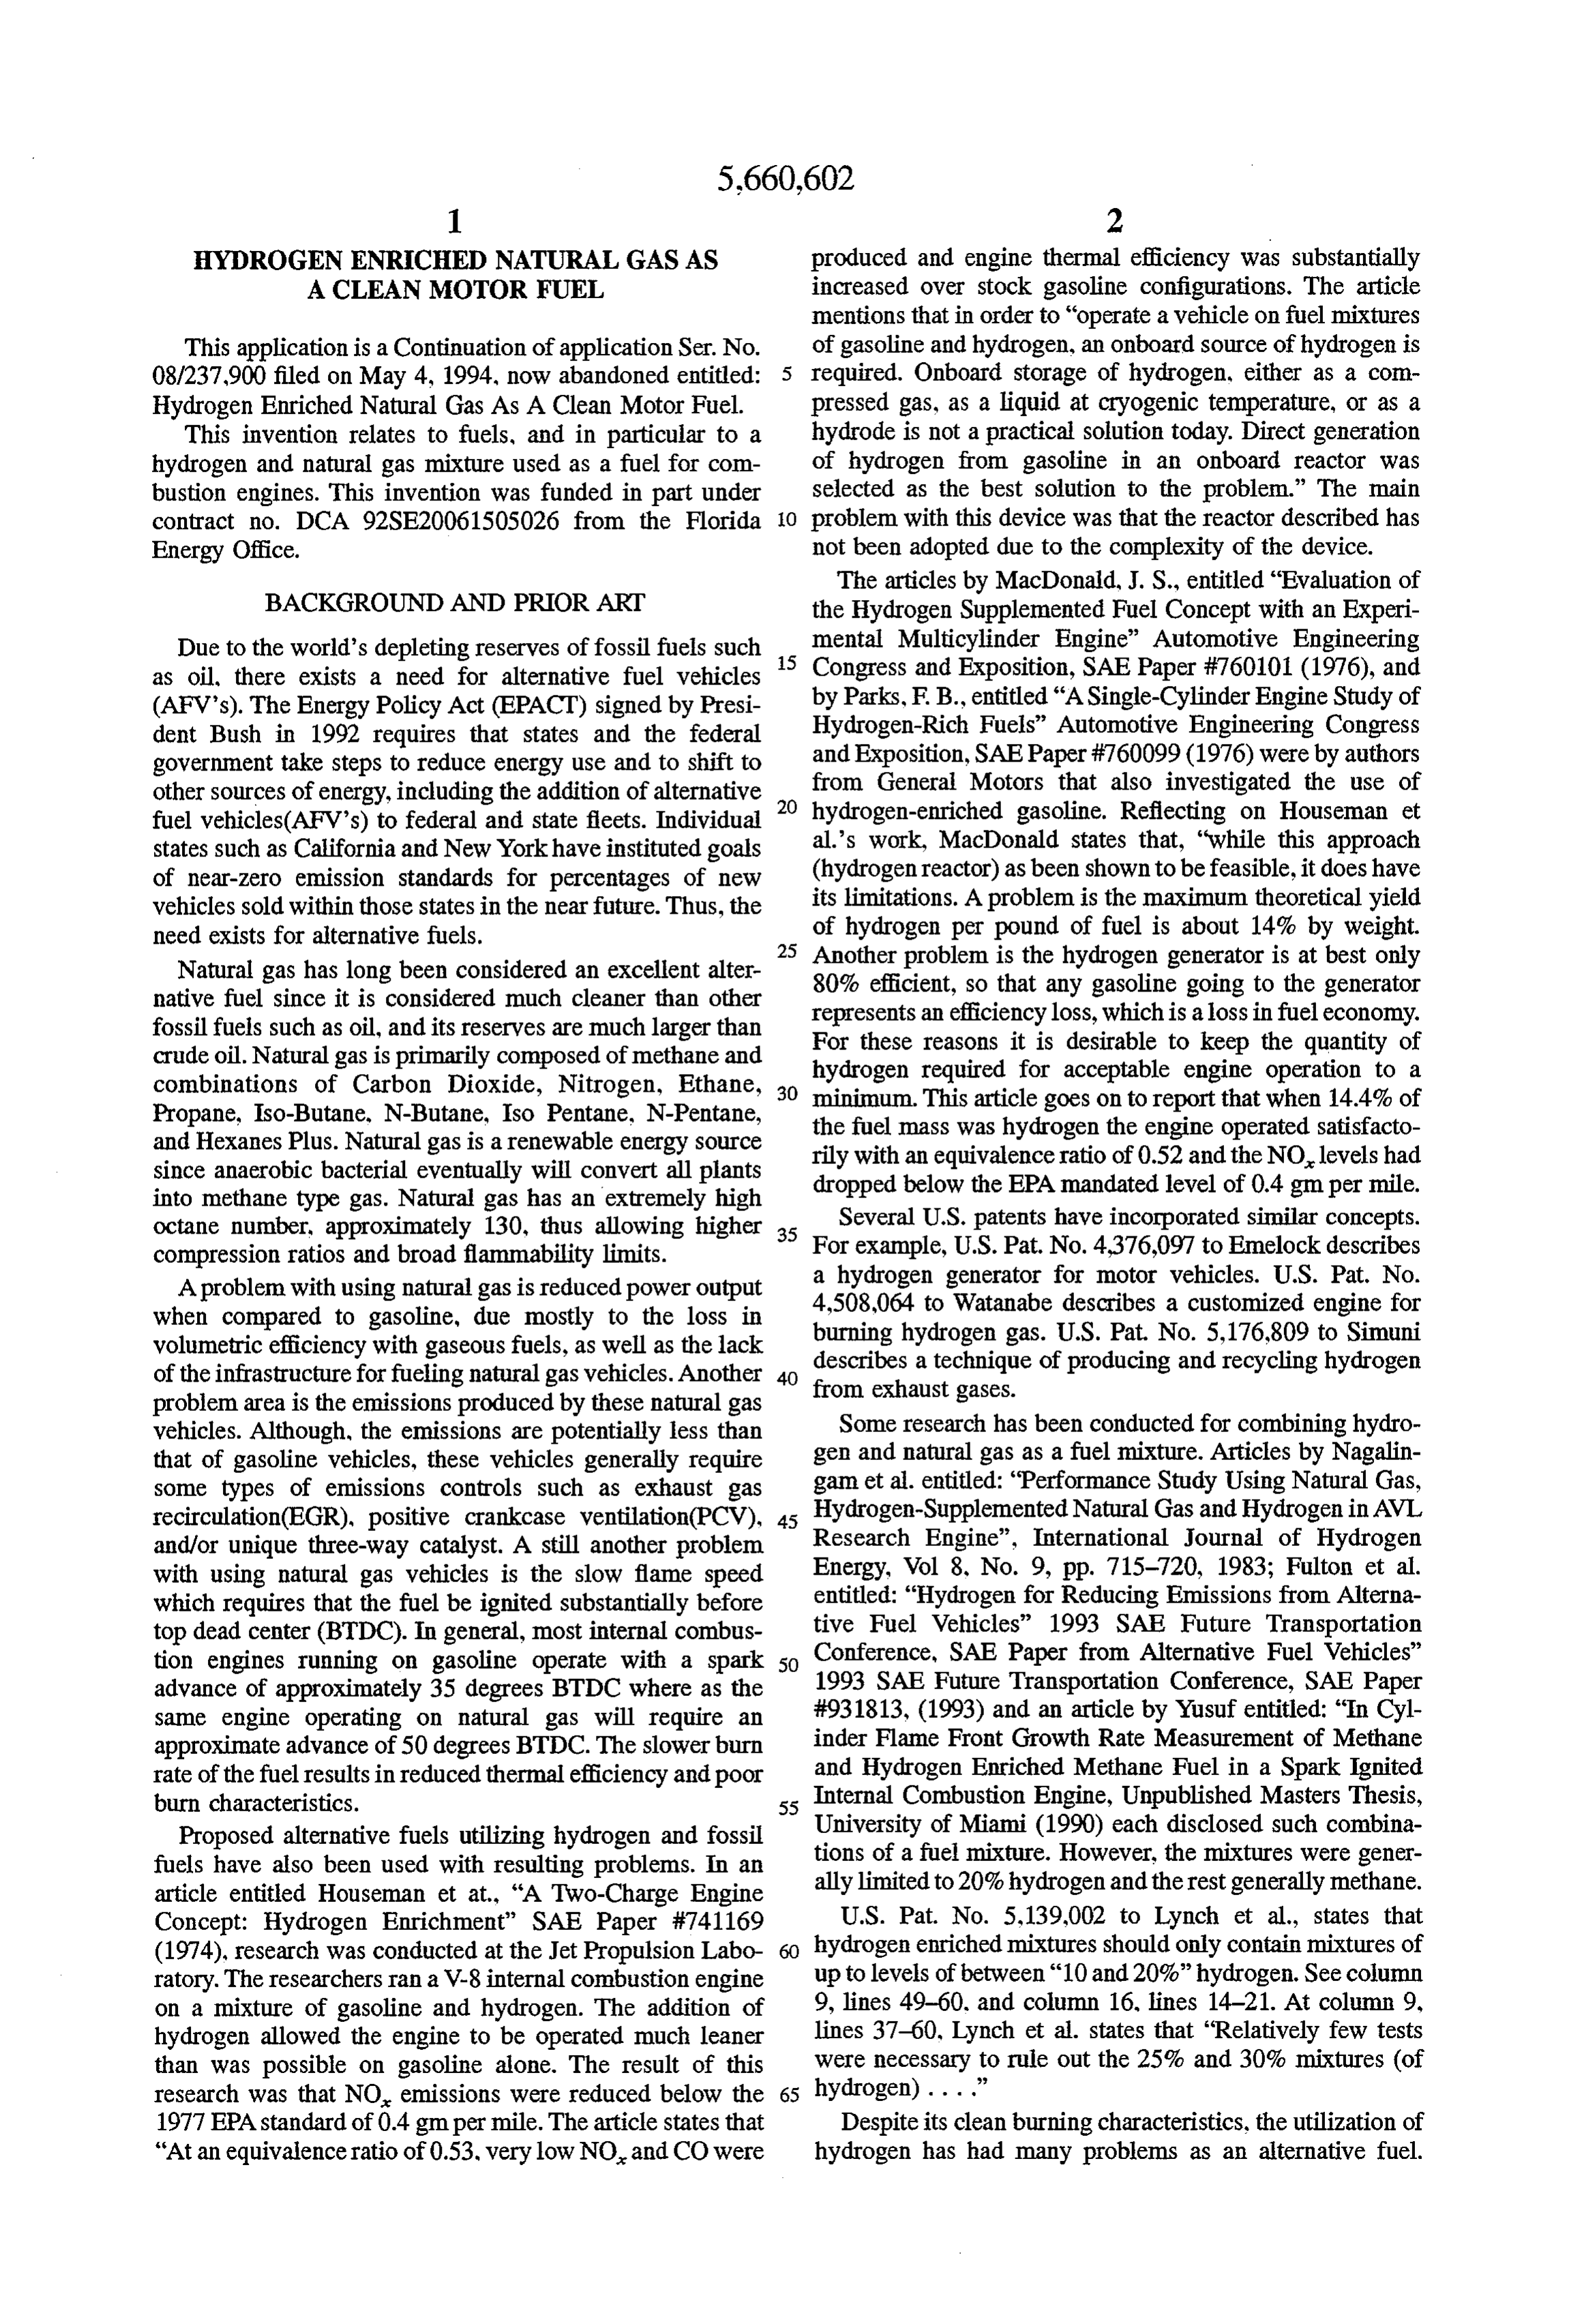
BACKGROUND AND PRIOR ART
The articles by MacDonald, J. S., entitled "Evaluation of the Hydrogen Supplemented Fuel Concept with an Experi
Due to the world's depleting reserves of fossil fuels such 15 mental Multicylinder Engine” Automotive Engineering as oil, there exists a need for alternative fuel vehicles Congress and Exposition, SAE Paper #760101 (1976), and (AFV's). The Energy Policy Act (EPACT) signed by Presi by Parks, F. B., entitled "A Single-Cylinder Engine Study of dent Bush in 1992 requires that states and the federal and Hydrogen-Rich Fuels' Automotive Engineering Congress government take steps to reduce energy use and to shift to Exposition, SAEPaper #760099 (1976) were by authors other sources of energy, including the addition of alternative 20 from General Motors that also investigated the use of hydrogen-enriched gasoline. Reflecting on Houseman et fuel vehicles(AFV's) to federal and state fleets. Individual states such as California and New Yorkhave instituted goals al.'s work, MacDonald states that, "while this approach of near-zero emission standards for percentages of new (hydrogenreactor) as been shownto be feasible, it does have vehicles sold within those states in the near future. Thus, the its limitations. A problem is the maximum theoretical yield need exists for alternative fuels. of hydrogen per pound of fuel is about 14% by weight. 25 Another problem is the hydrogen generator is at best only
Natural gas has long been considered an excellent alter 80% efficient, so that any gasoline going to the generator native fuel since it is considered much cleaner than other fossil fuels such as oil, and its reserves are much larger than Forrepresents an efficiency loss, which is a loss in fuel economy. crude oil. Natural gas is primarily composed of methane and hydrogen these reasons it is desirable to keep the quantity of required for acceptable engine operation to a combinations of Carbon Dioxide, Nitrogen, Ethane, 30 minimum. This article goes on to report that when 14.4% of Propane, Iso-Butane, N-Butane, Iso Pentane, N-Pentane, and Hexanes Plus. Natural gas is a renewable energy source the rily fuel mass was hydrogen the engine operated satisfacto with an equivalence ratio of 0.52 and the NO levels had since anaerobic bacterial eventually will convert all plants dropped below the EPA mandated level of 0.4 gmper mile. into methane type gas. Natural gas has an extremely high octane number, approximately 130, thus allowing higher 35 Several U.S. patents have incorporated similar concepts. compression ratios and broad flammability limits. For example, U.S. Pat. No. 4376,097 to Emelock describes A problem with using natural gas is reduced power output a hydrogen generator for motor vehicles. U.S. Pat. No. 4,508,064 to Watanabe describes a customized engine for when compared to gasoline, due mostly to the loss in burning hydrogen gas. U.S. Pat. No. 5,176,809 to Simuni volumetric efficiency with gaseous fuels, as well as the lack describes a technique of producing and recycling hydrogen of the infrastructure for fueling natural gas vehicles. Another 40 problem area is the emissions produced by these natural gas from exhaust gases.
vehicles. Although, the emissions are potentially less than Some research has been conducted for combining hydro that of gasoline vehicles, these vehicles generally require gen and natural gas as a fuel mixture. Articles by Nagalin some types of emissions controls such as exhaust gas gam et al. entitled: "Performance Study Using Natural Gas, recirculation(EGR), positive crankcase ventilation(PCV), 45 Hydrogen-Supplemented Natural Gas and Hydrogen in AVL and/or unique three-way catalyst. A still another problem Research Engine”, International Journal of Hydrogen with using natural gas vehicles is the slow flame speed Energy, Vol. 8, No. 9, pp. 715-720, 1983; Fulton et al. which requires that the fuel be ignited substantially before entitled: "Hydrogen for Reducing Emissions from Alterna top dead center (BTDC). In general, most internal combus tive Fuel Vehicles” 1993 SAE Future Transportation tion engines running on gasoline operate with a spark 50 Conference, SAE Paper from Alternative Fuel Vehicles” advance of approximately 35 degrees BTDC where as the 1993 SAE Future Transportation Conference, SAE Paper same engine operating on natural gas will require an #931813, (1993) and an article by Yusuf entitled: "In Cyl approximate advance of 50 degrees BTDC. The slower burn inder Flame Front Growth Rate Measurement of Methane rate of the fuel results in reduced thermal efficiency and poor and Hydrogen Enriched Methane Fuel in a Spark Ignited burn characteristics. 55 Internal Combustion Engine, Unpublished Masters Thesis, Proposed alternative fuels utilizing hydrogen and fossil University of Miami (1990) each disclosed such combina fuels have also been used with resulting problems. In an tions of a fuel mixture. However, the mixtures were gener article entitled Houseman et at, "A Two-Charge Engine ally limited to 20% hydrogen and the rest generally methane. Concept: Hydrogen Enrichment' SAE Paper #741169 U.S. Pat. No. 5,139,002 to Lynch et al., states that (1974), research was conducted at the Jet Propulsion Labo hydrogen enriched mixtures should only contain mixtures of ratory. The researchers ran a V-8 internal combustion engine up to levels of between "10 and 20%"hydrogen. See column on a mixture of gasoline and hydrogen. The addition of 9, lines 49-60, and column 16, lines 14-21. At column 9, hydrogen allowed the engine to be operated much leaner lines 37-60, Lynch et al. states that "Relatively few tests than was possible on gasoline alone. The result of this were necessary to rule out the 25% and 30% mixtures (of research was that NO emissions were reduced below the 65 hydrogen) . . . .” 1977 EPA standard of 0.4 gmper mile. The article states that Despite its clean burning characteristics, the utilization of "At an equivalence ratio of 0.53, very low NO and CO were hydrogen has had many problems as an alternative fuel.
Page 23
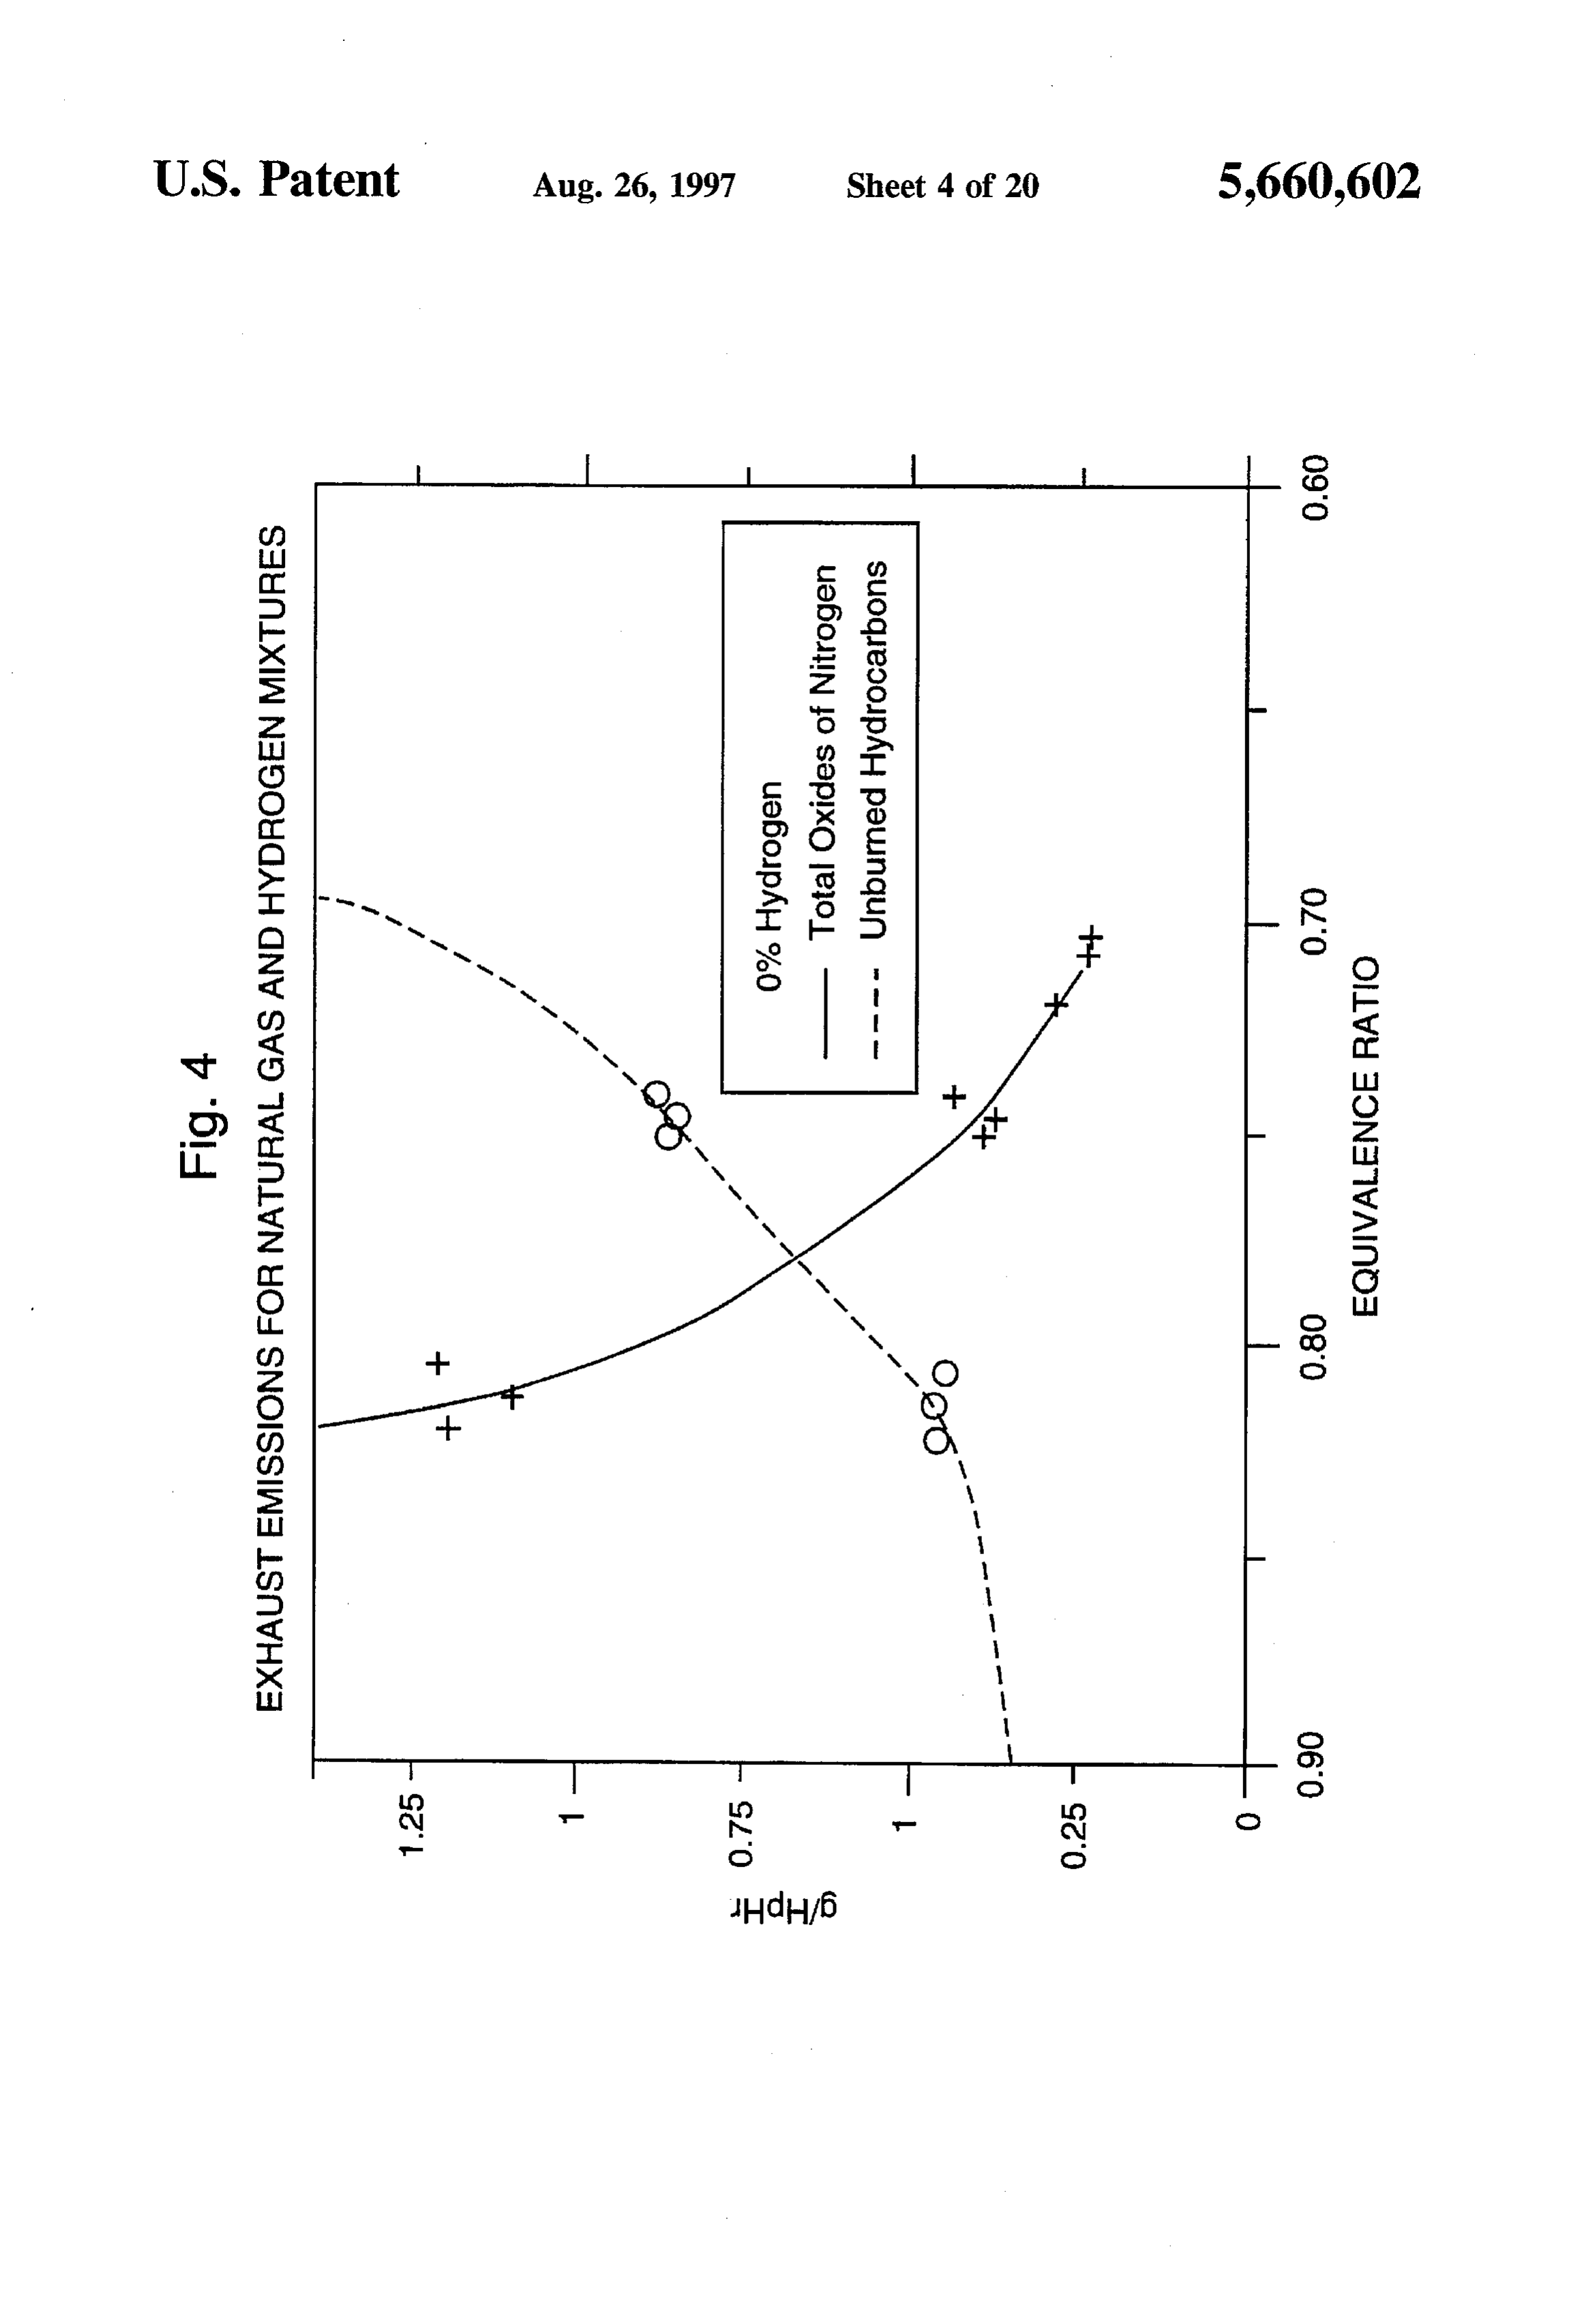
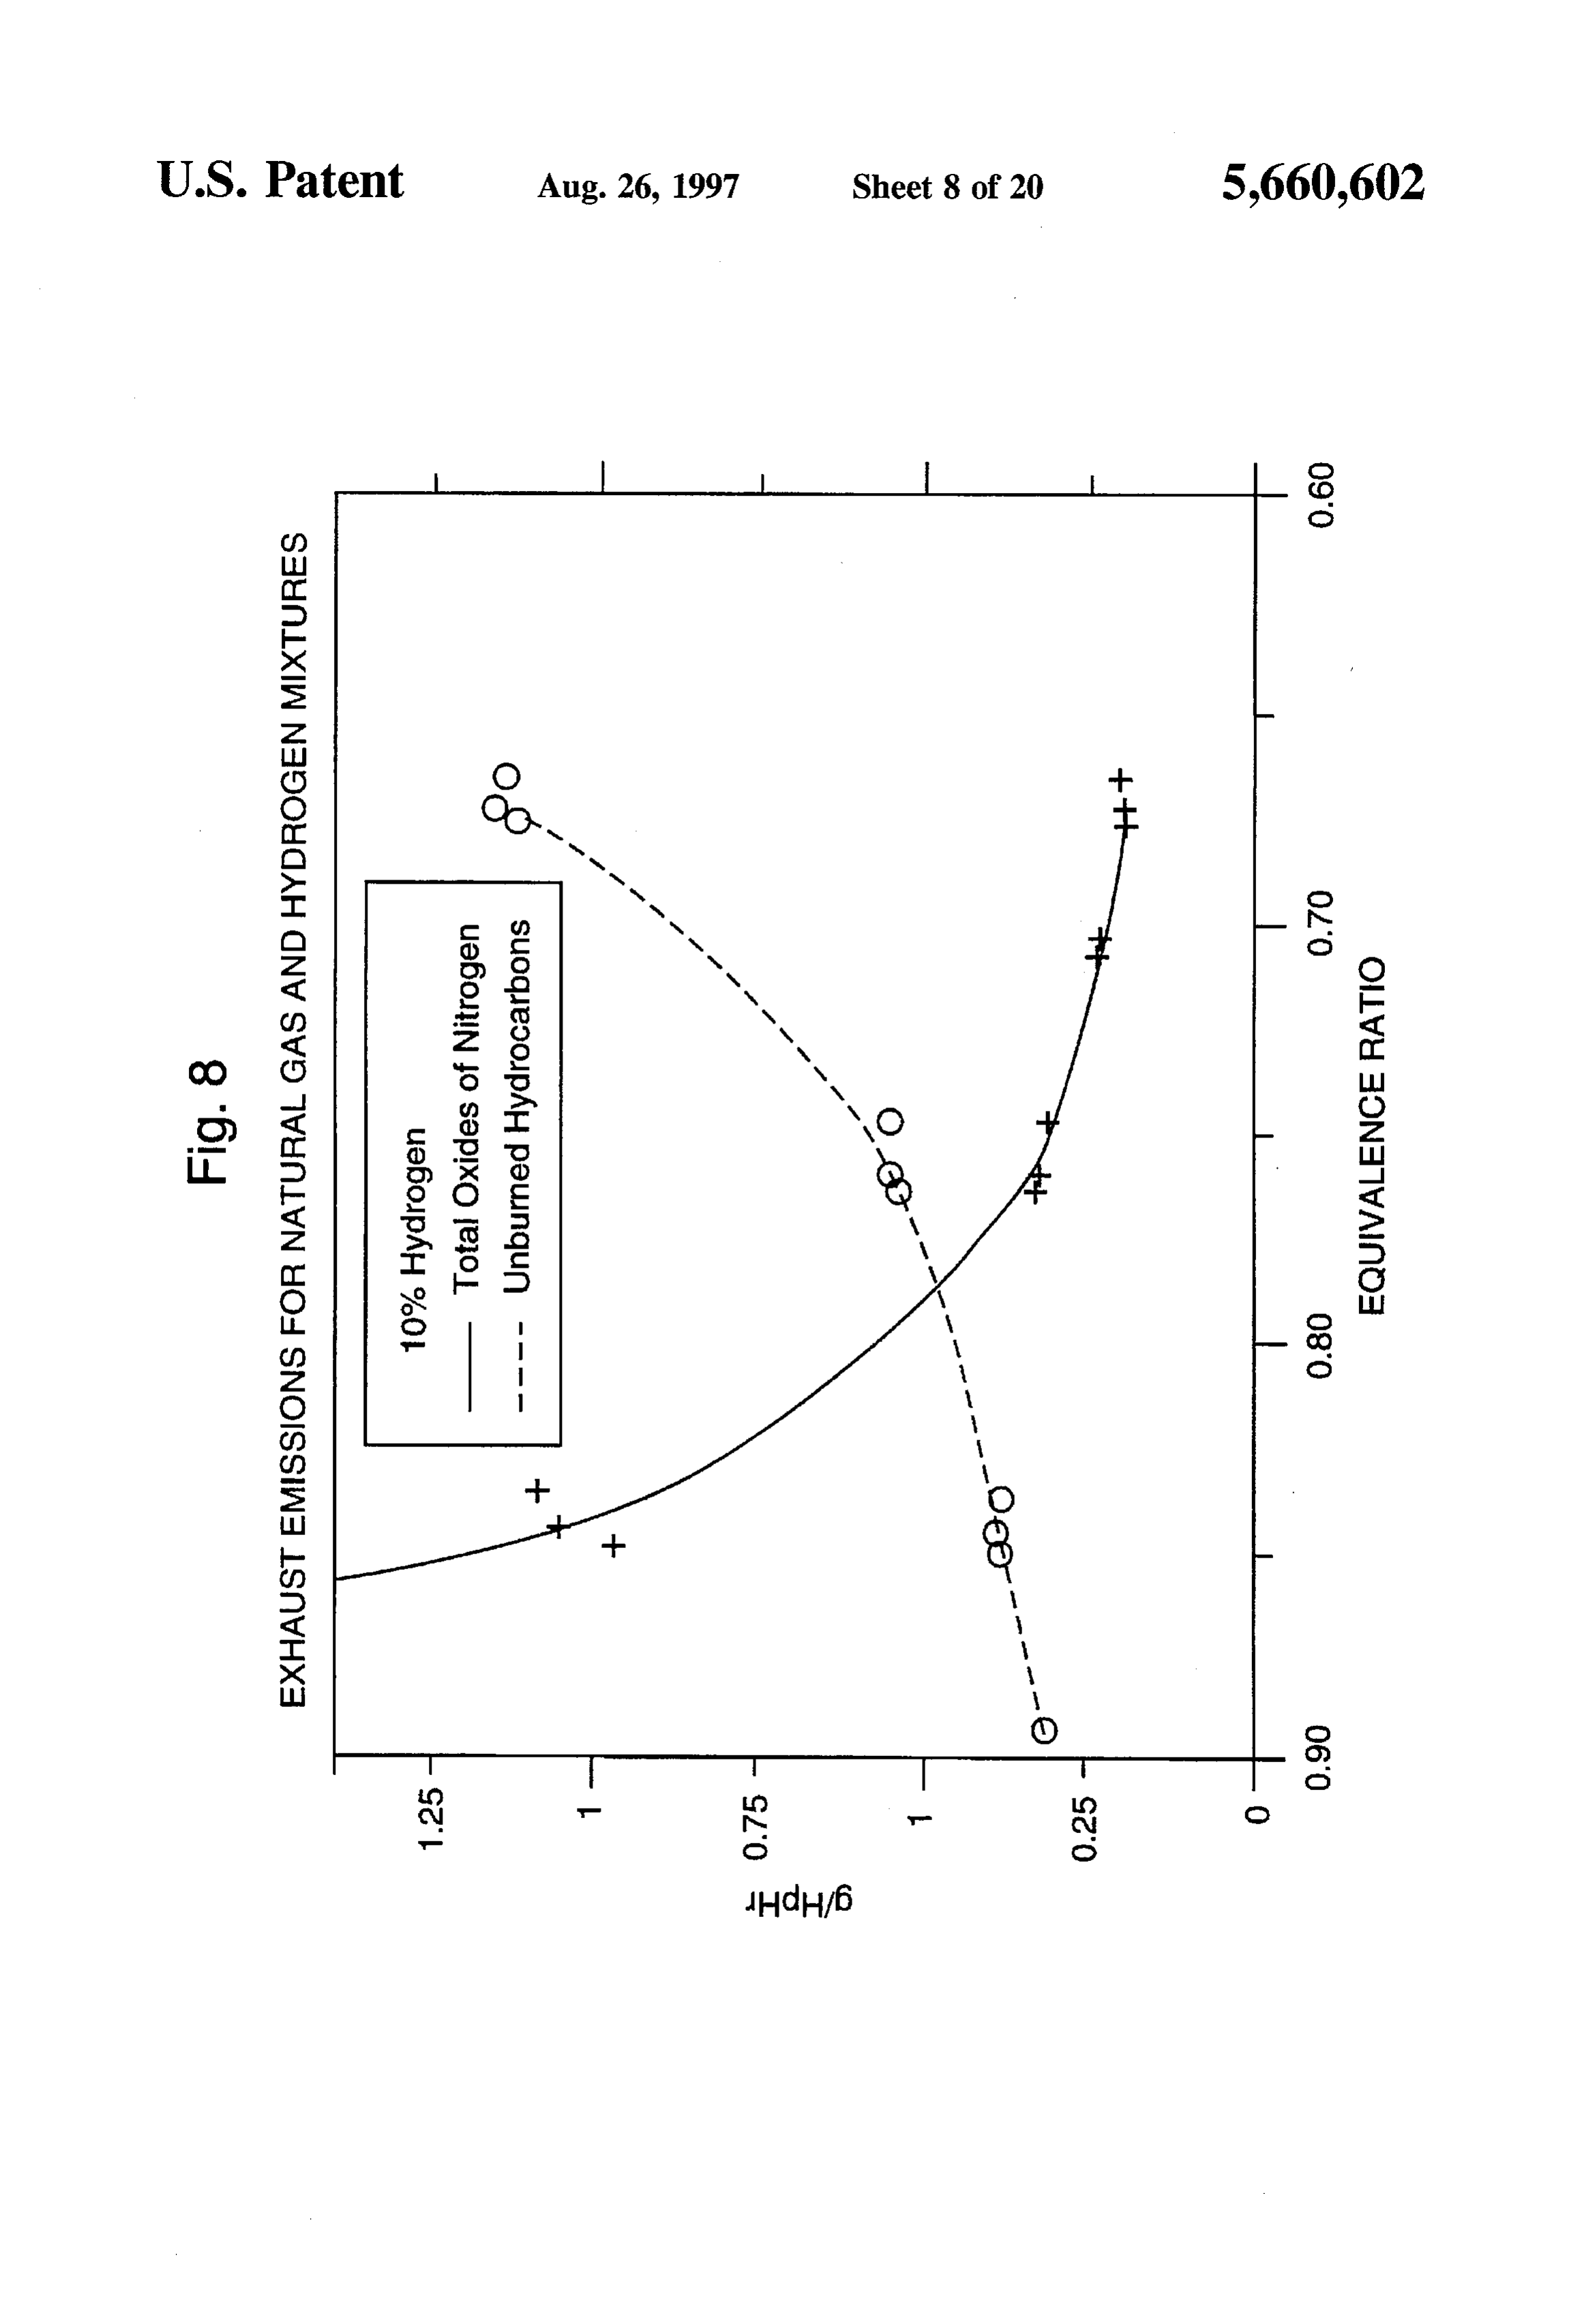
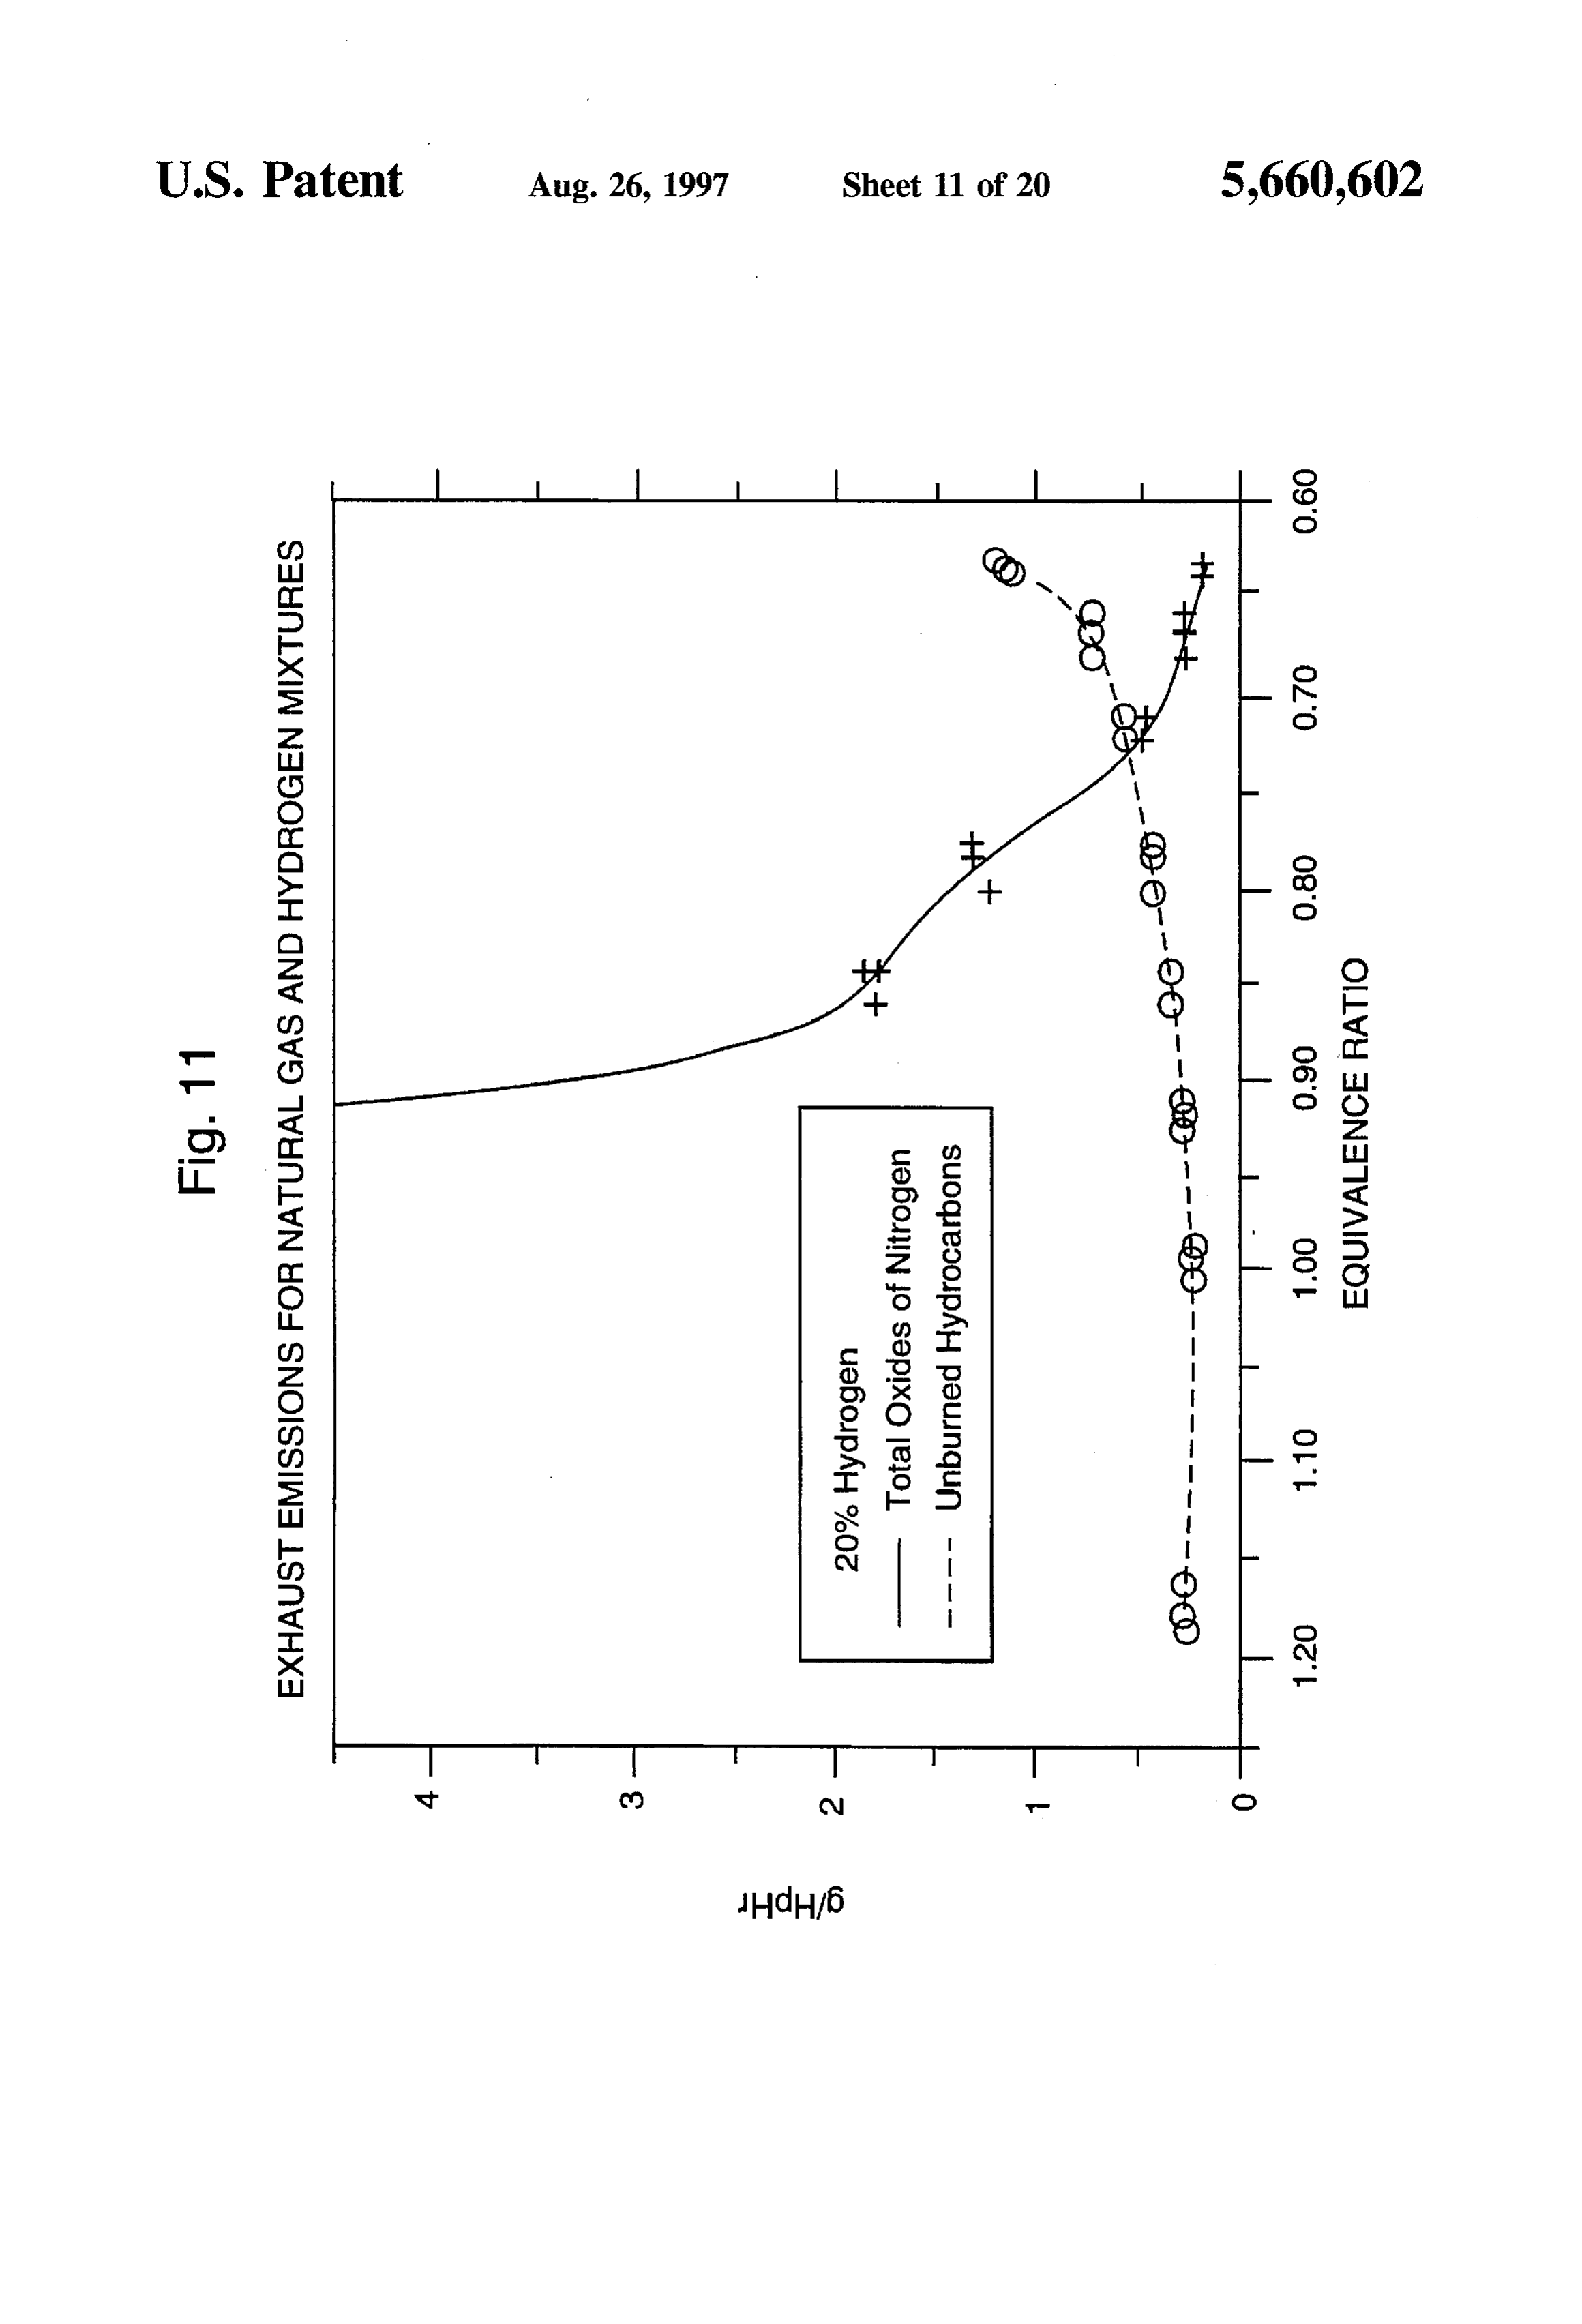
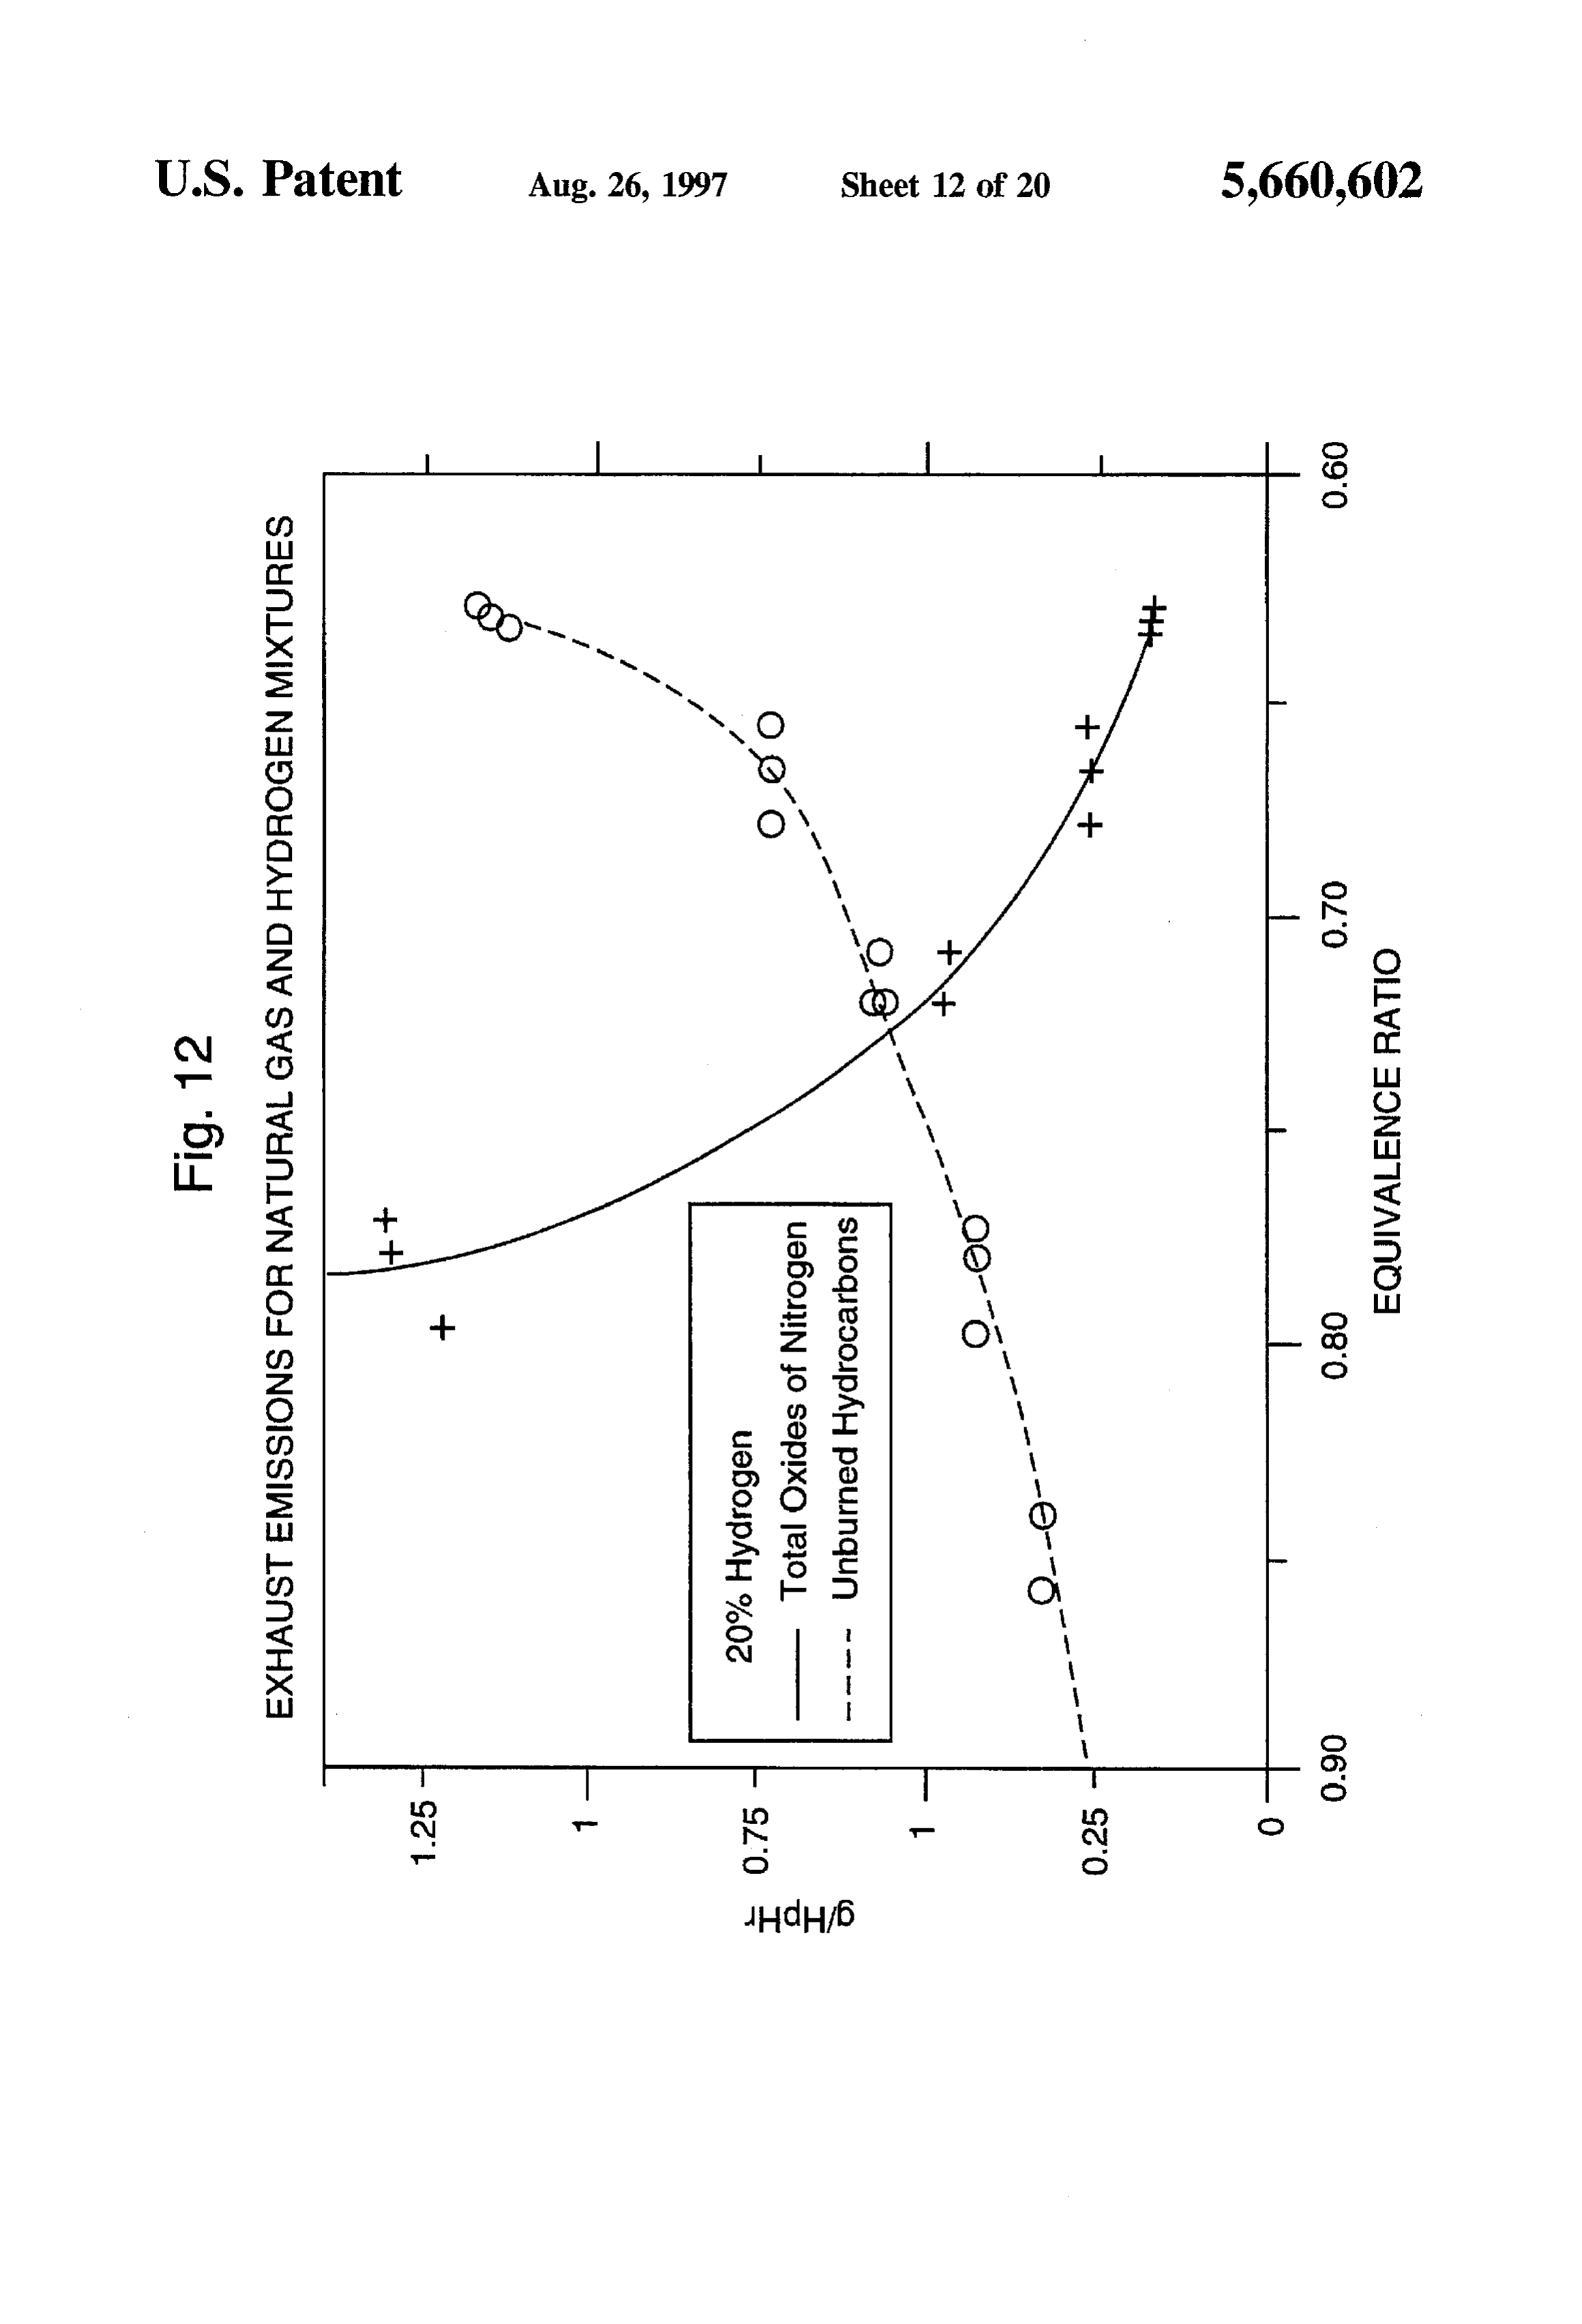
Primarily, the use of hydrogen in vehicles has been limited FIG. 11 shows a graph of exhaust emissions for natural by the size, weight, complexity and cost of hydrogen storage gas and 20% hydrogen mixtures in grams per horse power options as well as the cost of hydrogen. hour(g/HipHr) vs. Equivalence ratio.
SUMMARY OF THE INVENTION
FIG. 12 shows an enlarged sectional graph of FIG. 11 of exhaust emissions for natural gas and 20% hydrogen mix
The first objective of the present invention is to provide a tures in grams per horse power hour(g/HipHr) vs. Equiva hydrogen and natural gas mixture that can extend the lean lence ratio.
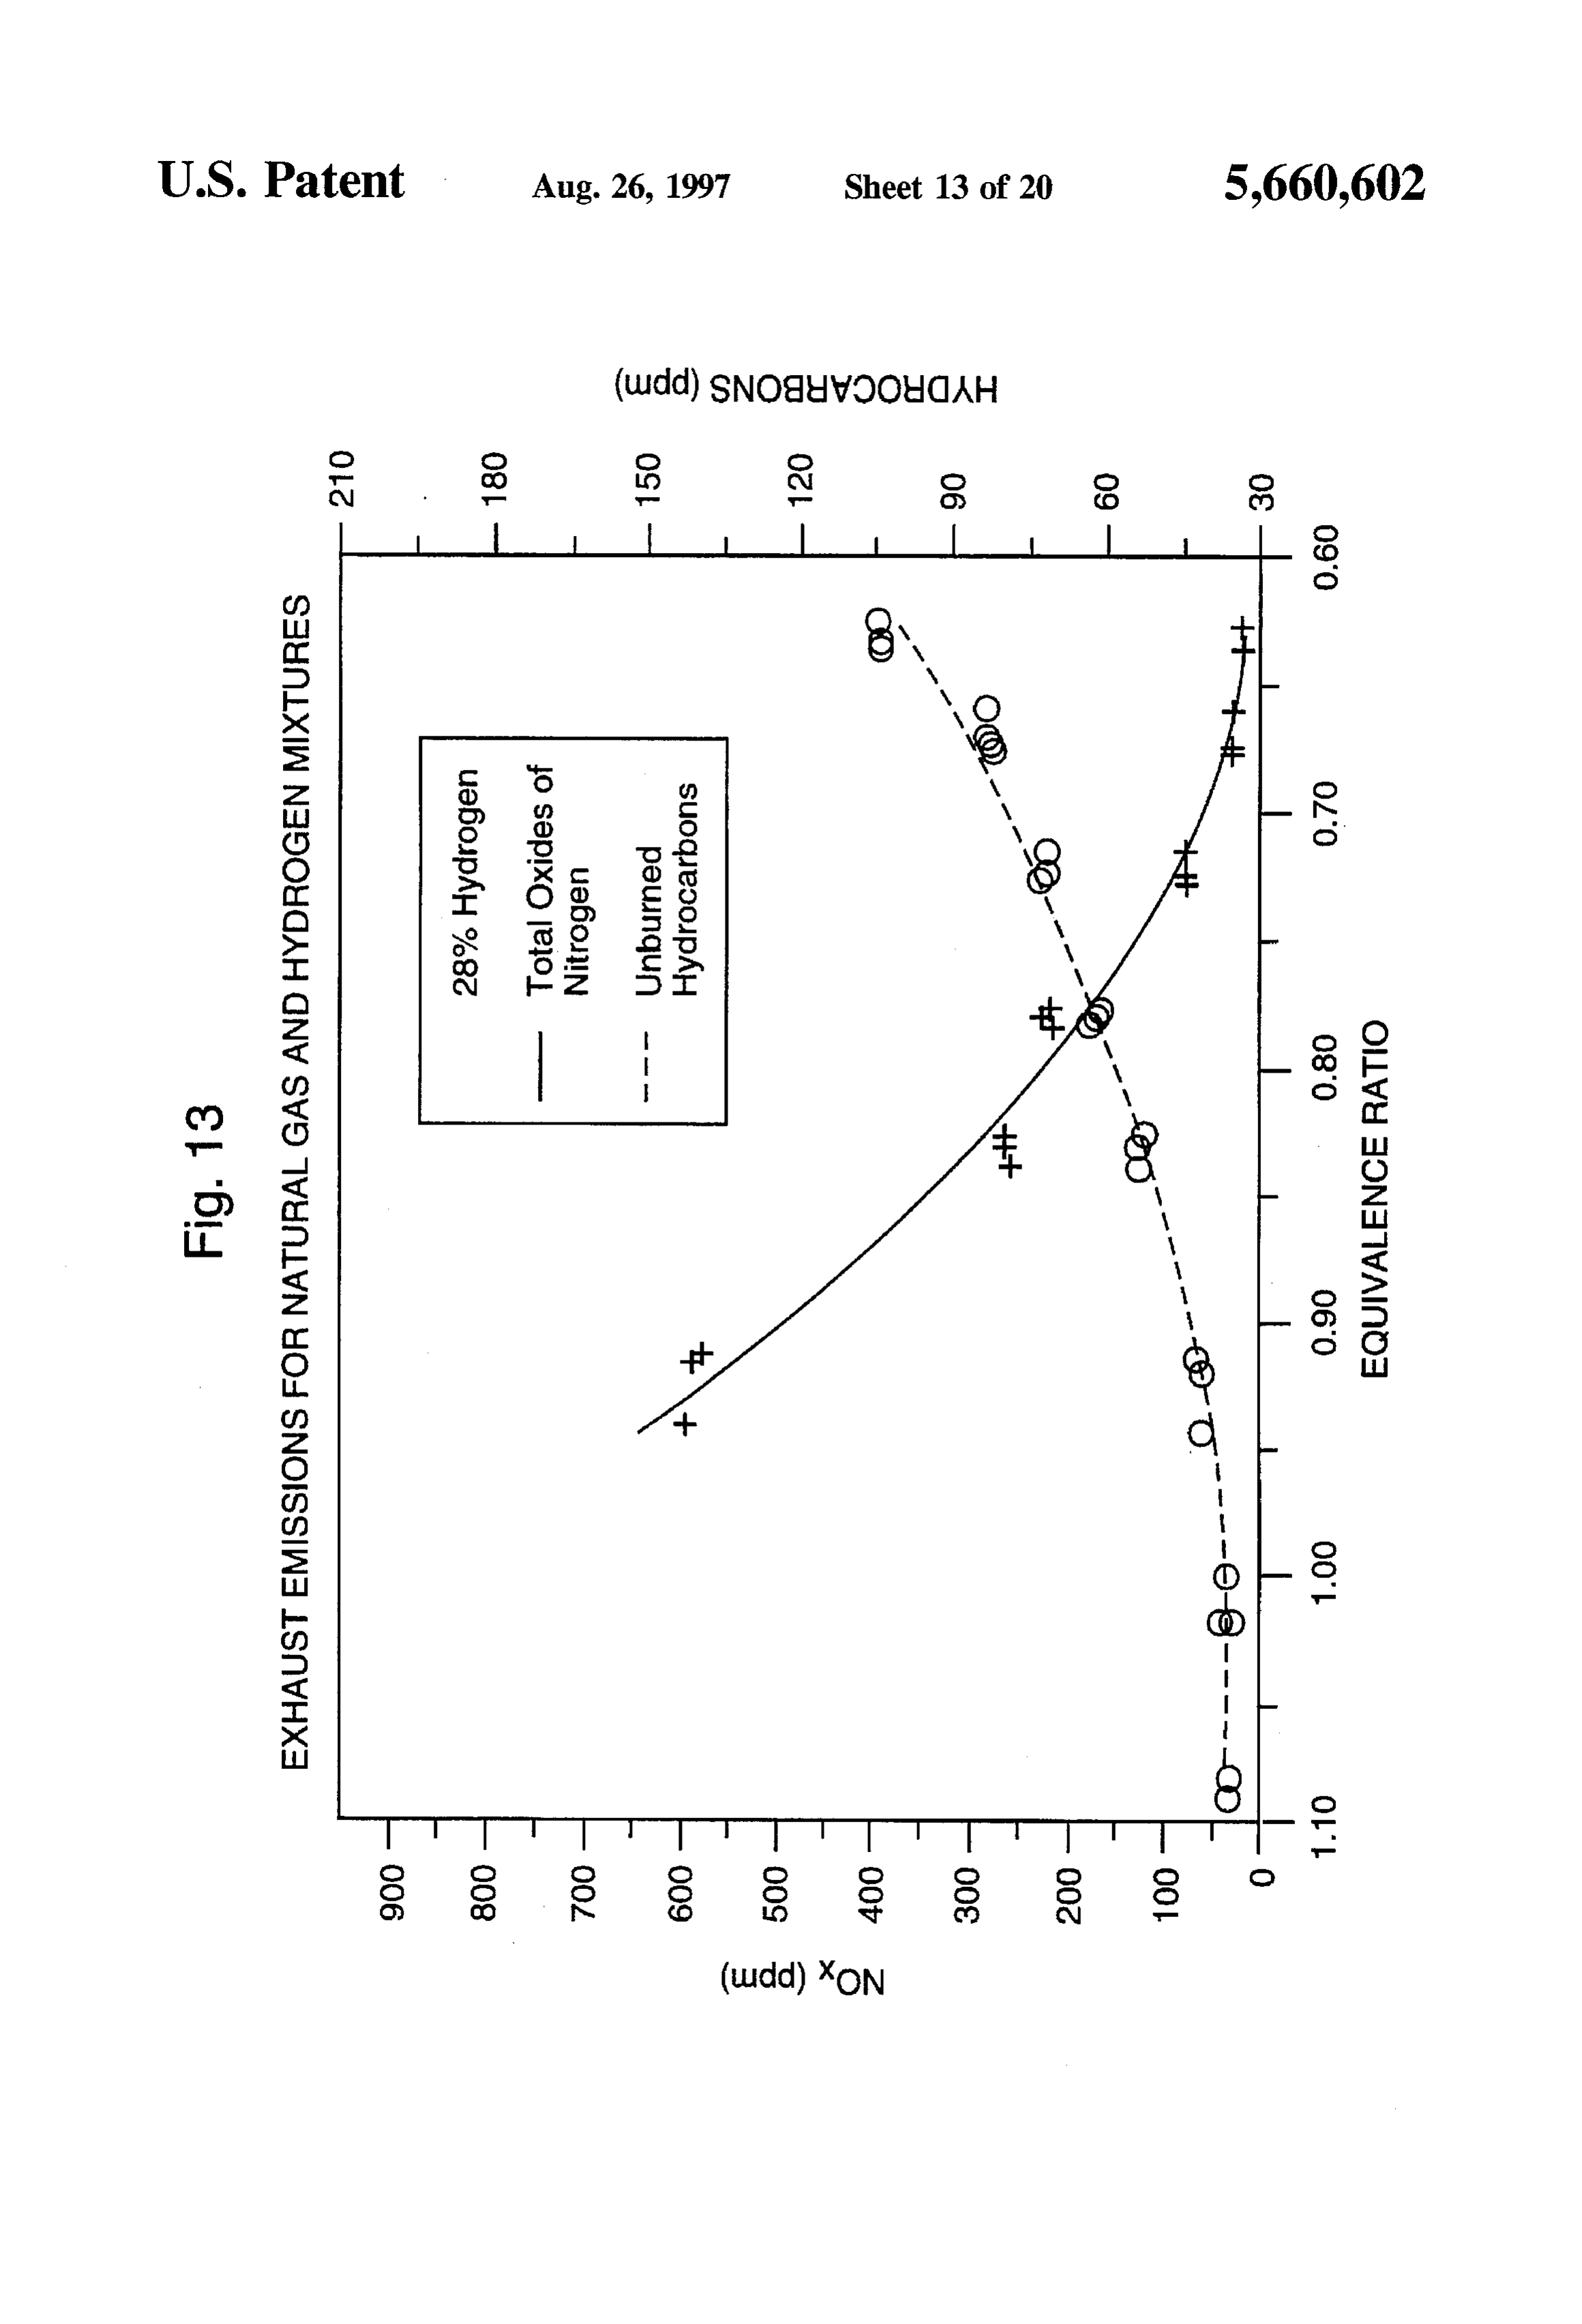
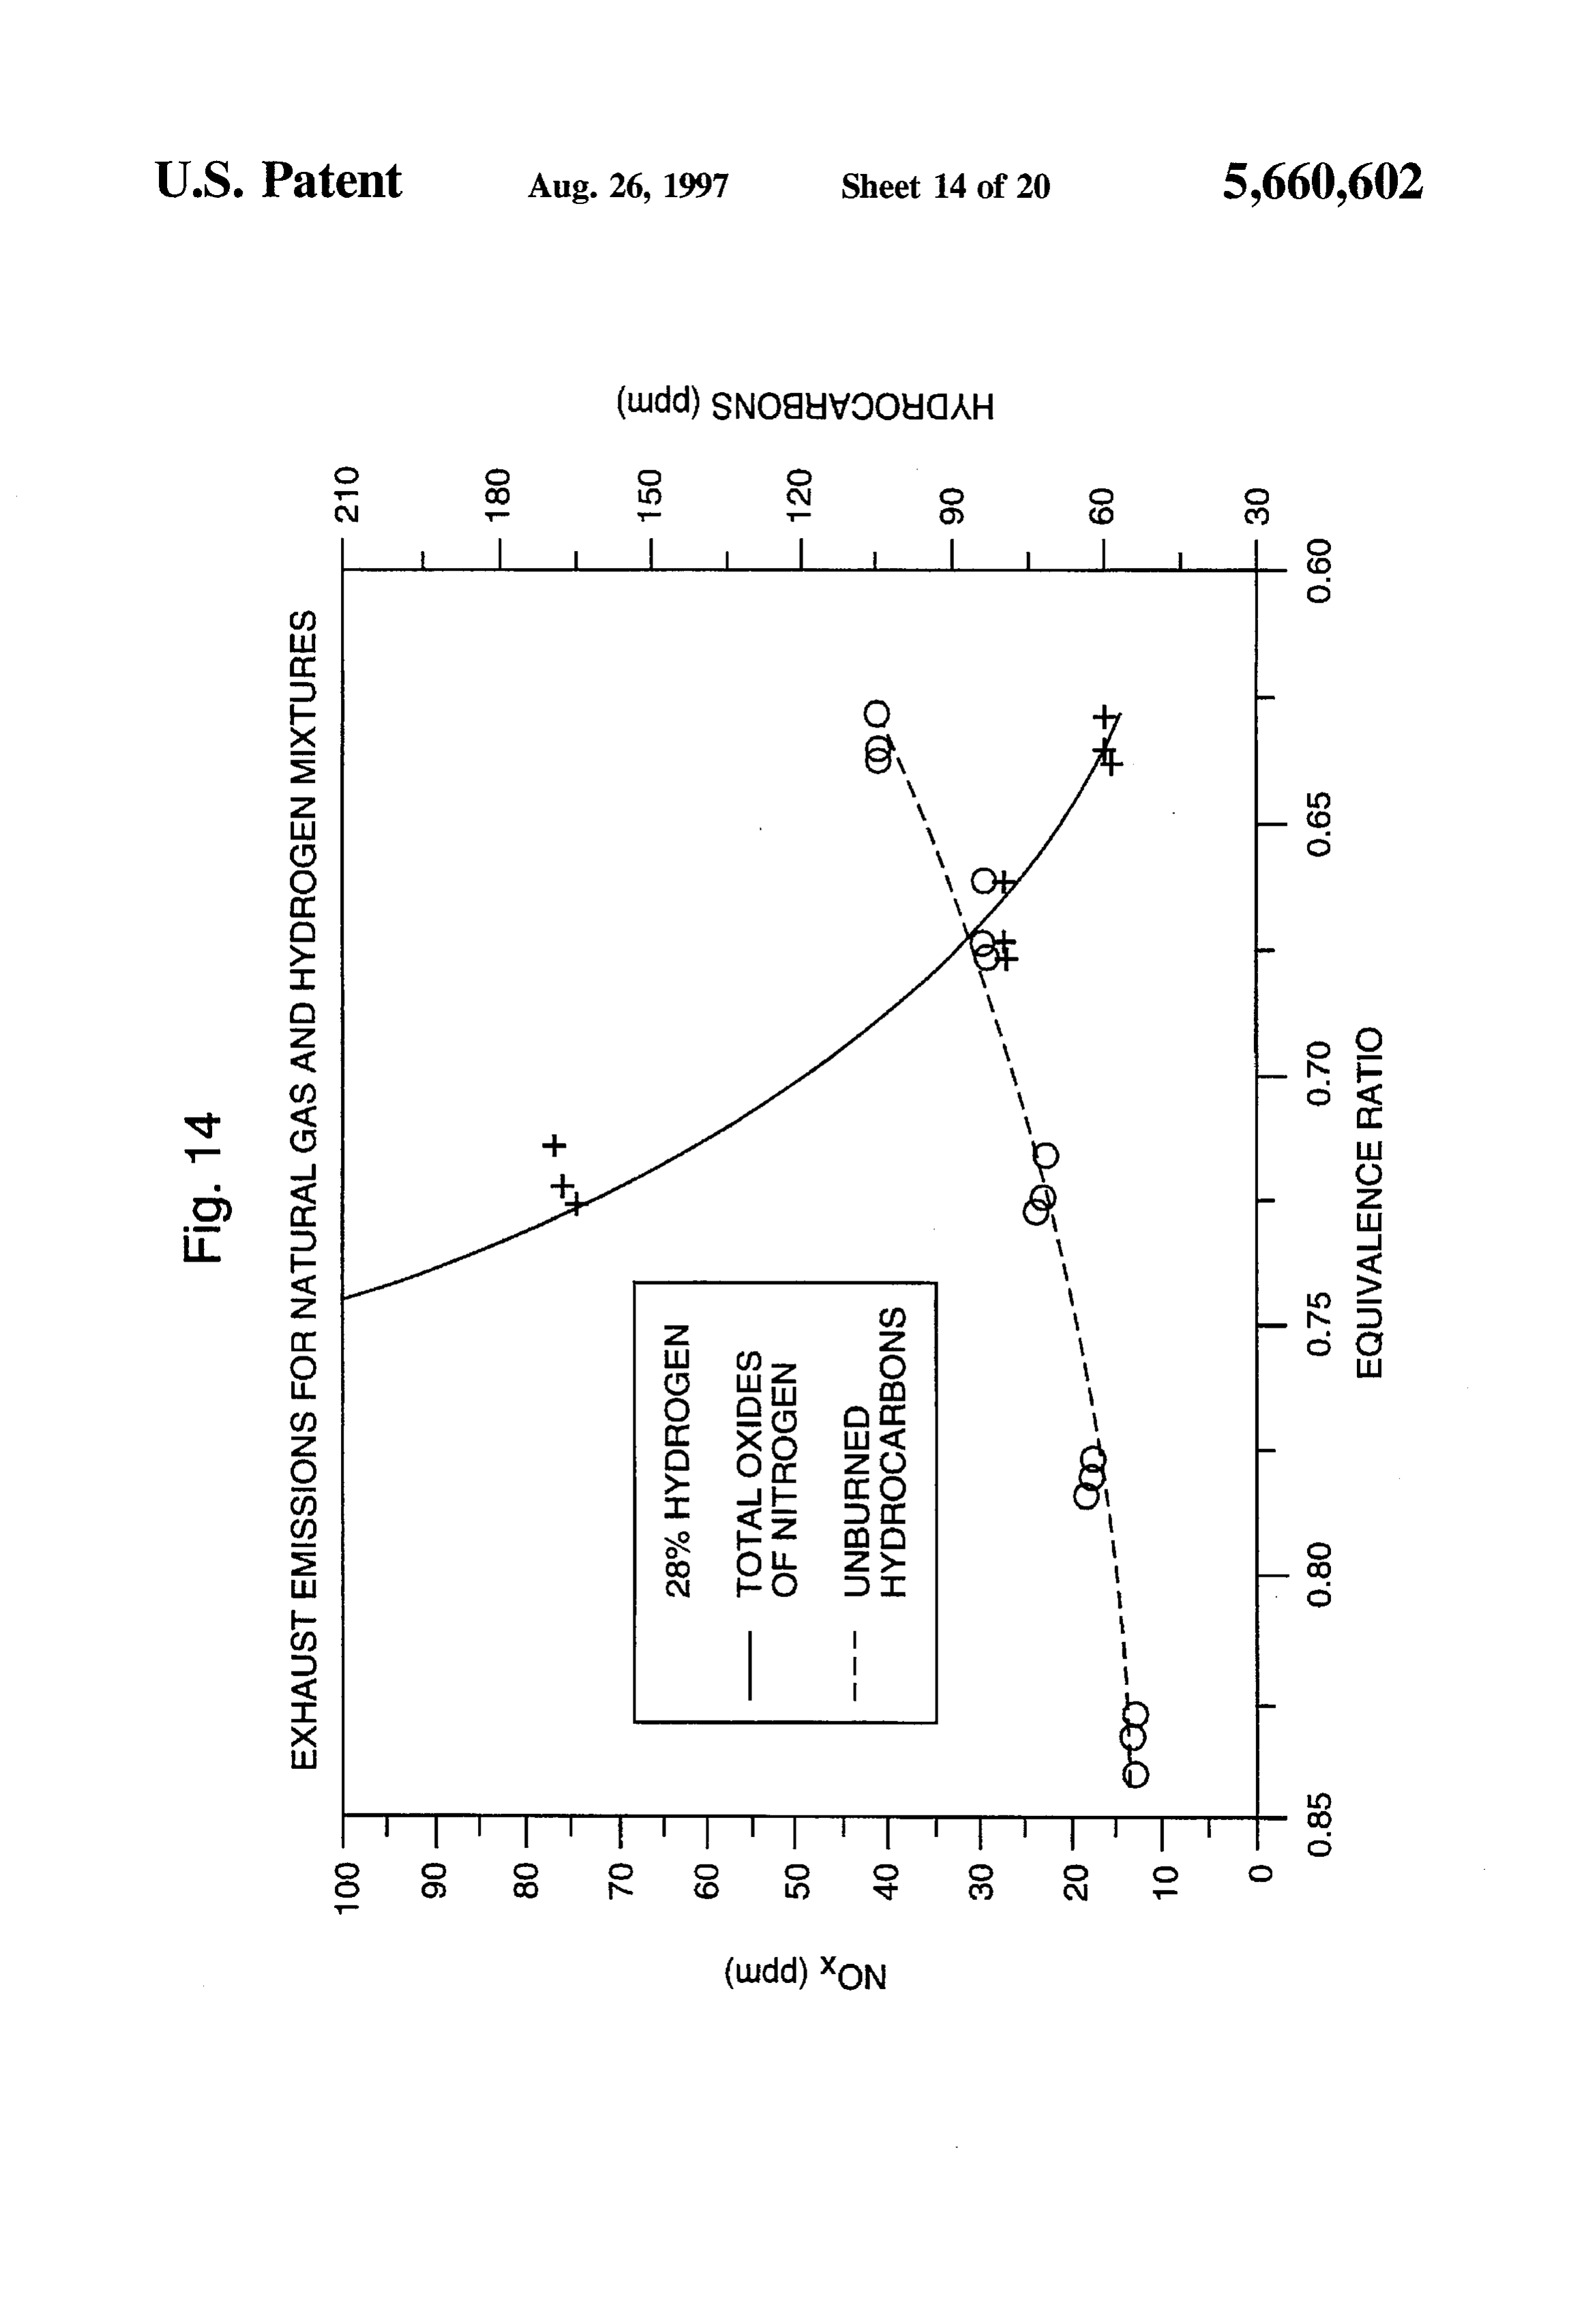
combustion limits of natural gas as a motor fuel. FIG. 13 shows a graph of exhaust emissions for natural The second object of this invention is to provide a 10 gas and 28% hydrogen mixtures in parts per million(PPM) hydrogen and natural gas mixture that substantially reduces vs. Equivalence Ratio.
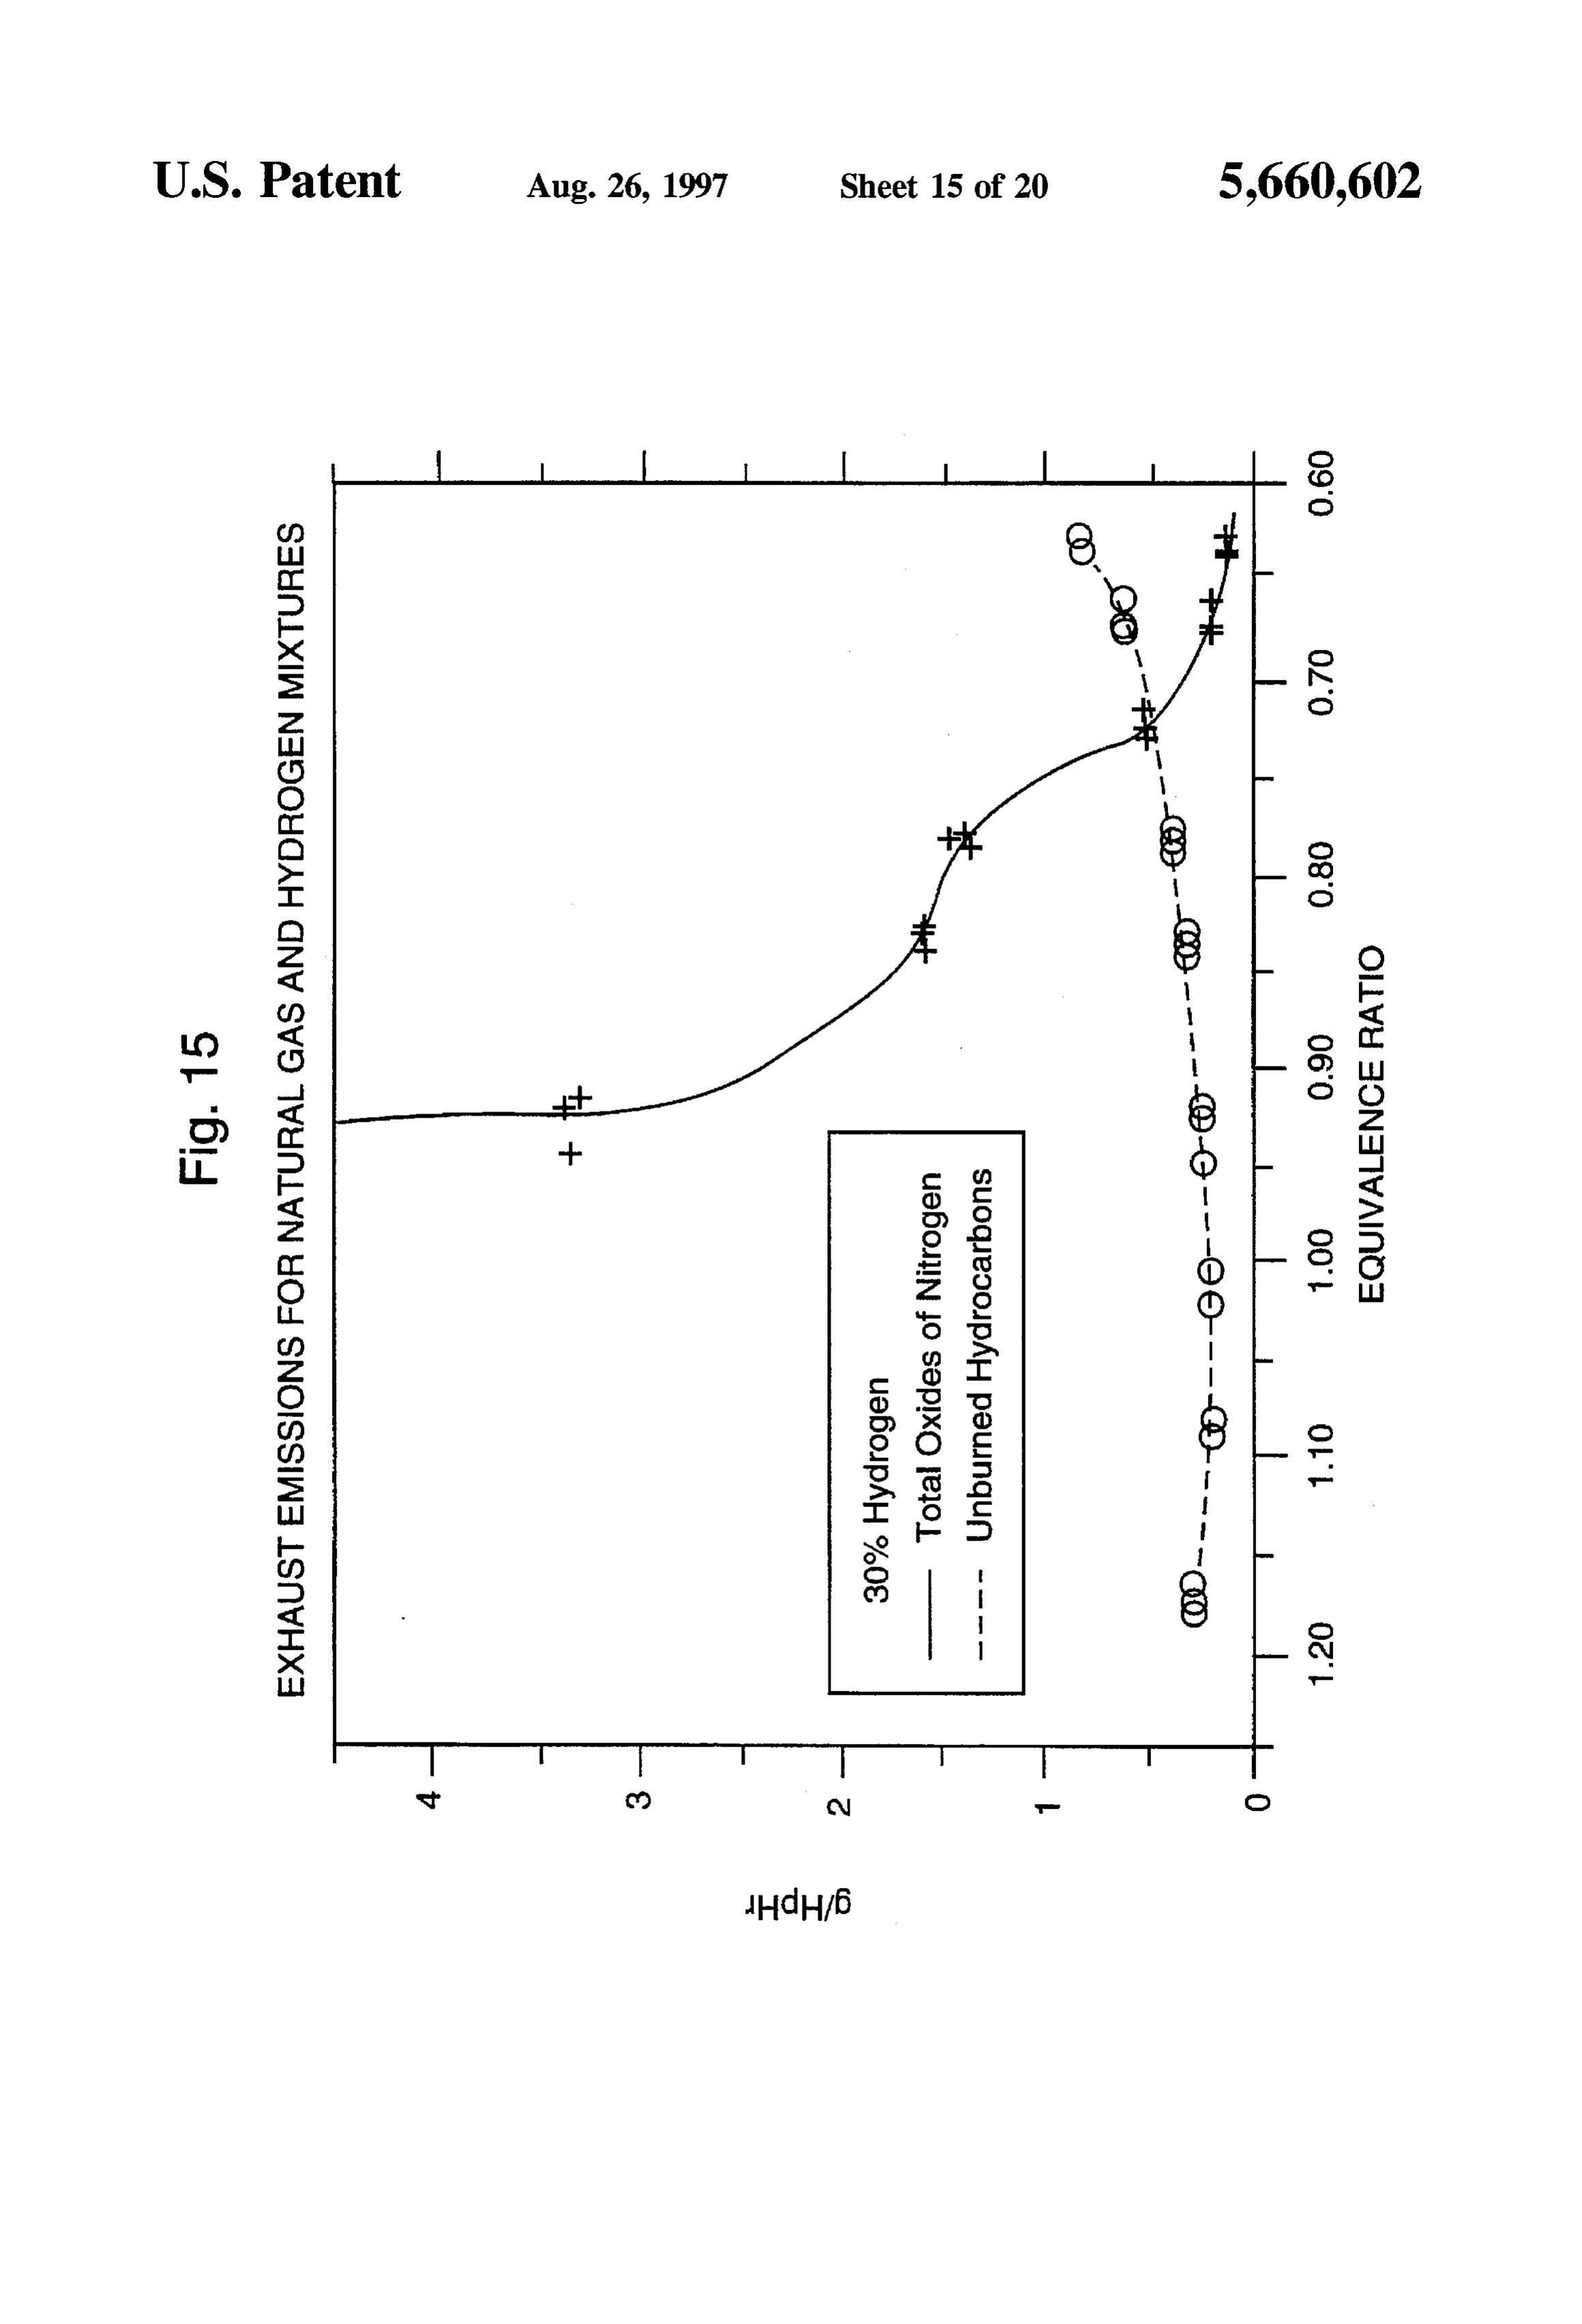
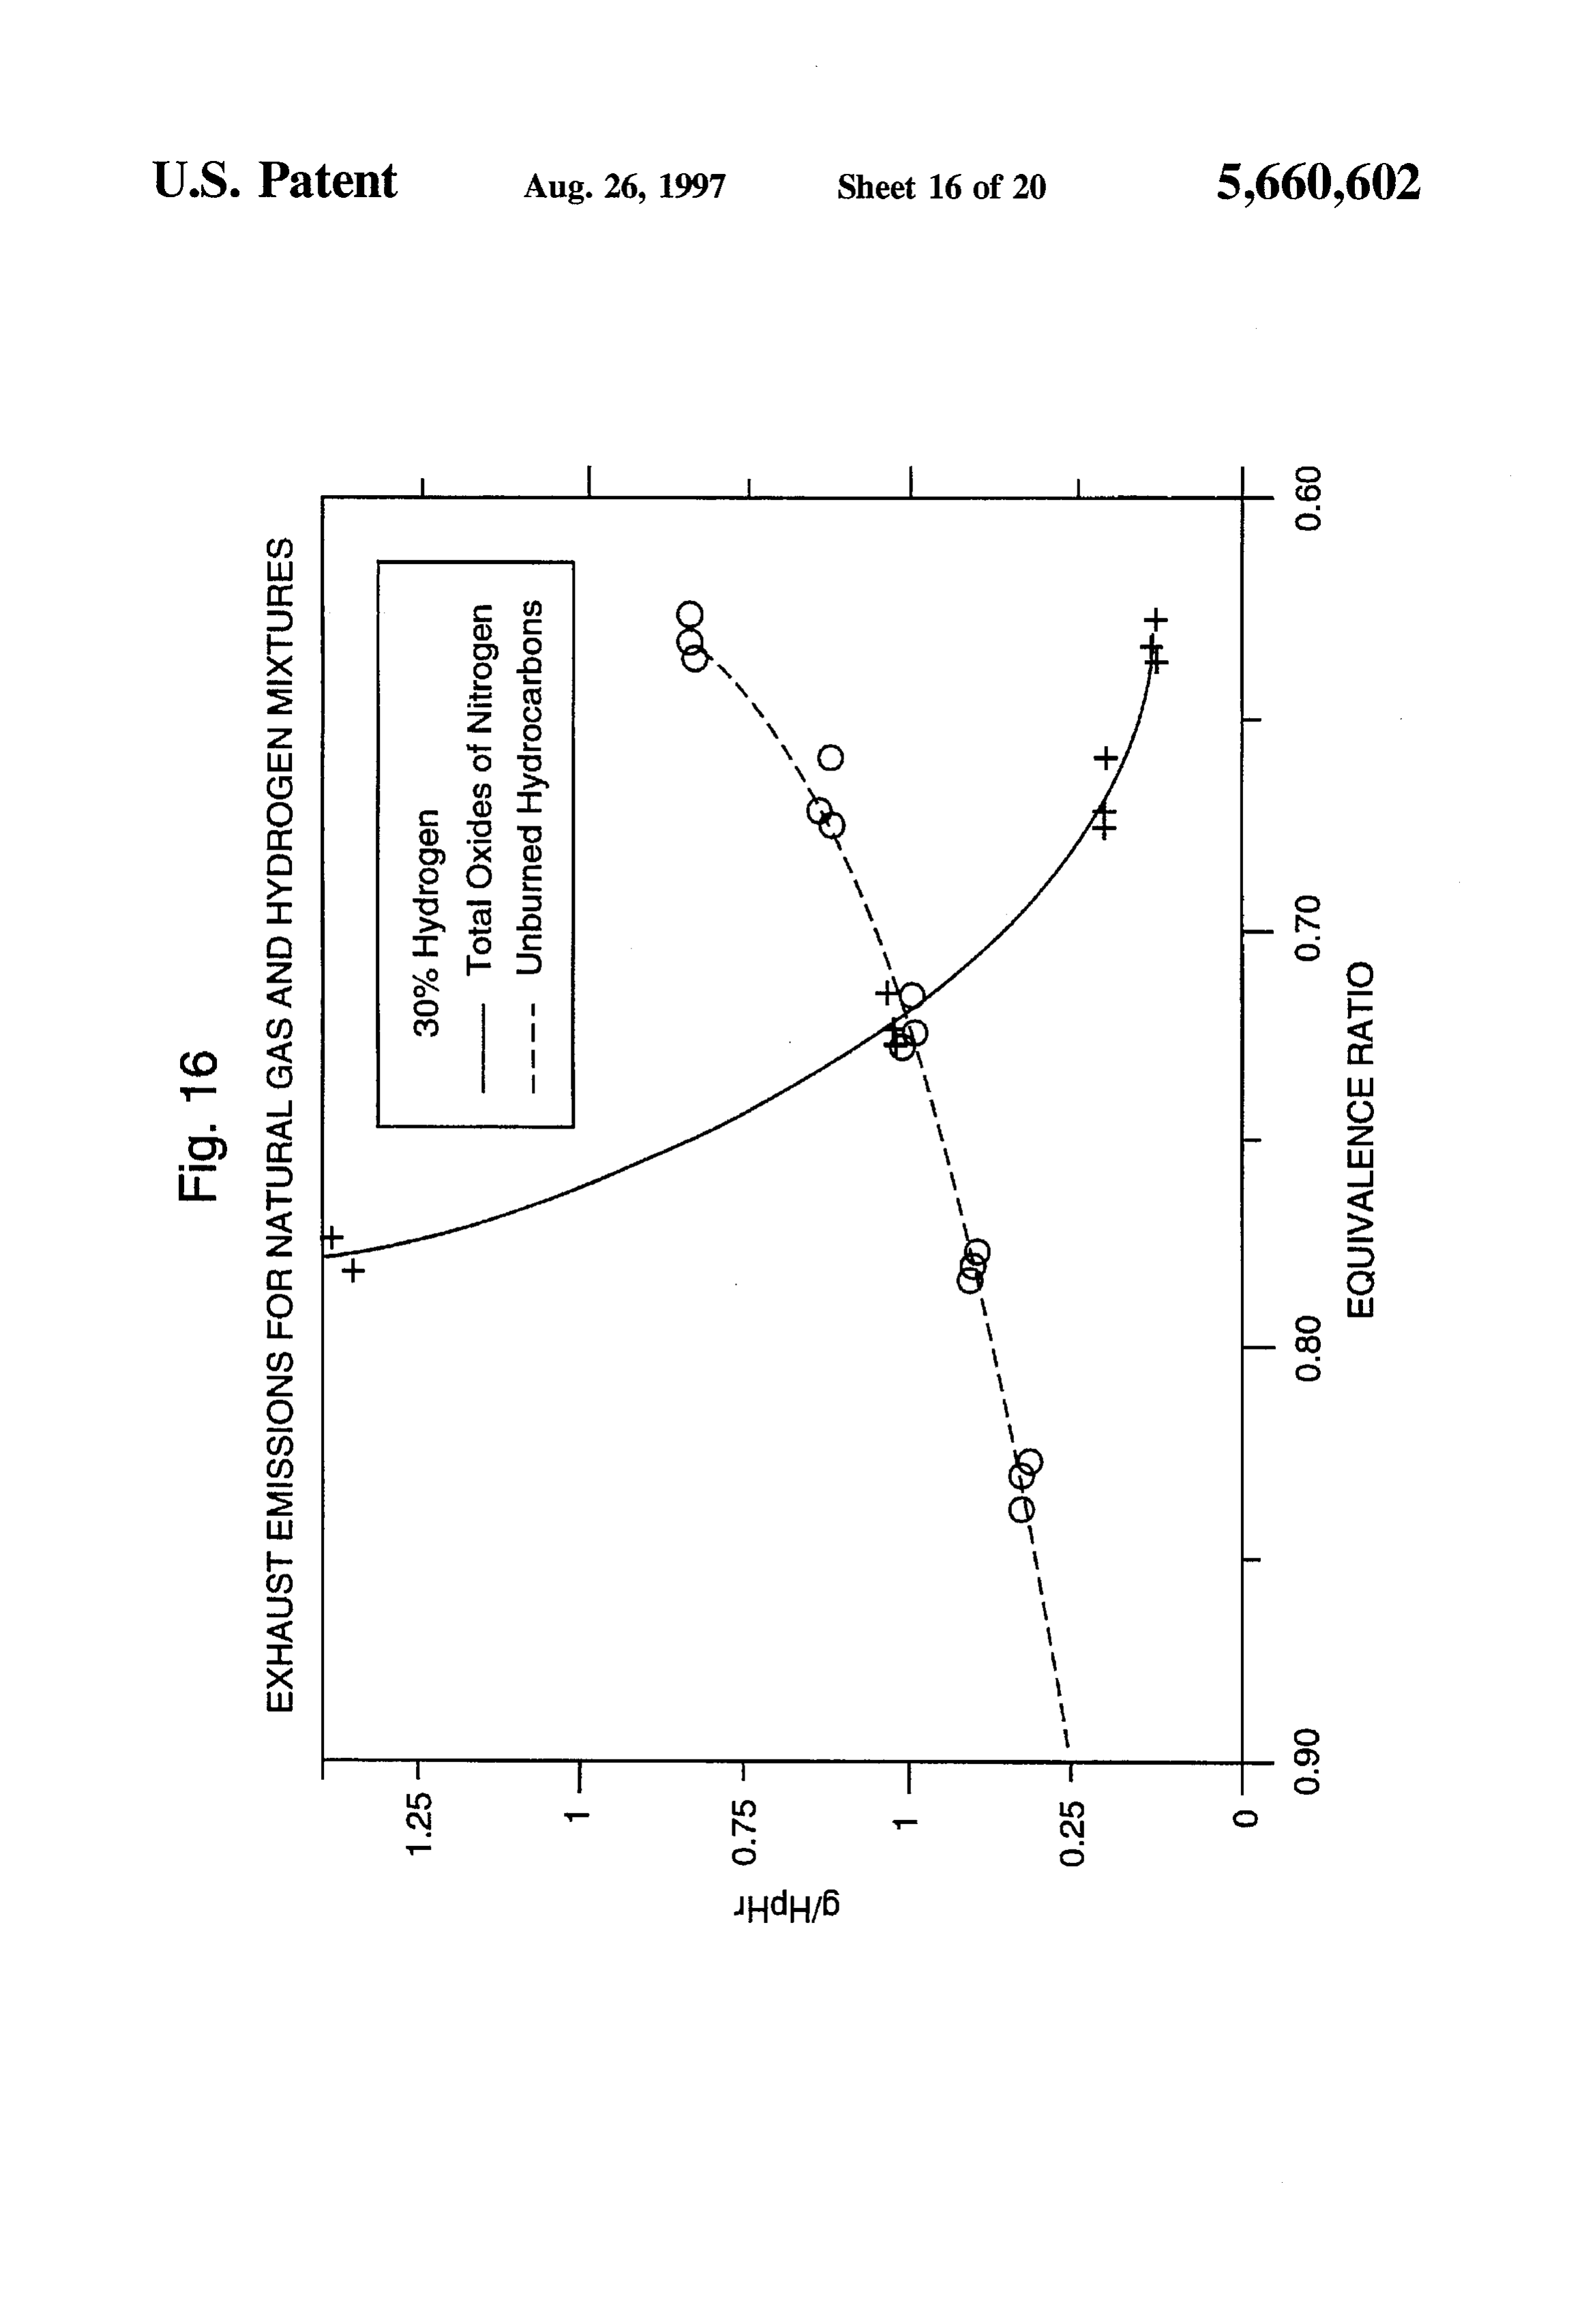
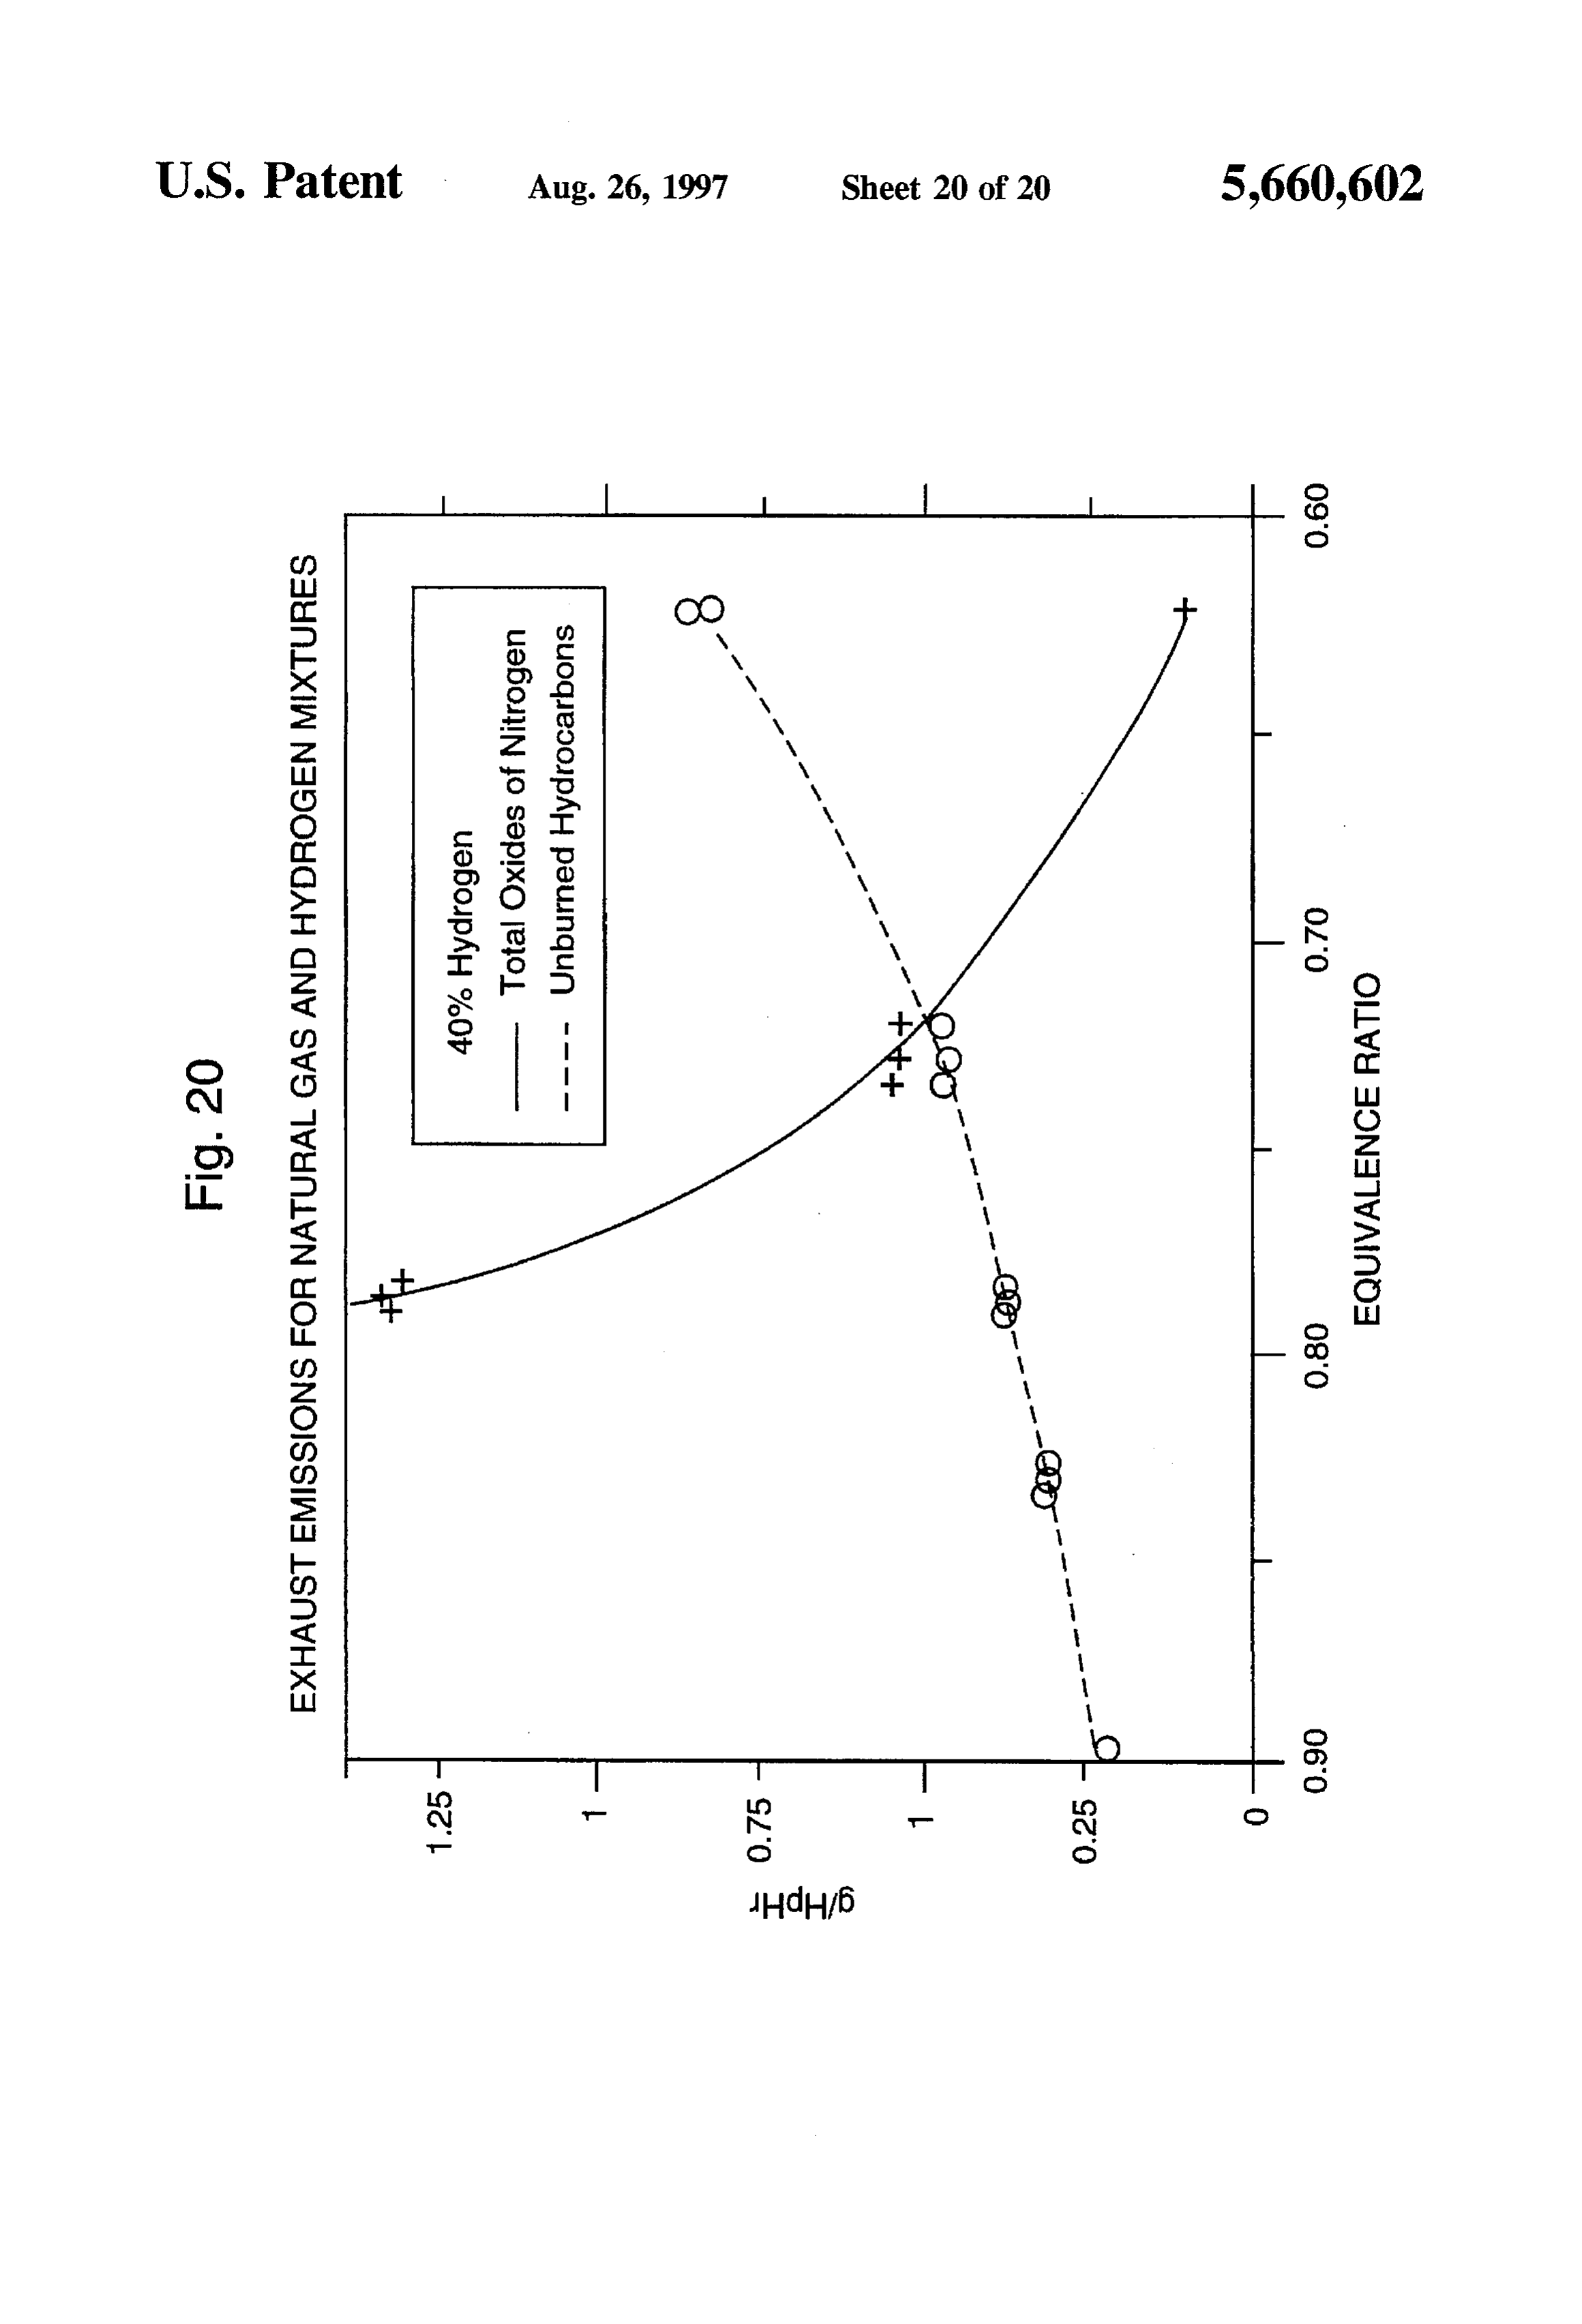
the harmful exhaust emissions produced by conventional FIG. 14 shows an enlarged sectional graph of FIG. 13 of combustion engines. exhaust emissions for natural gas and 28% hydrogen mix The third object of this invention is to provide a hydrogen tures in pans per million(PPM) vs. Equivalence Ratio. and natural gas mixture that can be used in existing gaseous 15 FIG. 15 shows a graph of exhaust emissions for natural vehicles without major modification and additions to those gas and 30% hydrogen mixtures in grams per horse power vehicles. hour(g/HipHr) vs. Equivalence ratio. The fourth object of this invention is to provide a hydro FIG. 16 shows an enlarged sectional graph of FIG. 15 of gen and natural gas mixture that can meet long term federal exhaust emissions for natural gas and 30% hydrogen mix and state emission requirements. 20 tures in grams per horse power hour(g/HpHr) vs. Equiva The fifth object of this invention is to provide a hydrogen lence ratio.
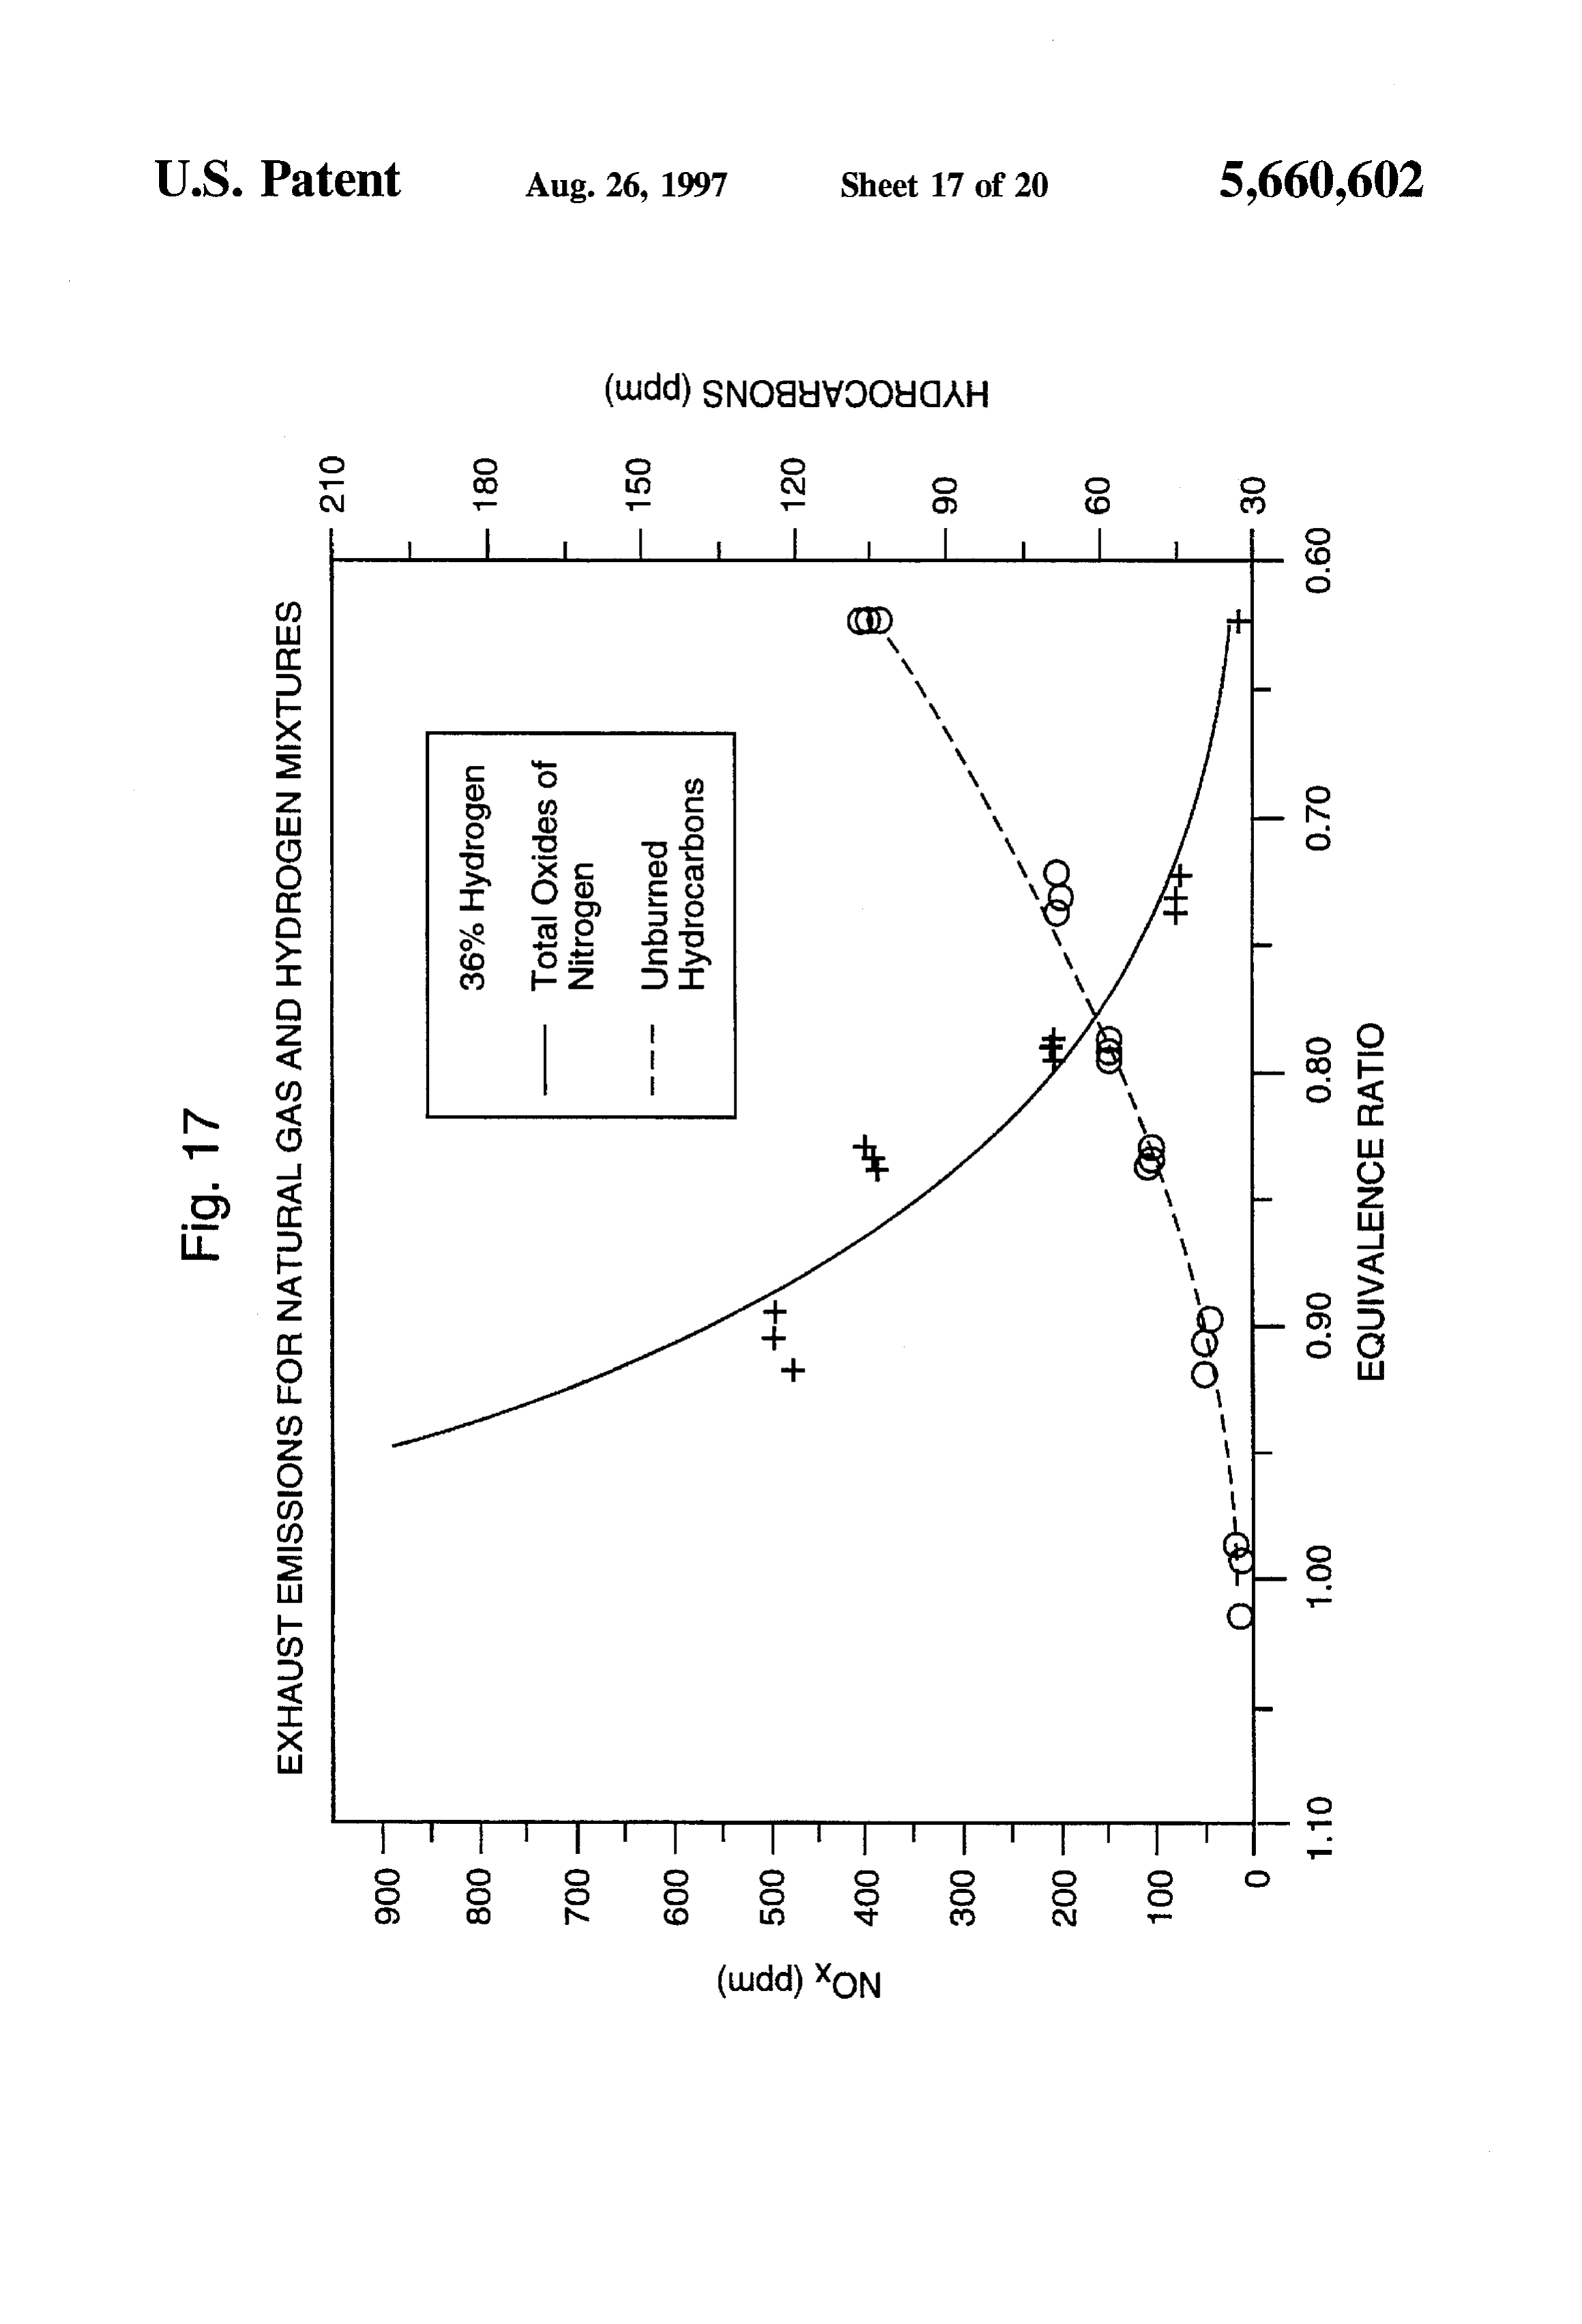
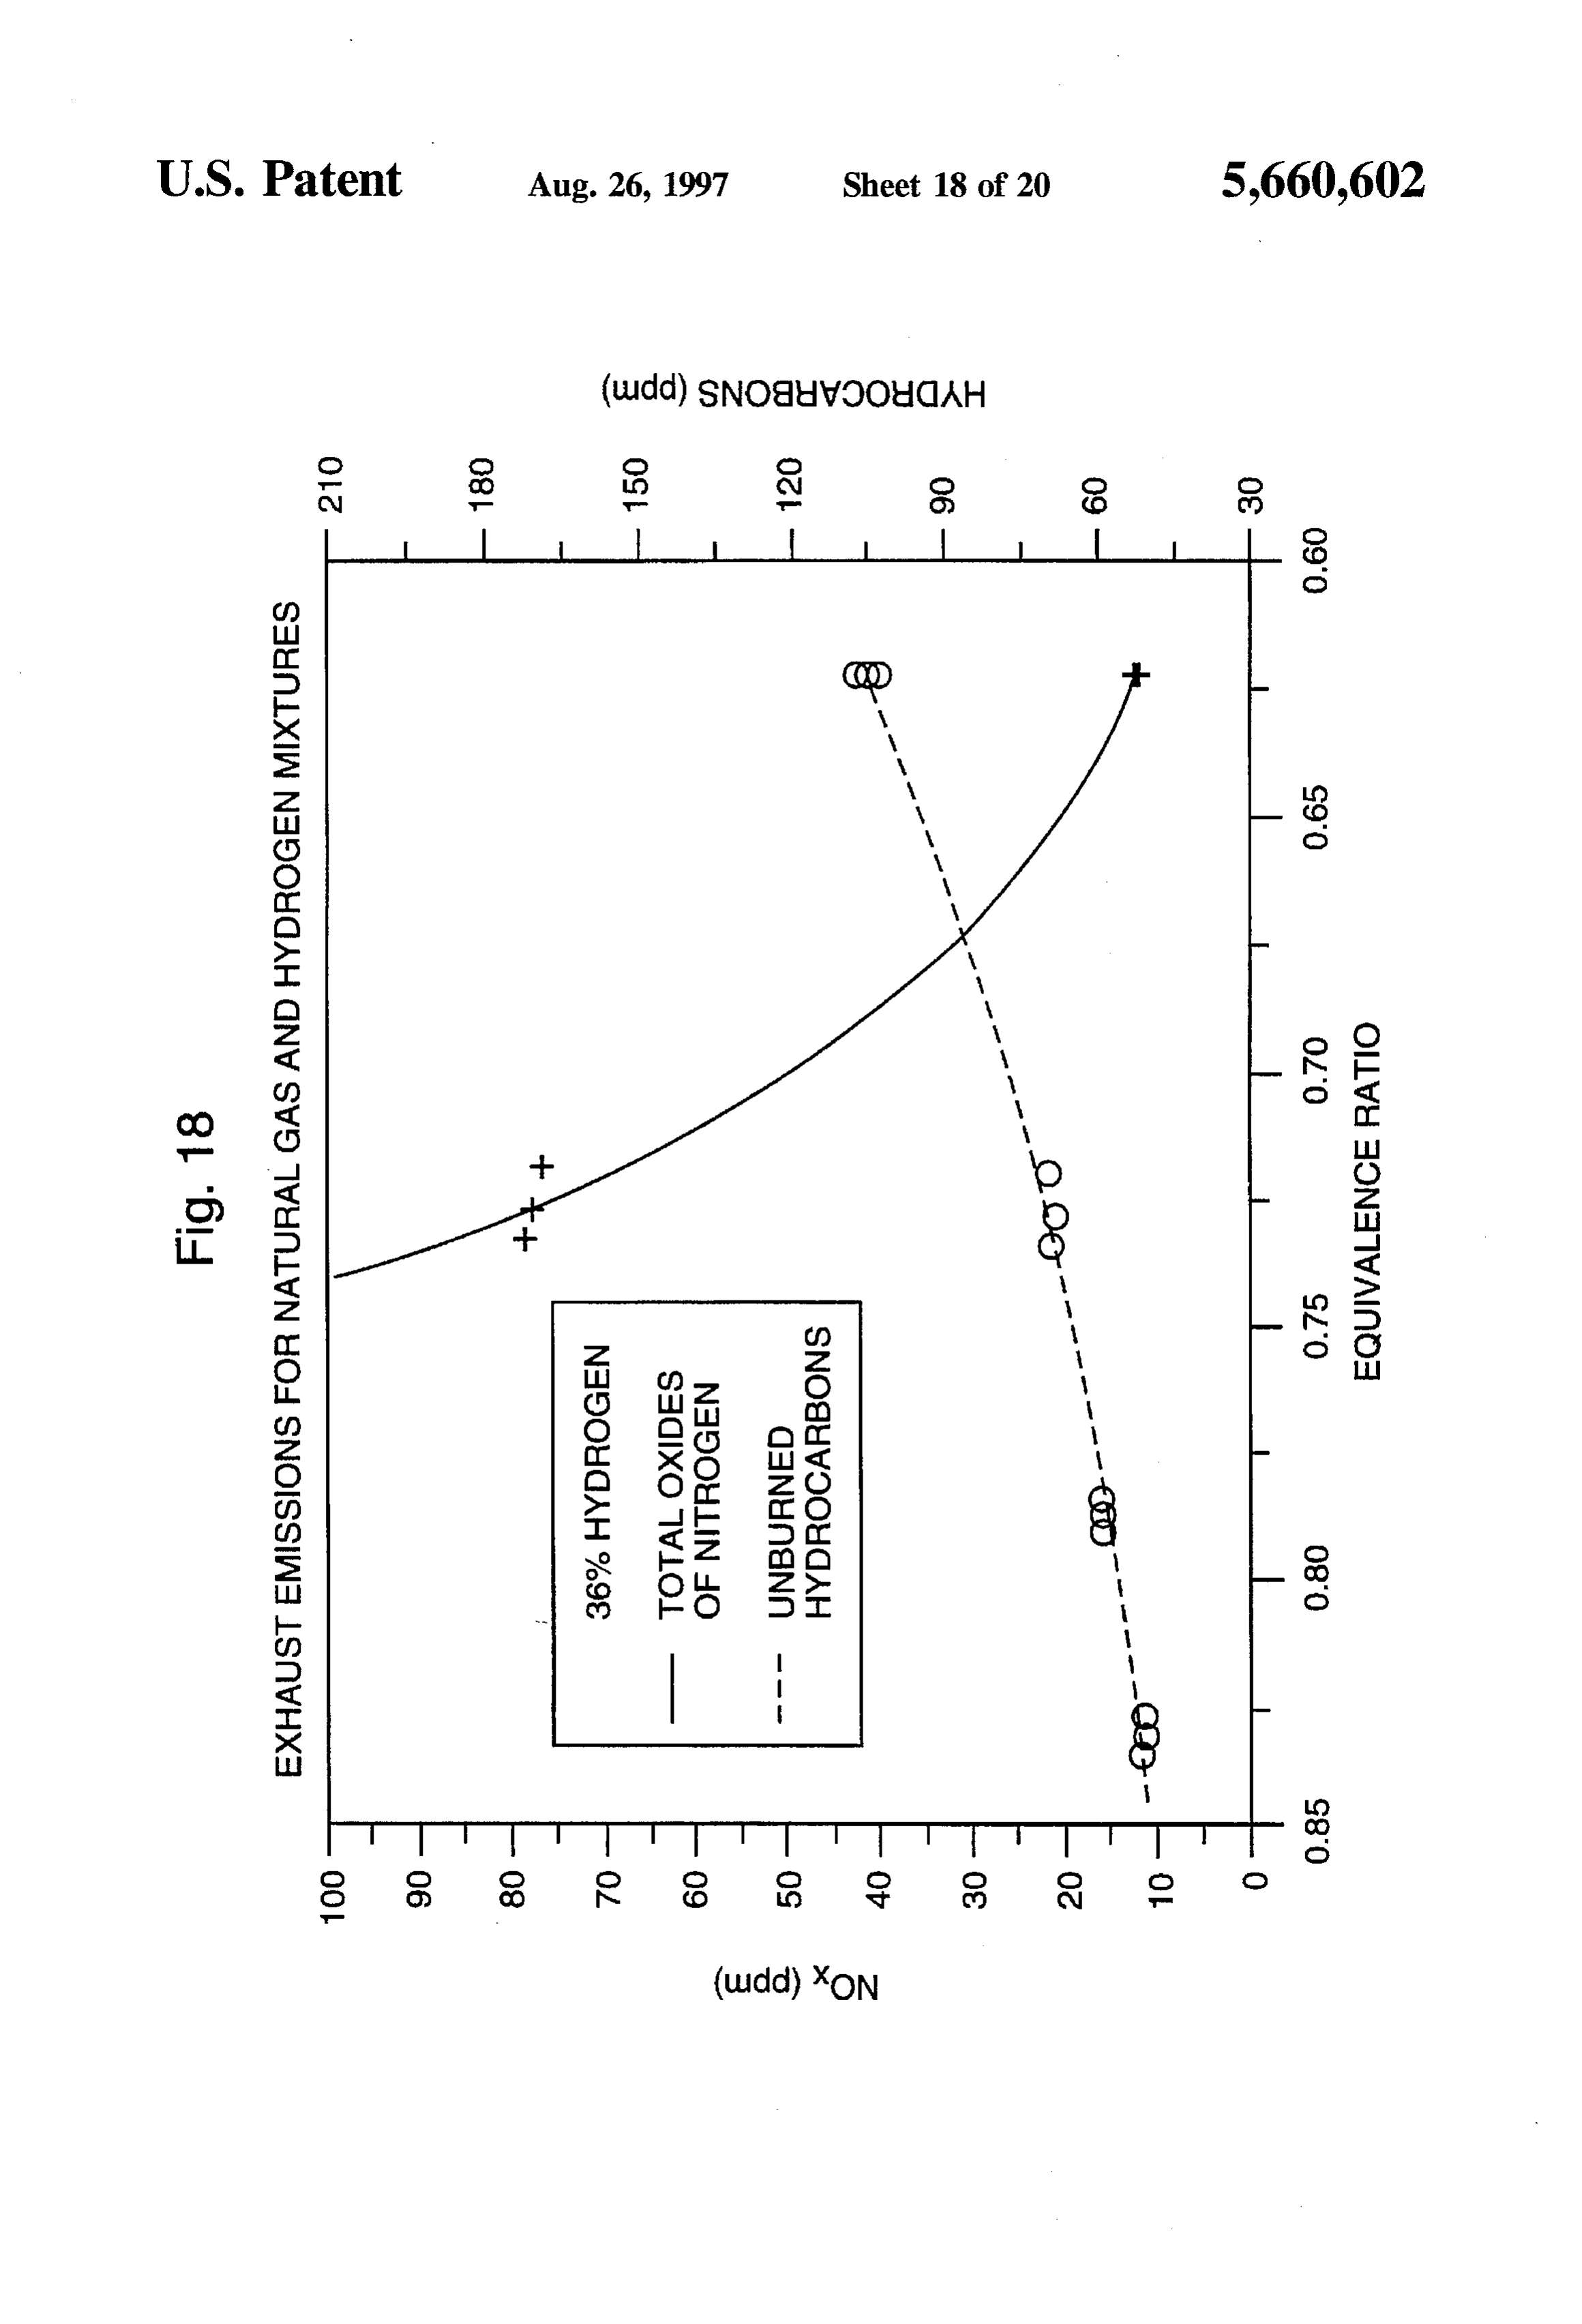
and natural gas fuel mixture that optimizes the cost of the FIG. 17 shows a graph of exhaust emissions for natural fuel against exhaust emissions. gas and 36% hydrogen mixtures in parts per million(PPM) The sixth object of this invention is to provide a hydrogen 25 vs. Equivalence Ratio.
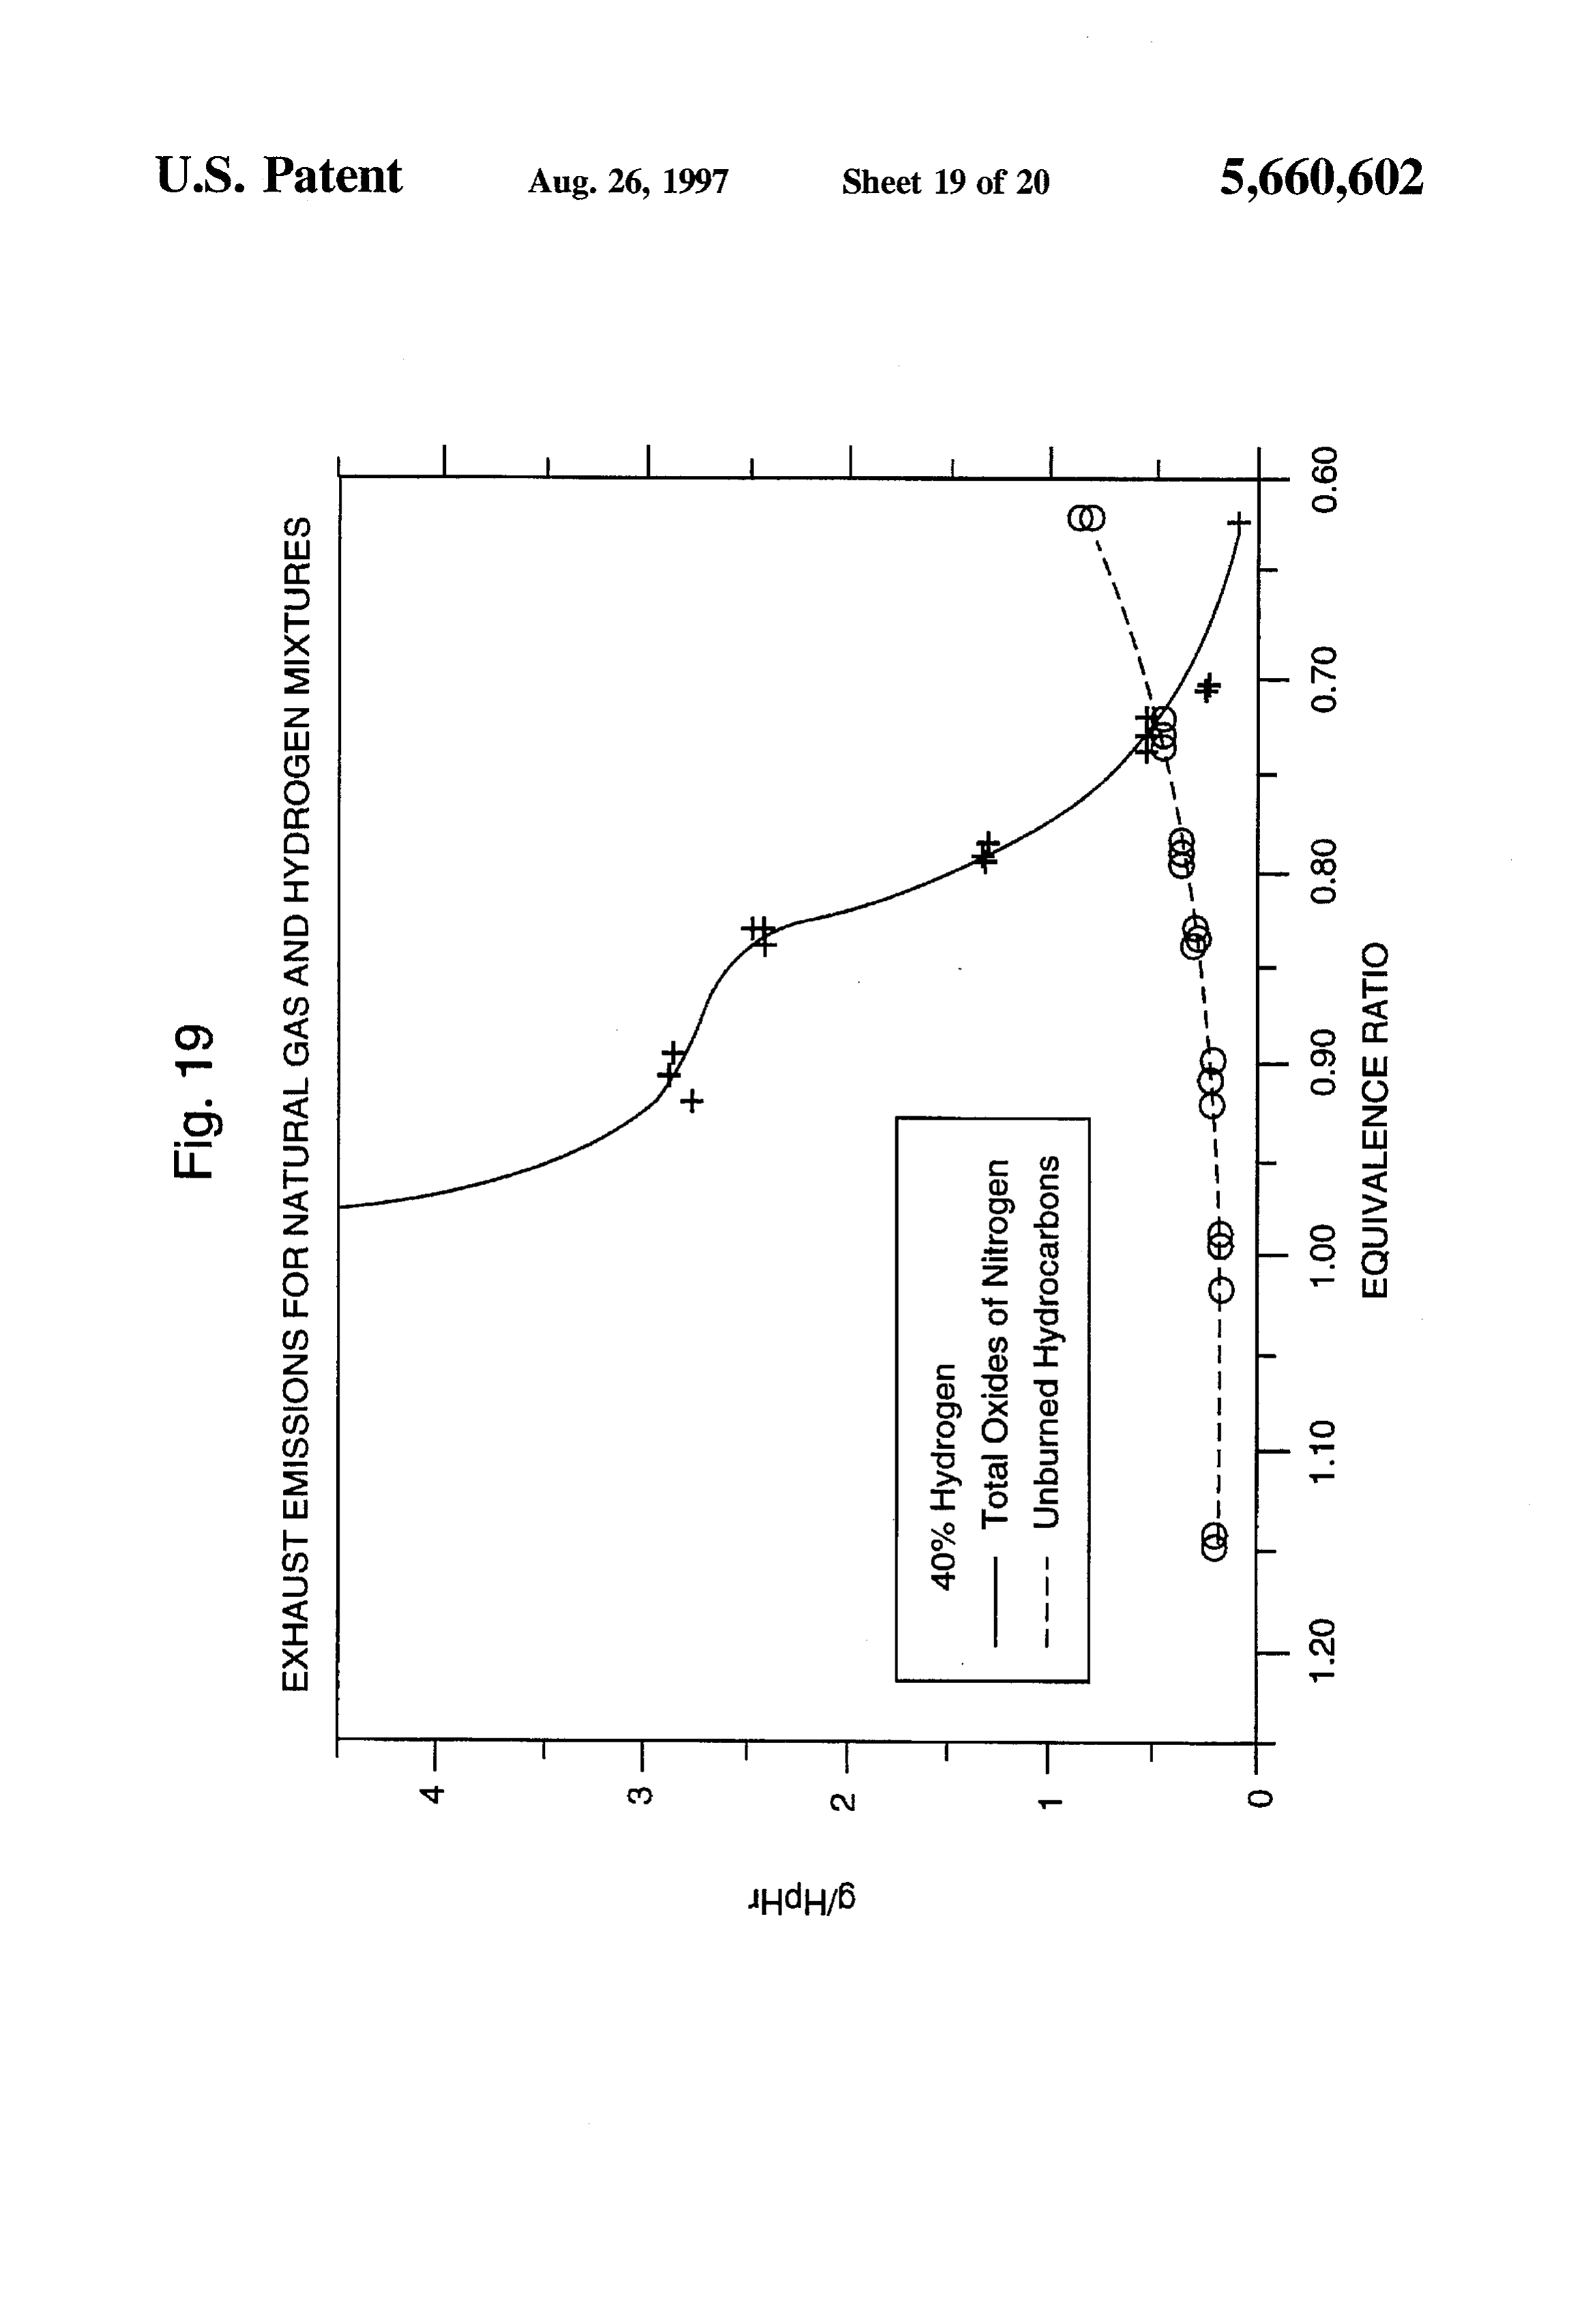
and natural gas fuel mixture that contains approximately 21 FIG. 18 shows an enlarged sectional graph of FIG. 17 of to 50% hydrogen and the rest natural gas such as methane. exhaust emissions for natural gas and 36% hydrogen mix Further objects and advantages of this invention will be tures in parts per million(PPM) vs. Equivalence Ratio. apparent from the following detailed description of a pres FIG. 19 shows a graph of exhaust emissions for natural ently preferred embodiment which is illustrated schemati gas and 40% hydrogen mixtures in grams per horse power cally in the accompanying drawings. hour(g/HipHr) vs. Equivalence ratio. FIG. 20 shows an enlarged sectional graph of FIG. 19 of
BRIEF DESCRIPTION OF THE FIGURES exhaust emissions for natural gas and 40% hydrogen mix tures in grams per horse power hour(g/HpHr) vs. Equiva
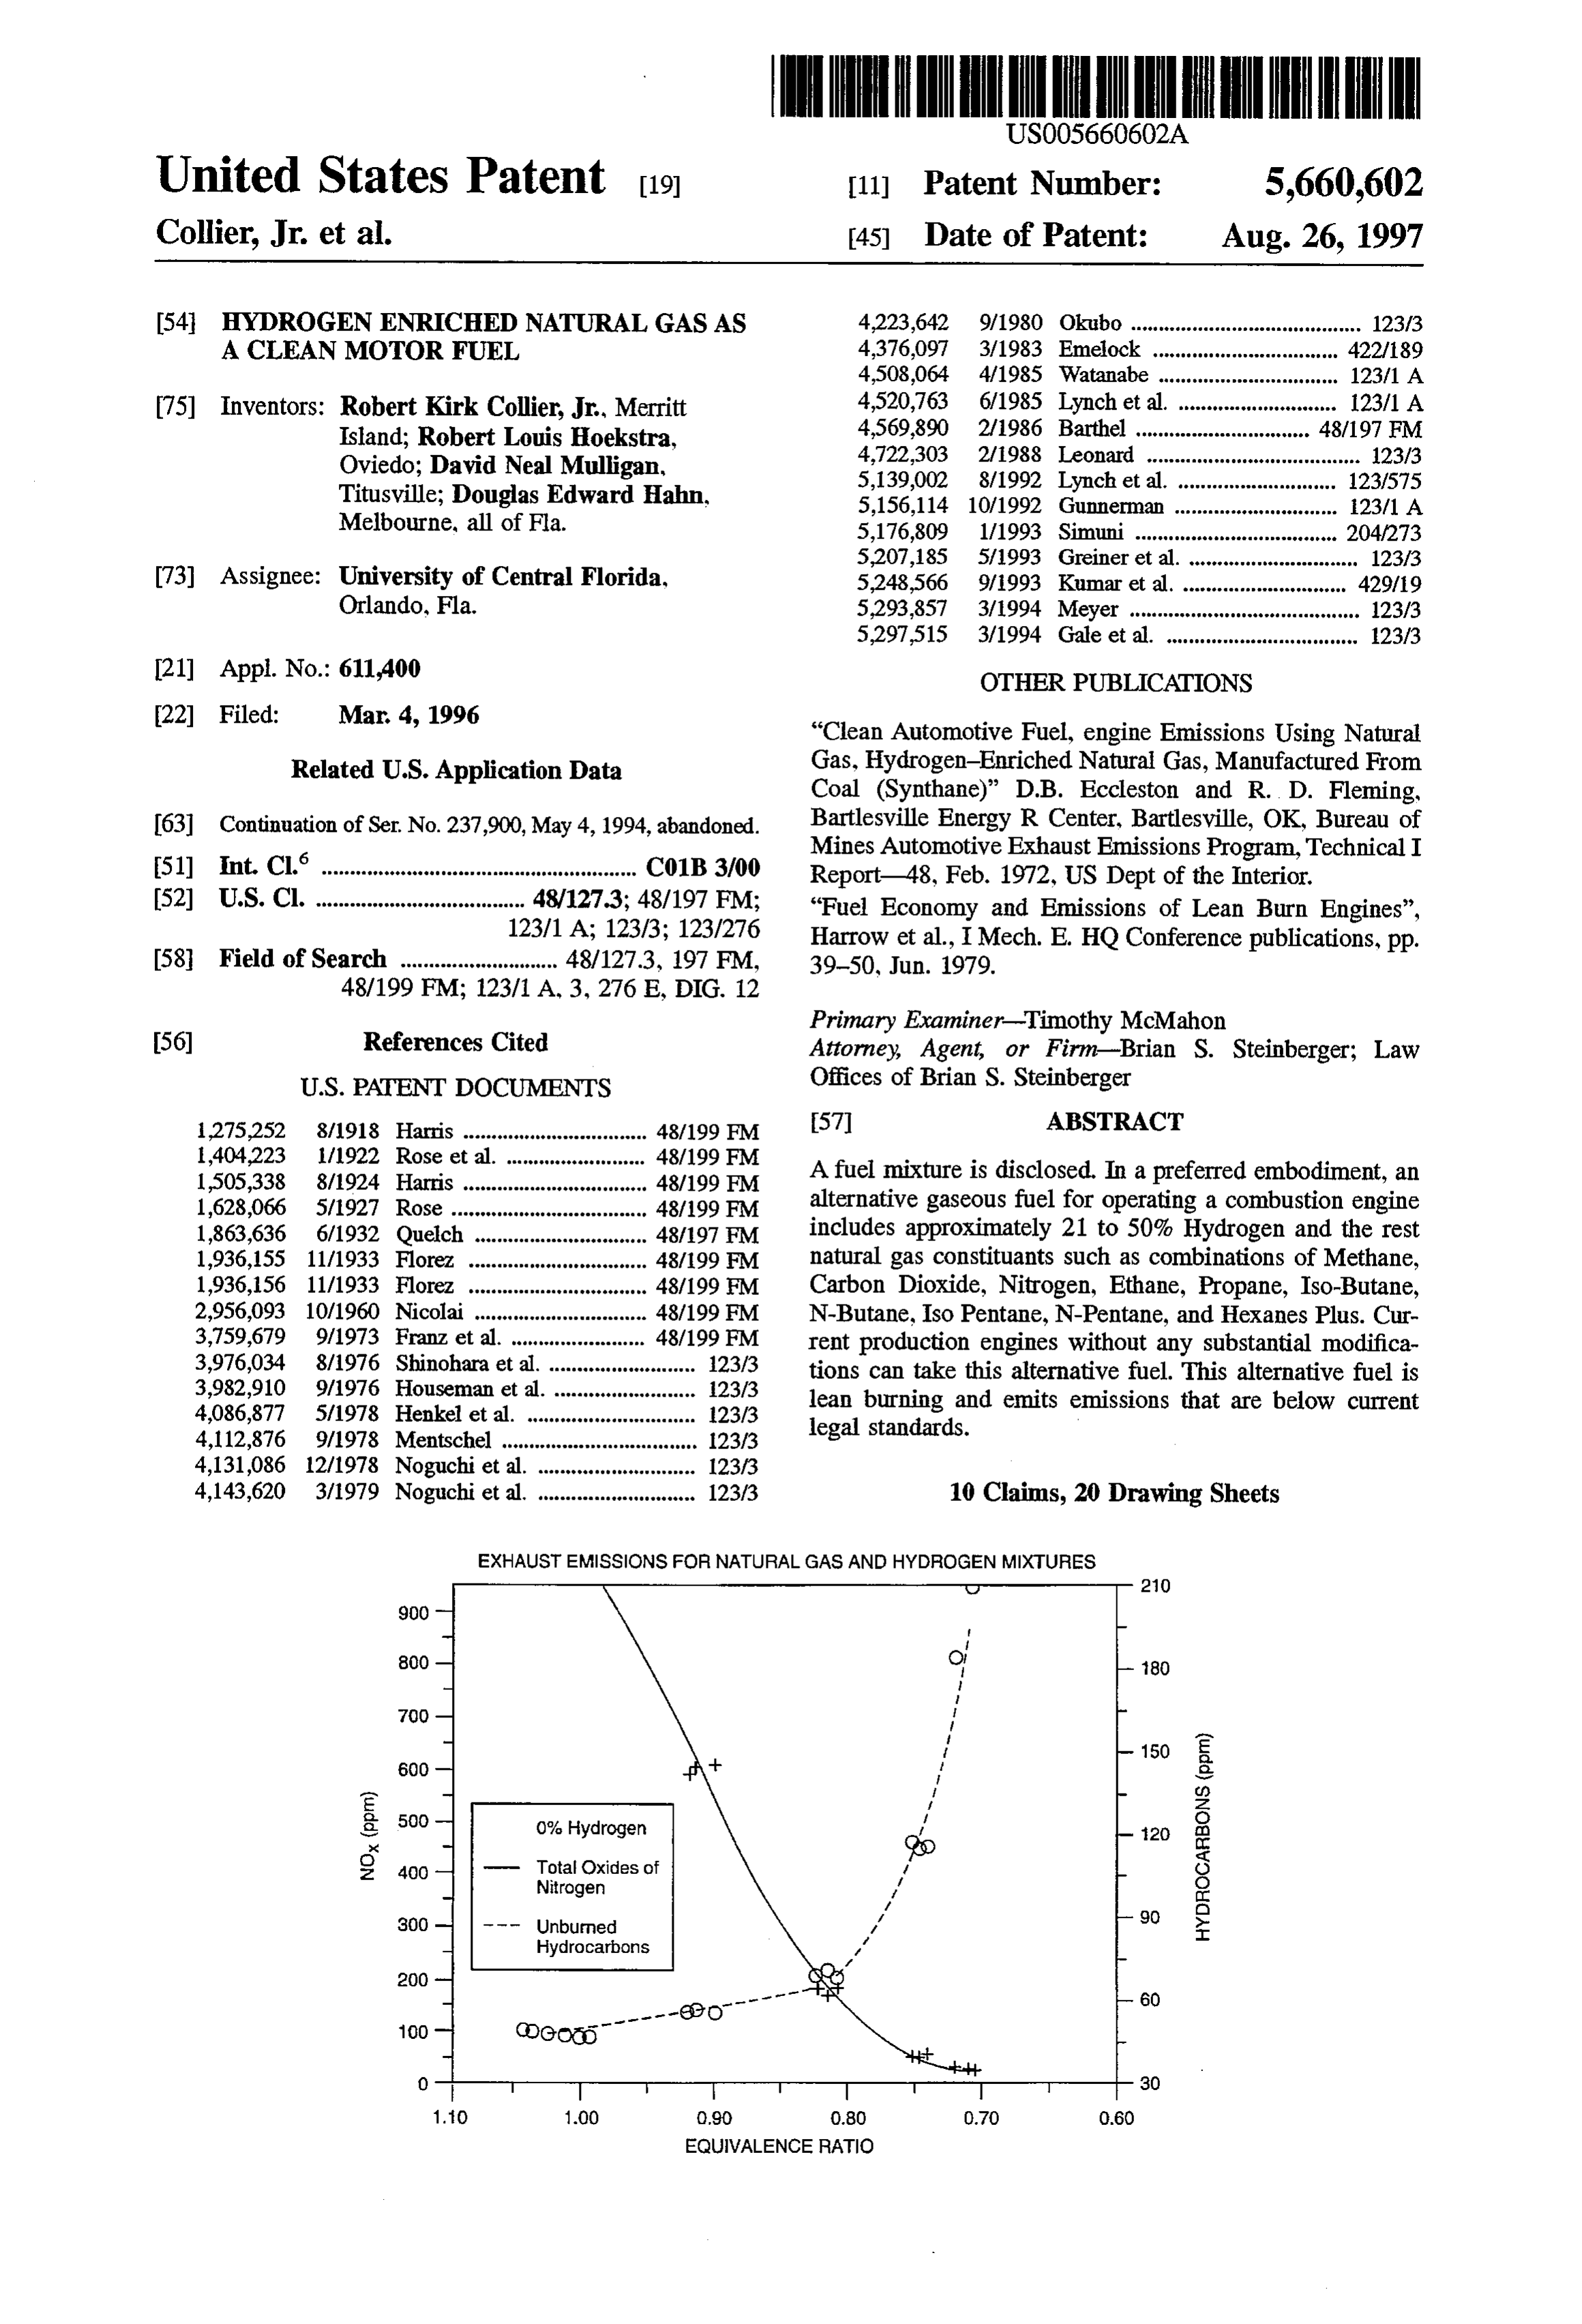
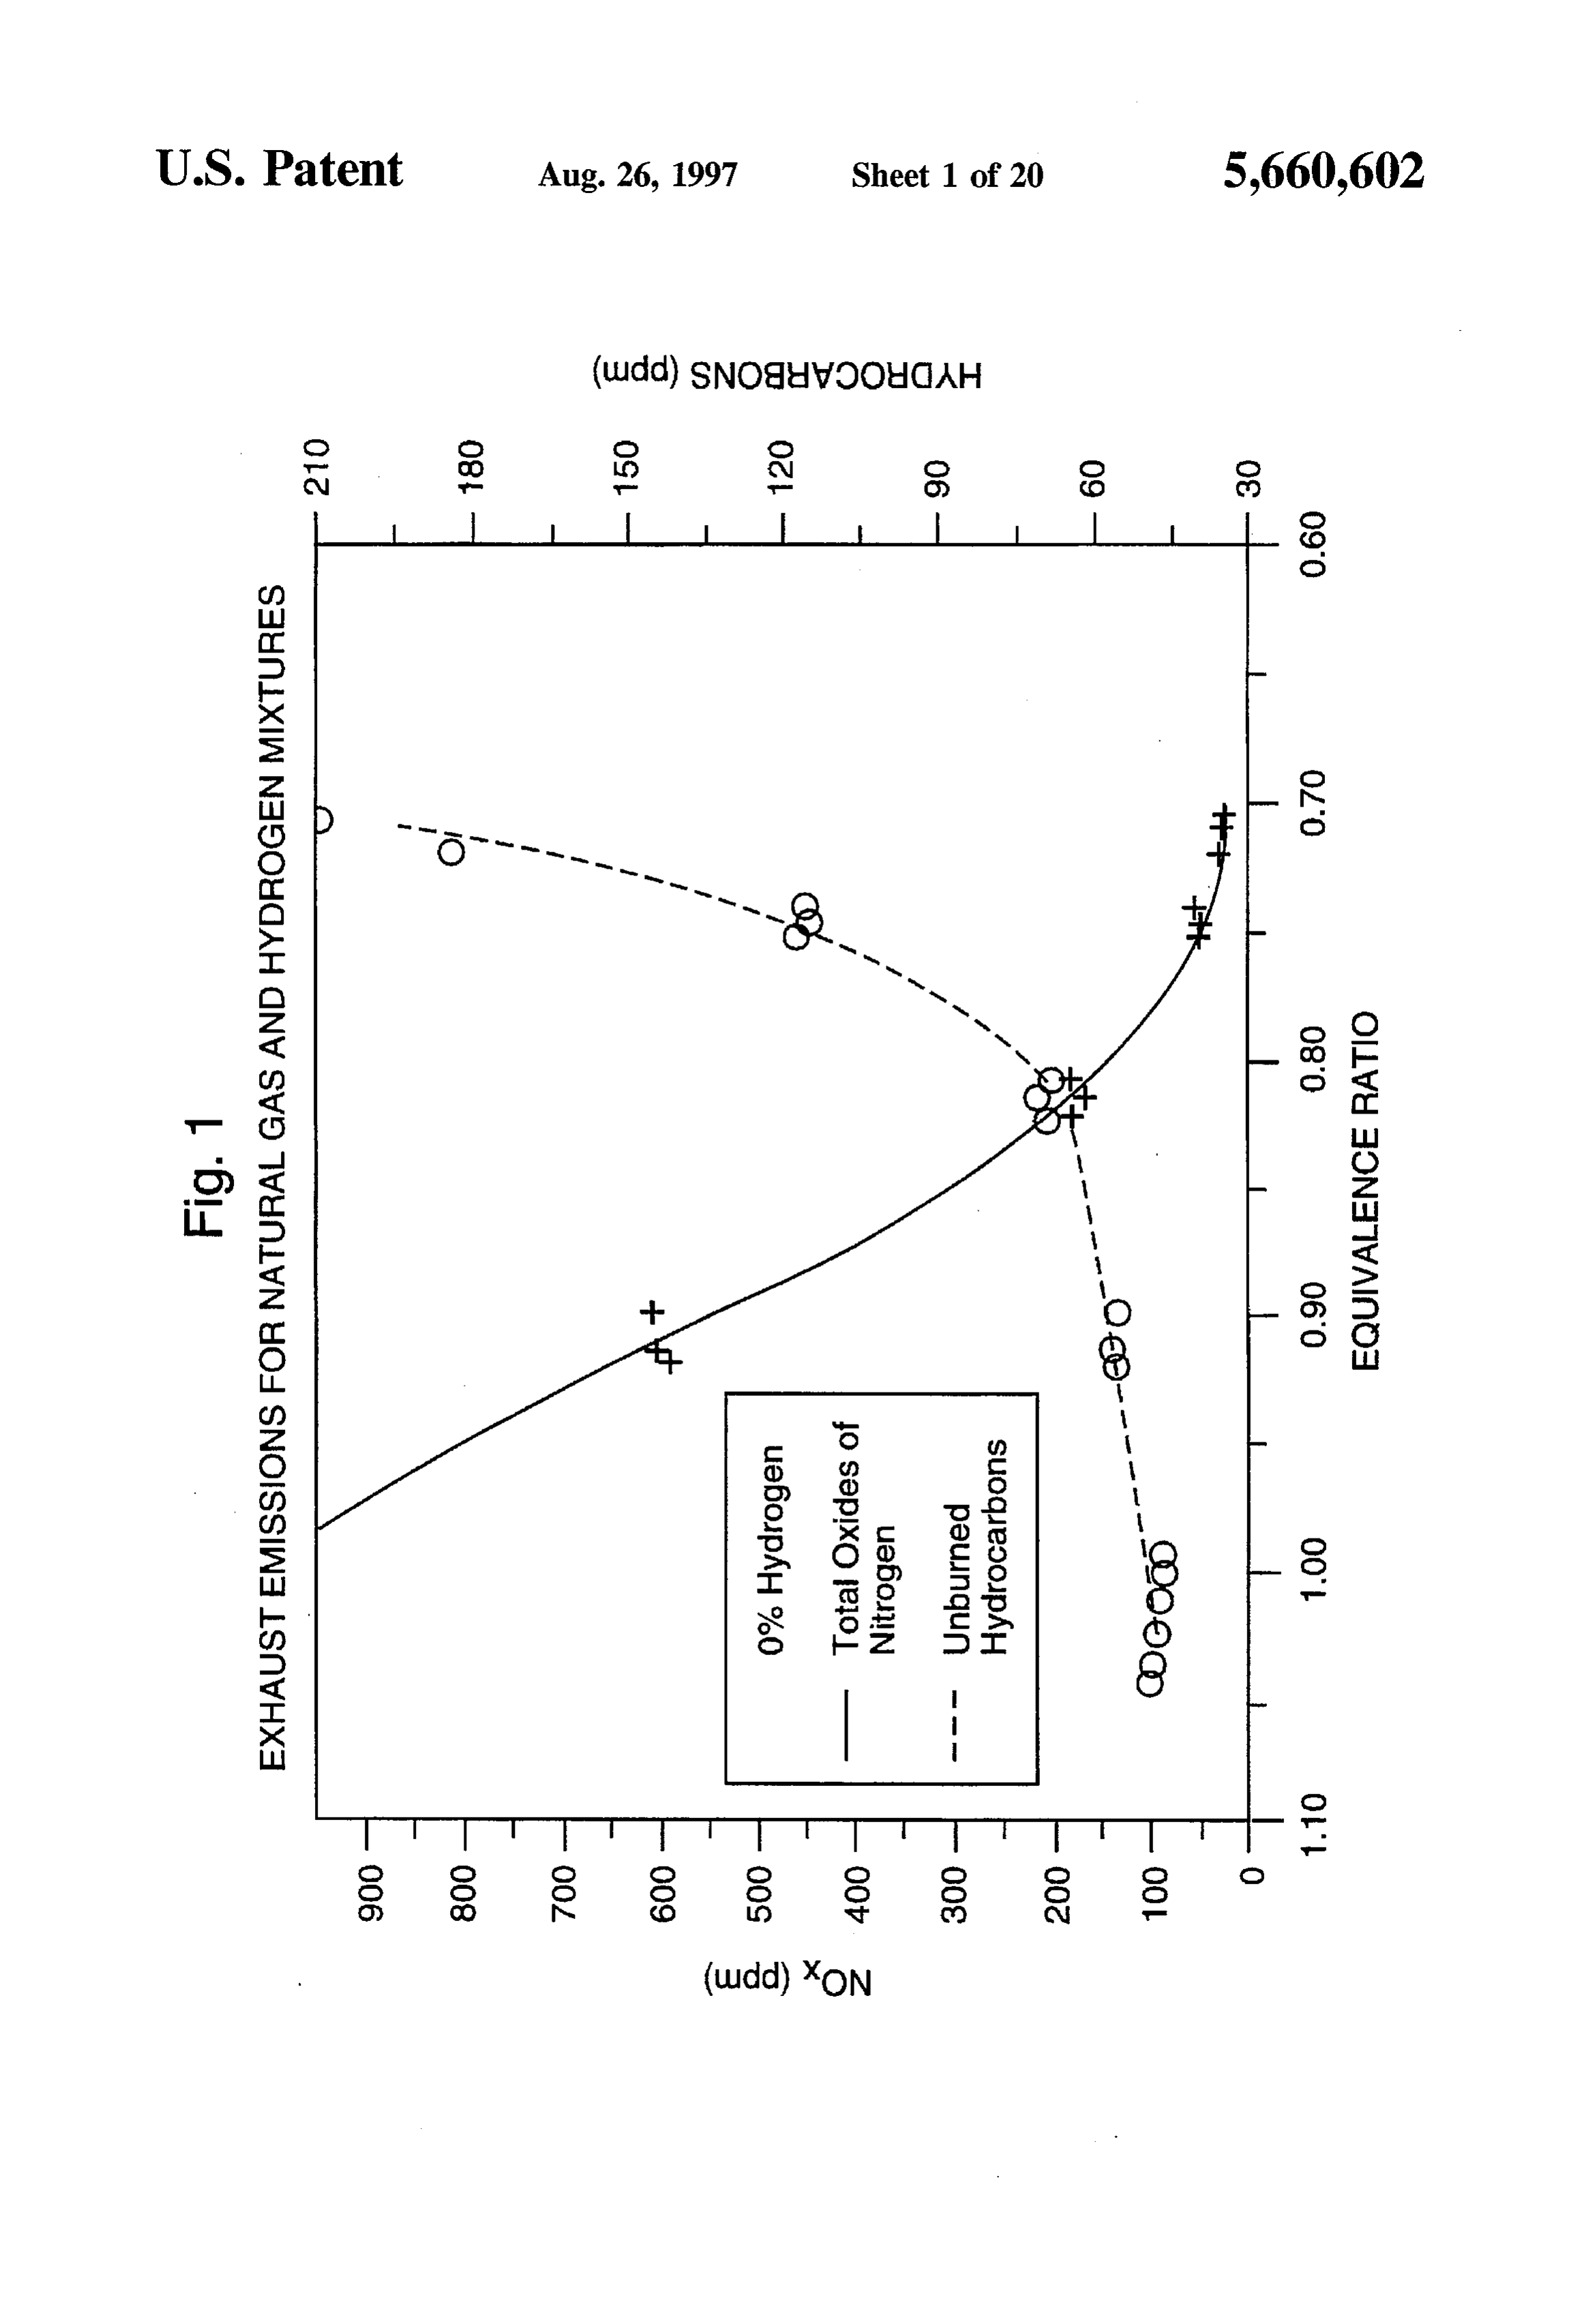
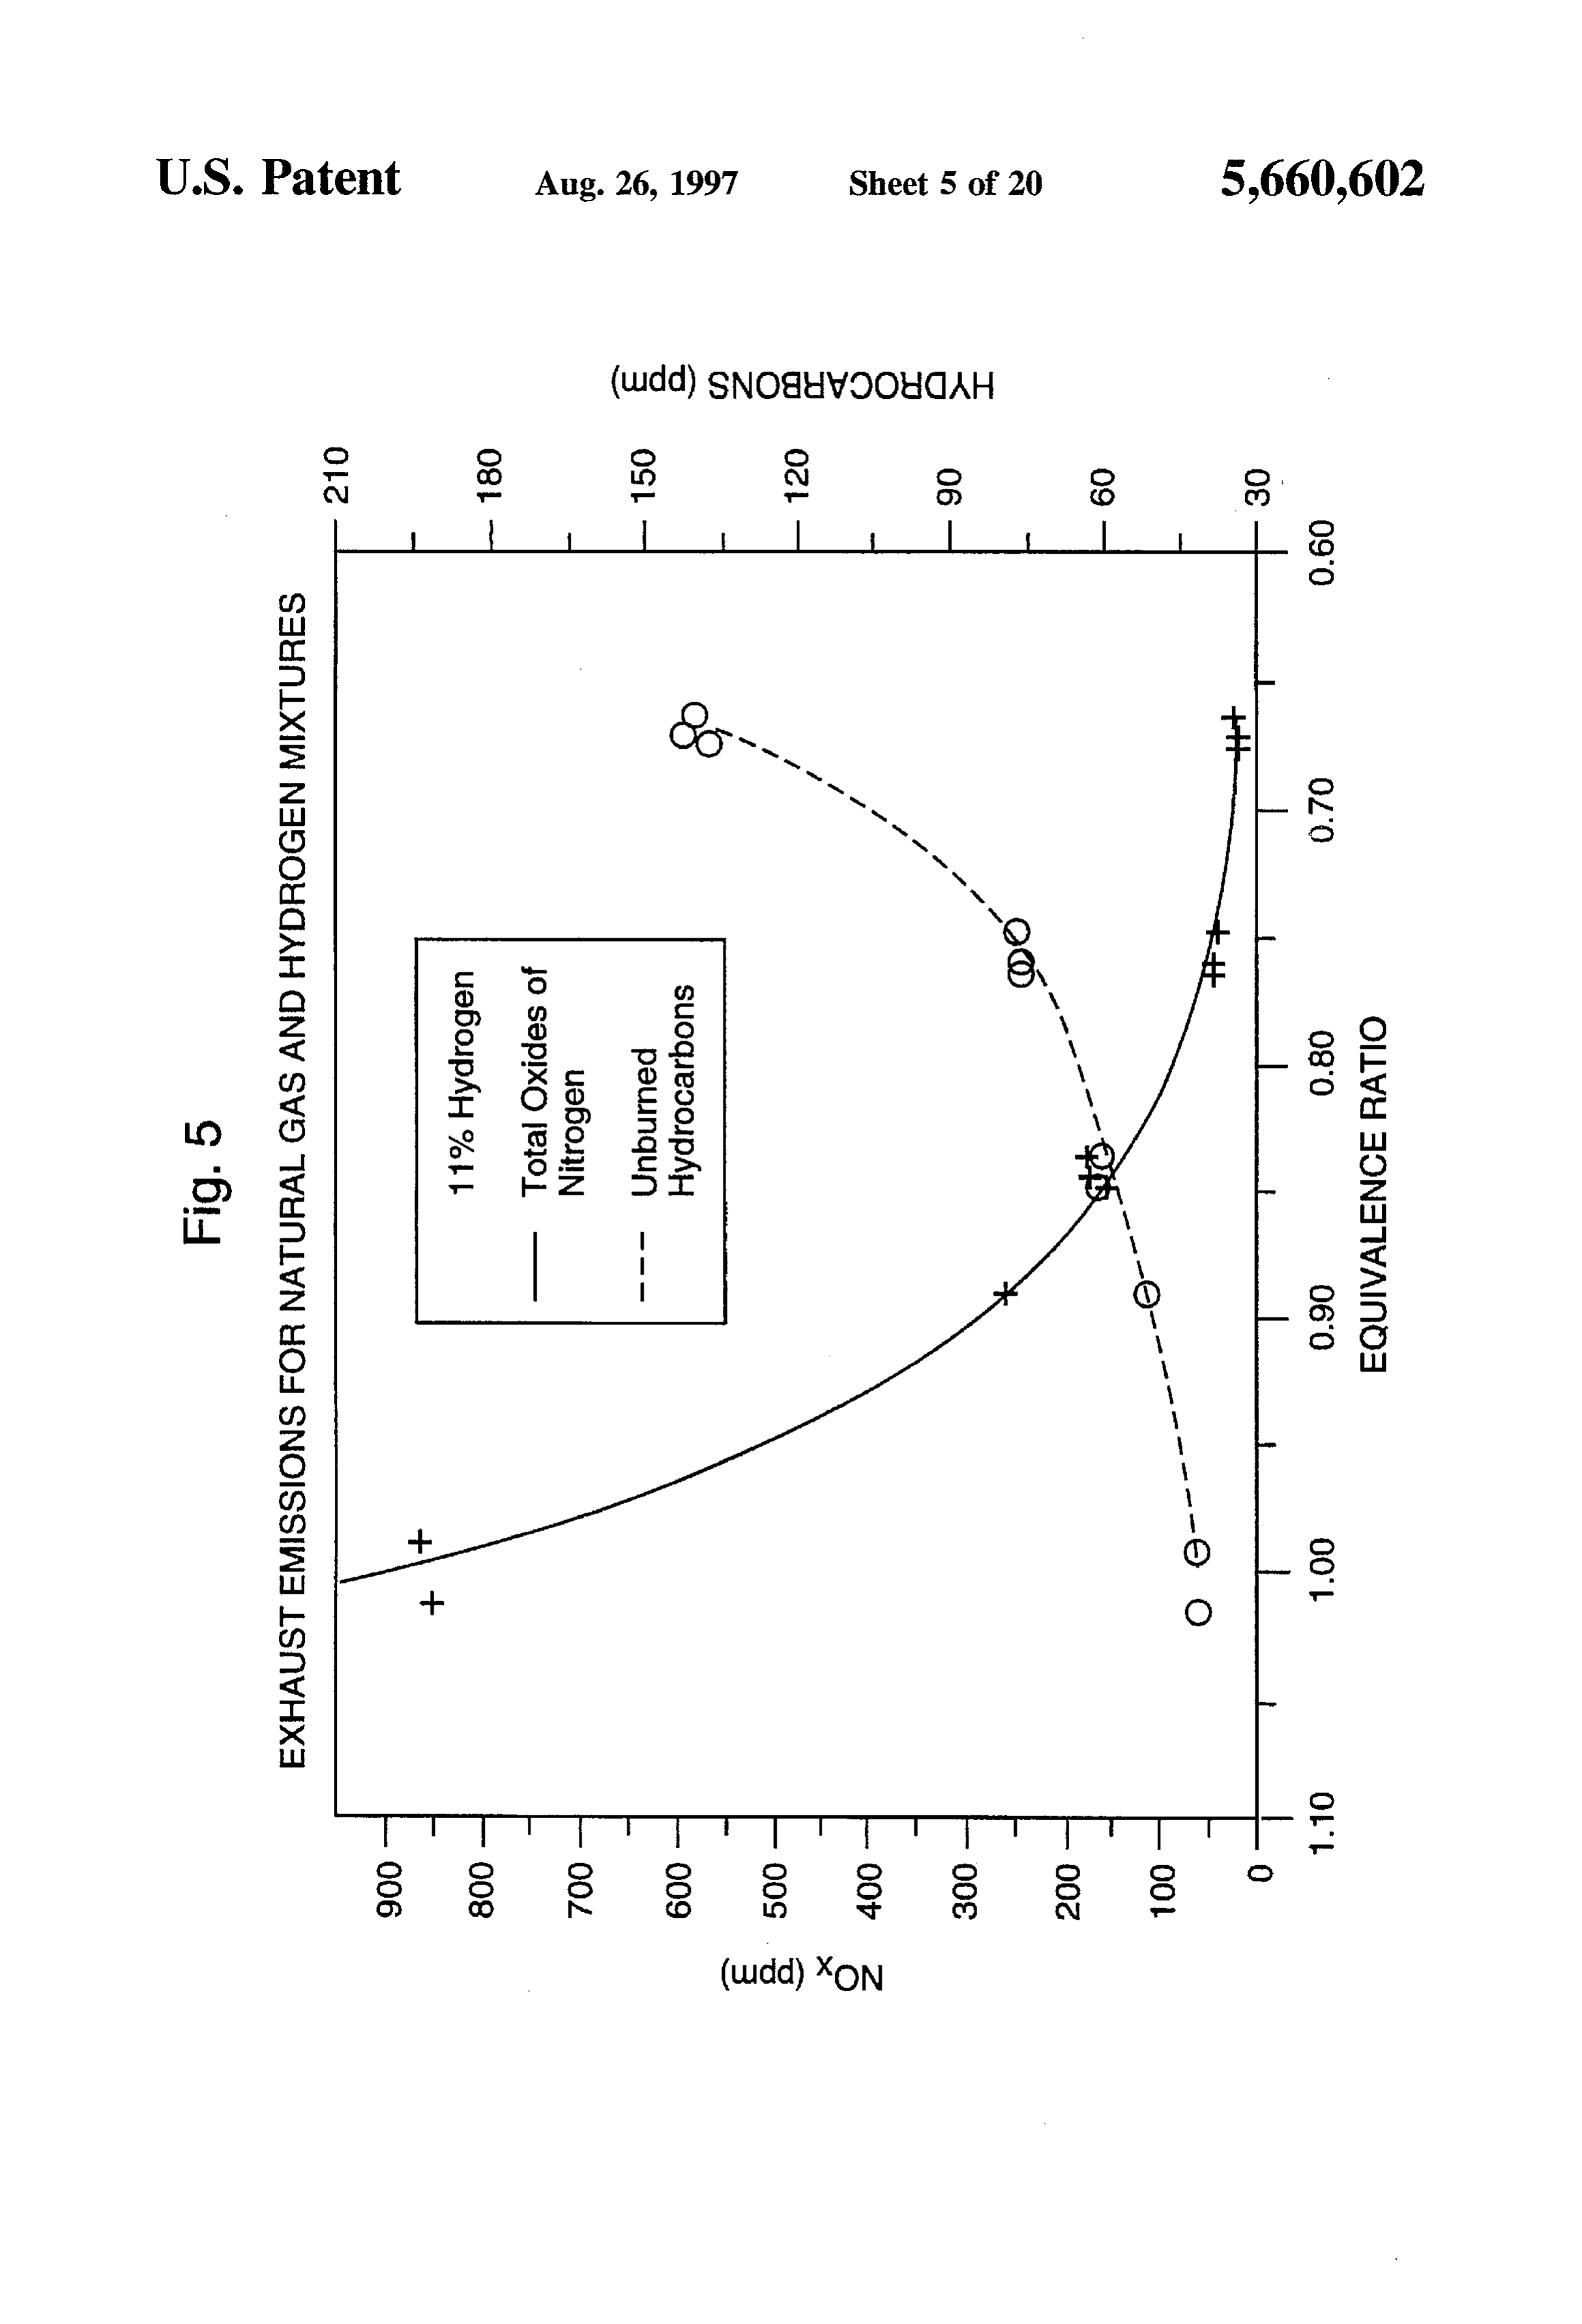
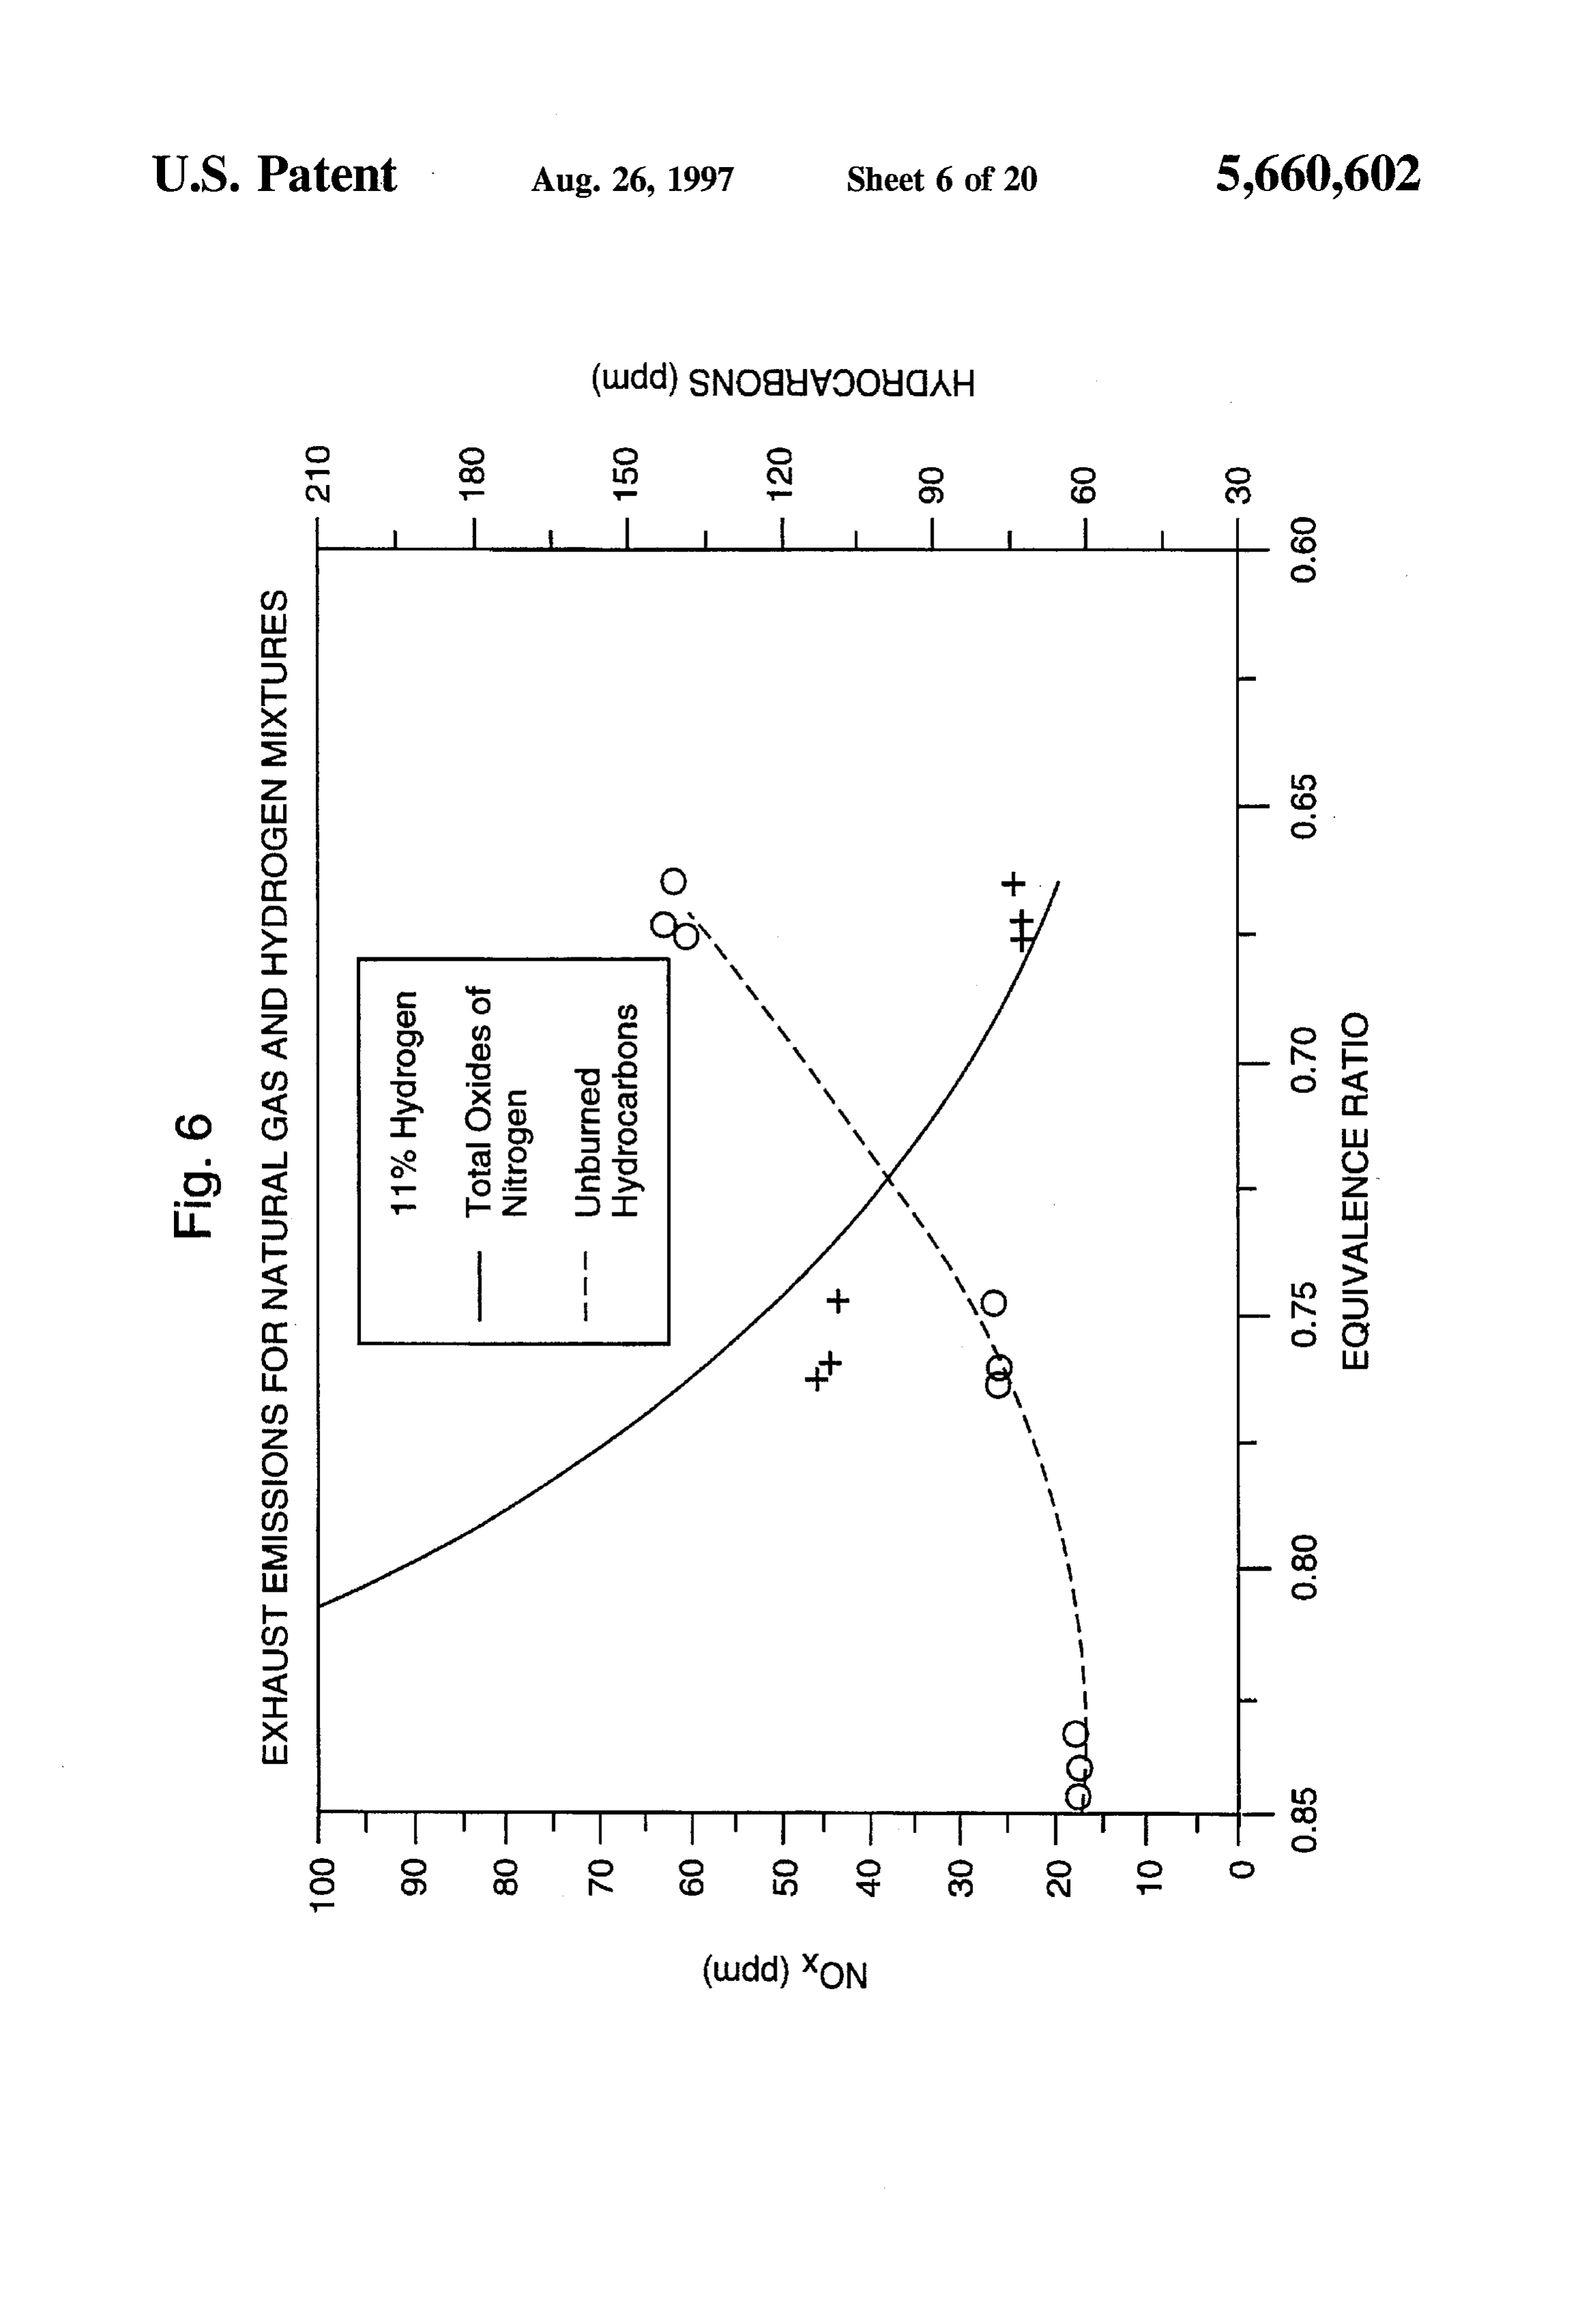
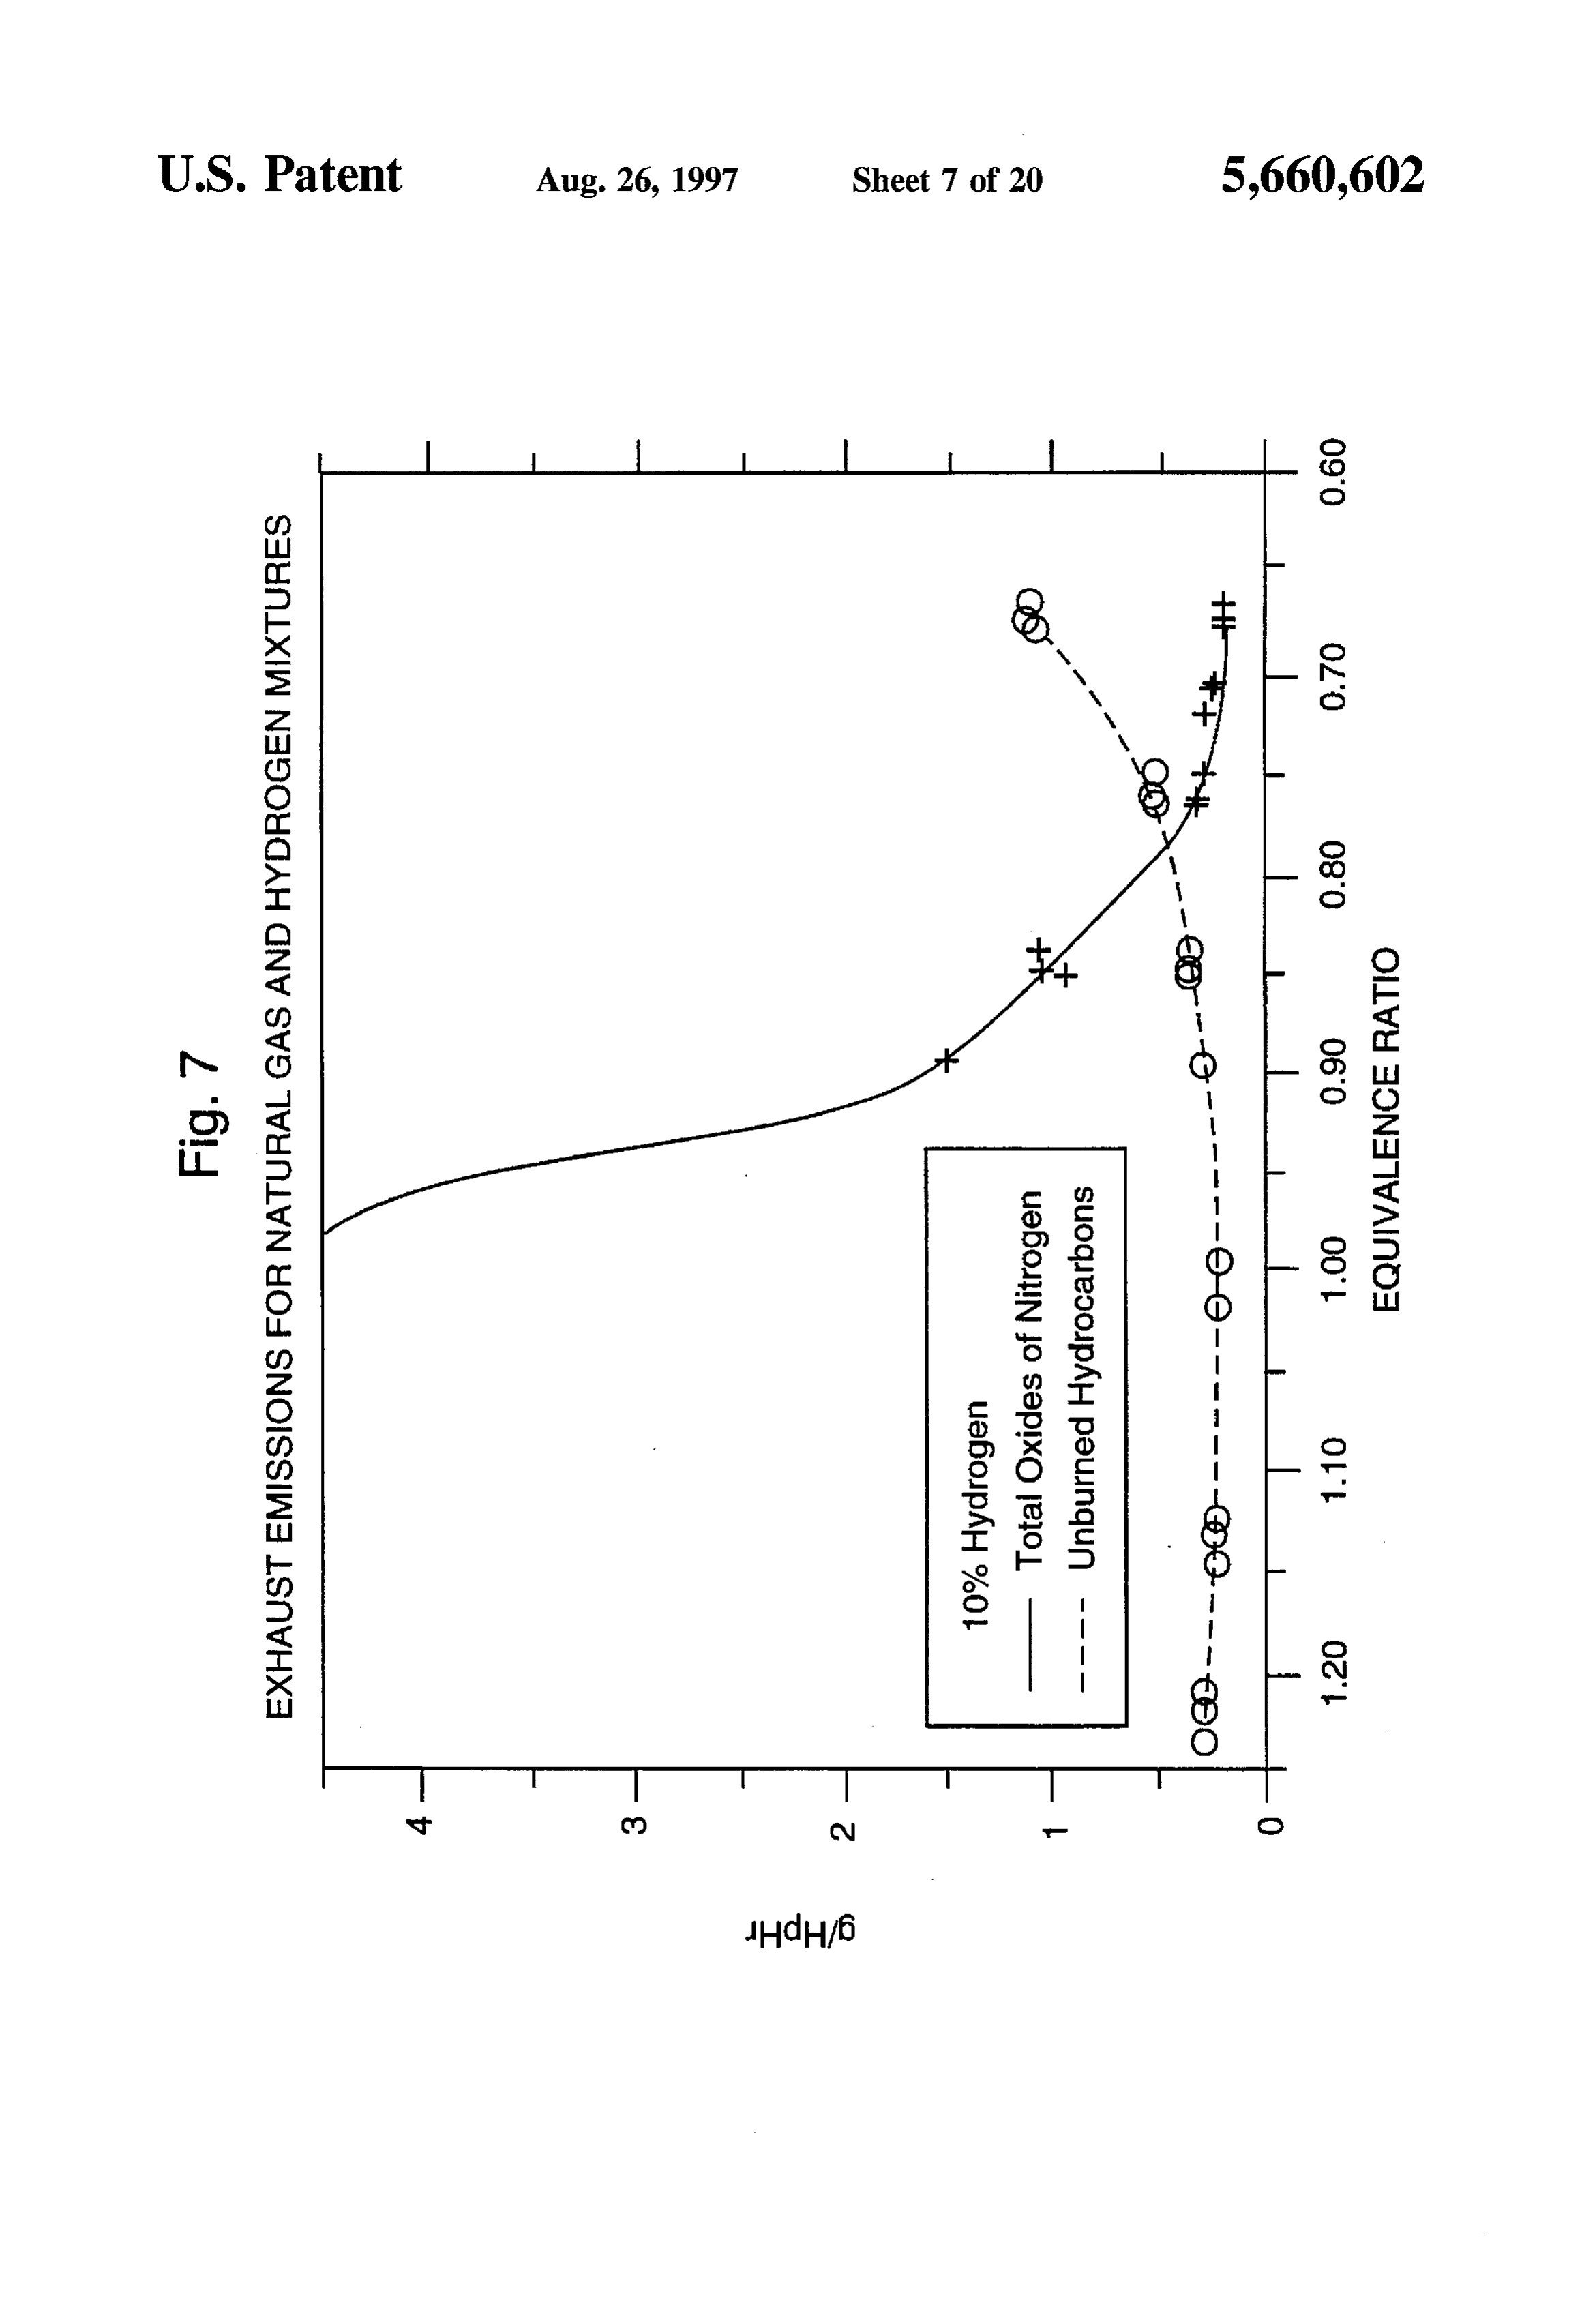
FIG. 1 shows a graph of exhaust emissions for natural gas lence ratio.
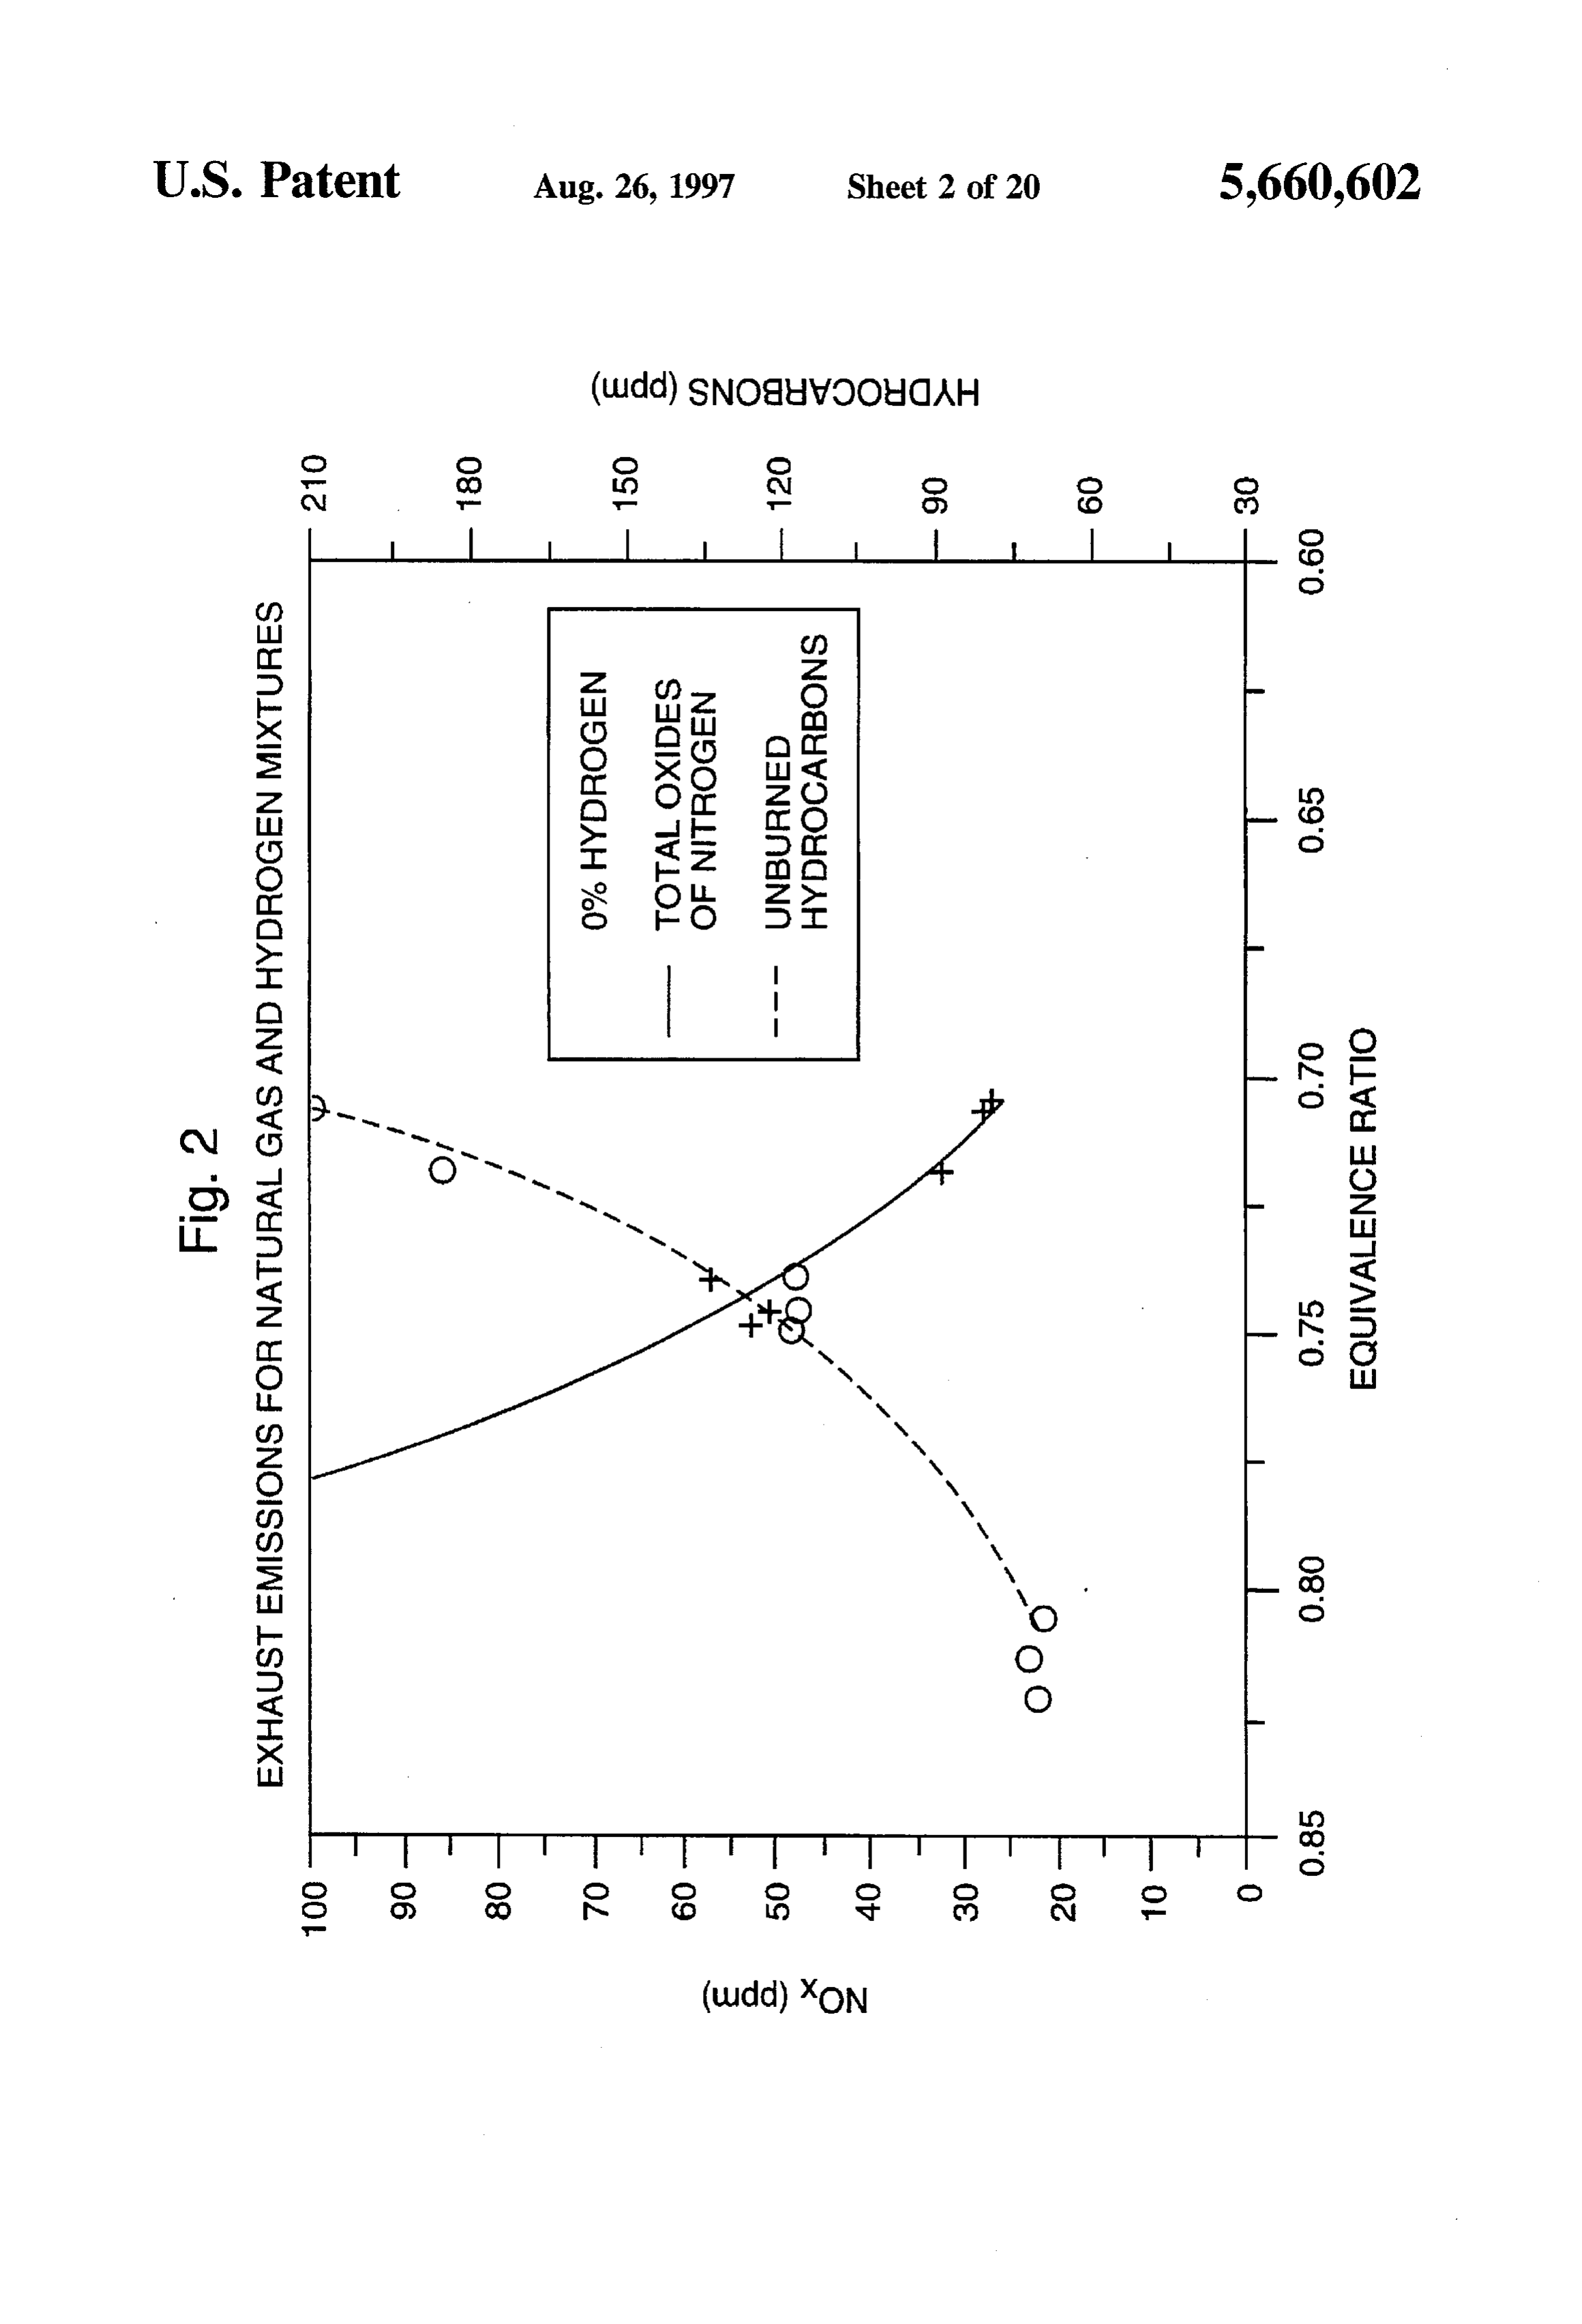
and 0% hydrogen mixtures in parts per million(PPM) vs. 35
Equivalence Ratio. DESCRIPTION OF THE PREFERRED FIG. 2 shows an enlarged sectional graph of FIG. 1 of EMBODIMENT exhaust emissions for natural gas and 0% hydrogen mixtures Before explaining the disclosed embodiment of the in parts per million(PPM) vs. Equivalence Ratio. 40 present invention in detail it is to be understood that the FIG.3 shows a graph of exhaust emissions for natural gas invention is not limited in its application to the details of the and 0% hydrogen mixtures in grams per horse power particular arrangement shown since the invention is capable hour(g/HipHr) vs. Equivalence ratio. of other embodiments. Also, the terminology used herein is FIG. 4 shows an enlarged sectional graph of FIG. 3 of for the purpose of description and not of limitation. exhaust emissions for natural gas and 0% hydrogen mixtures 45 Tests were conducted with mixtures of hydrogen and in grams per horse power hour(g/HipHr) vs. Equivalence natural gas. The fuels were mixed for the purpose of ratio. reducing emissions that are normally emitted by fossil fuels FIG. 5 shows a graph of exhaust emissions for natural gas and to extend the lean combustion limit of natural gas by and 11% hydrogen mixtures in parts per million(PPM) vs. introducing hydrogen.
Equivalence Ratio. The engine used for these tests was a V-8, Chevrolet 350 FIG. 6 shows an enlarged sectional graph of FIG. 5 of which was rebuilt with the following specifications: exhaust emissions for natural gas and 11% hydrogen mix Bore: 4.030" (0.030 over bore from standard) tures in parts per million(PPM) vs. Equivalence Ratio. Stroke: 3.480"
FIG. 7 shows a graph of exhaust emissions for natural gas Pistons:
Cam: Stock
Cast Aluminum, Flat top with 4 valve reliefs and 10% hydrogen mixtures in grams per horse power 55 Cylinder heads: 76 cc hour(g/HipHr) vs. Equivalence ratio.
Valves: Intake 1.94"Exhaust 1.50"
FIG. 8 shows an enlarged sectional graph of FIG. 7 of Compression Ratio: 9:1 exhaust emissions for natural gas and 10% hydrogen mix Intake tures in grams per horse power hour(g/HpHr) vs. Equiva 60 ExhaustManifold: Aluminum Throttle Body Manifold: 1 %" Steel pipe headers lence ratio.
Spark Plugs: Autolite: 303 Gap: 0.035"
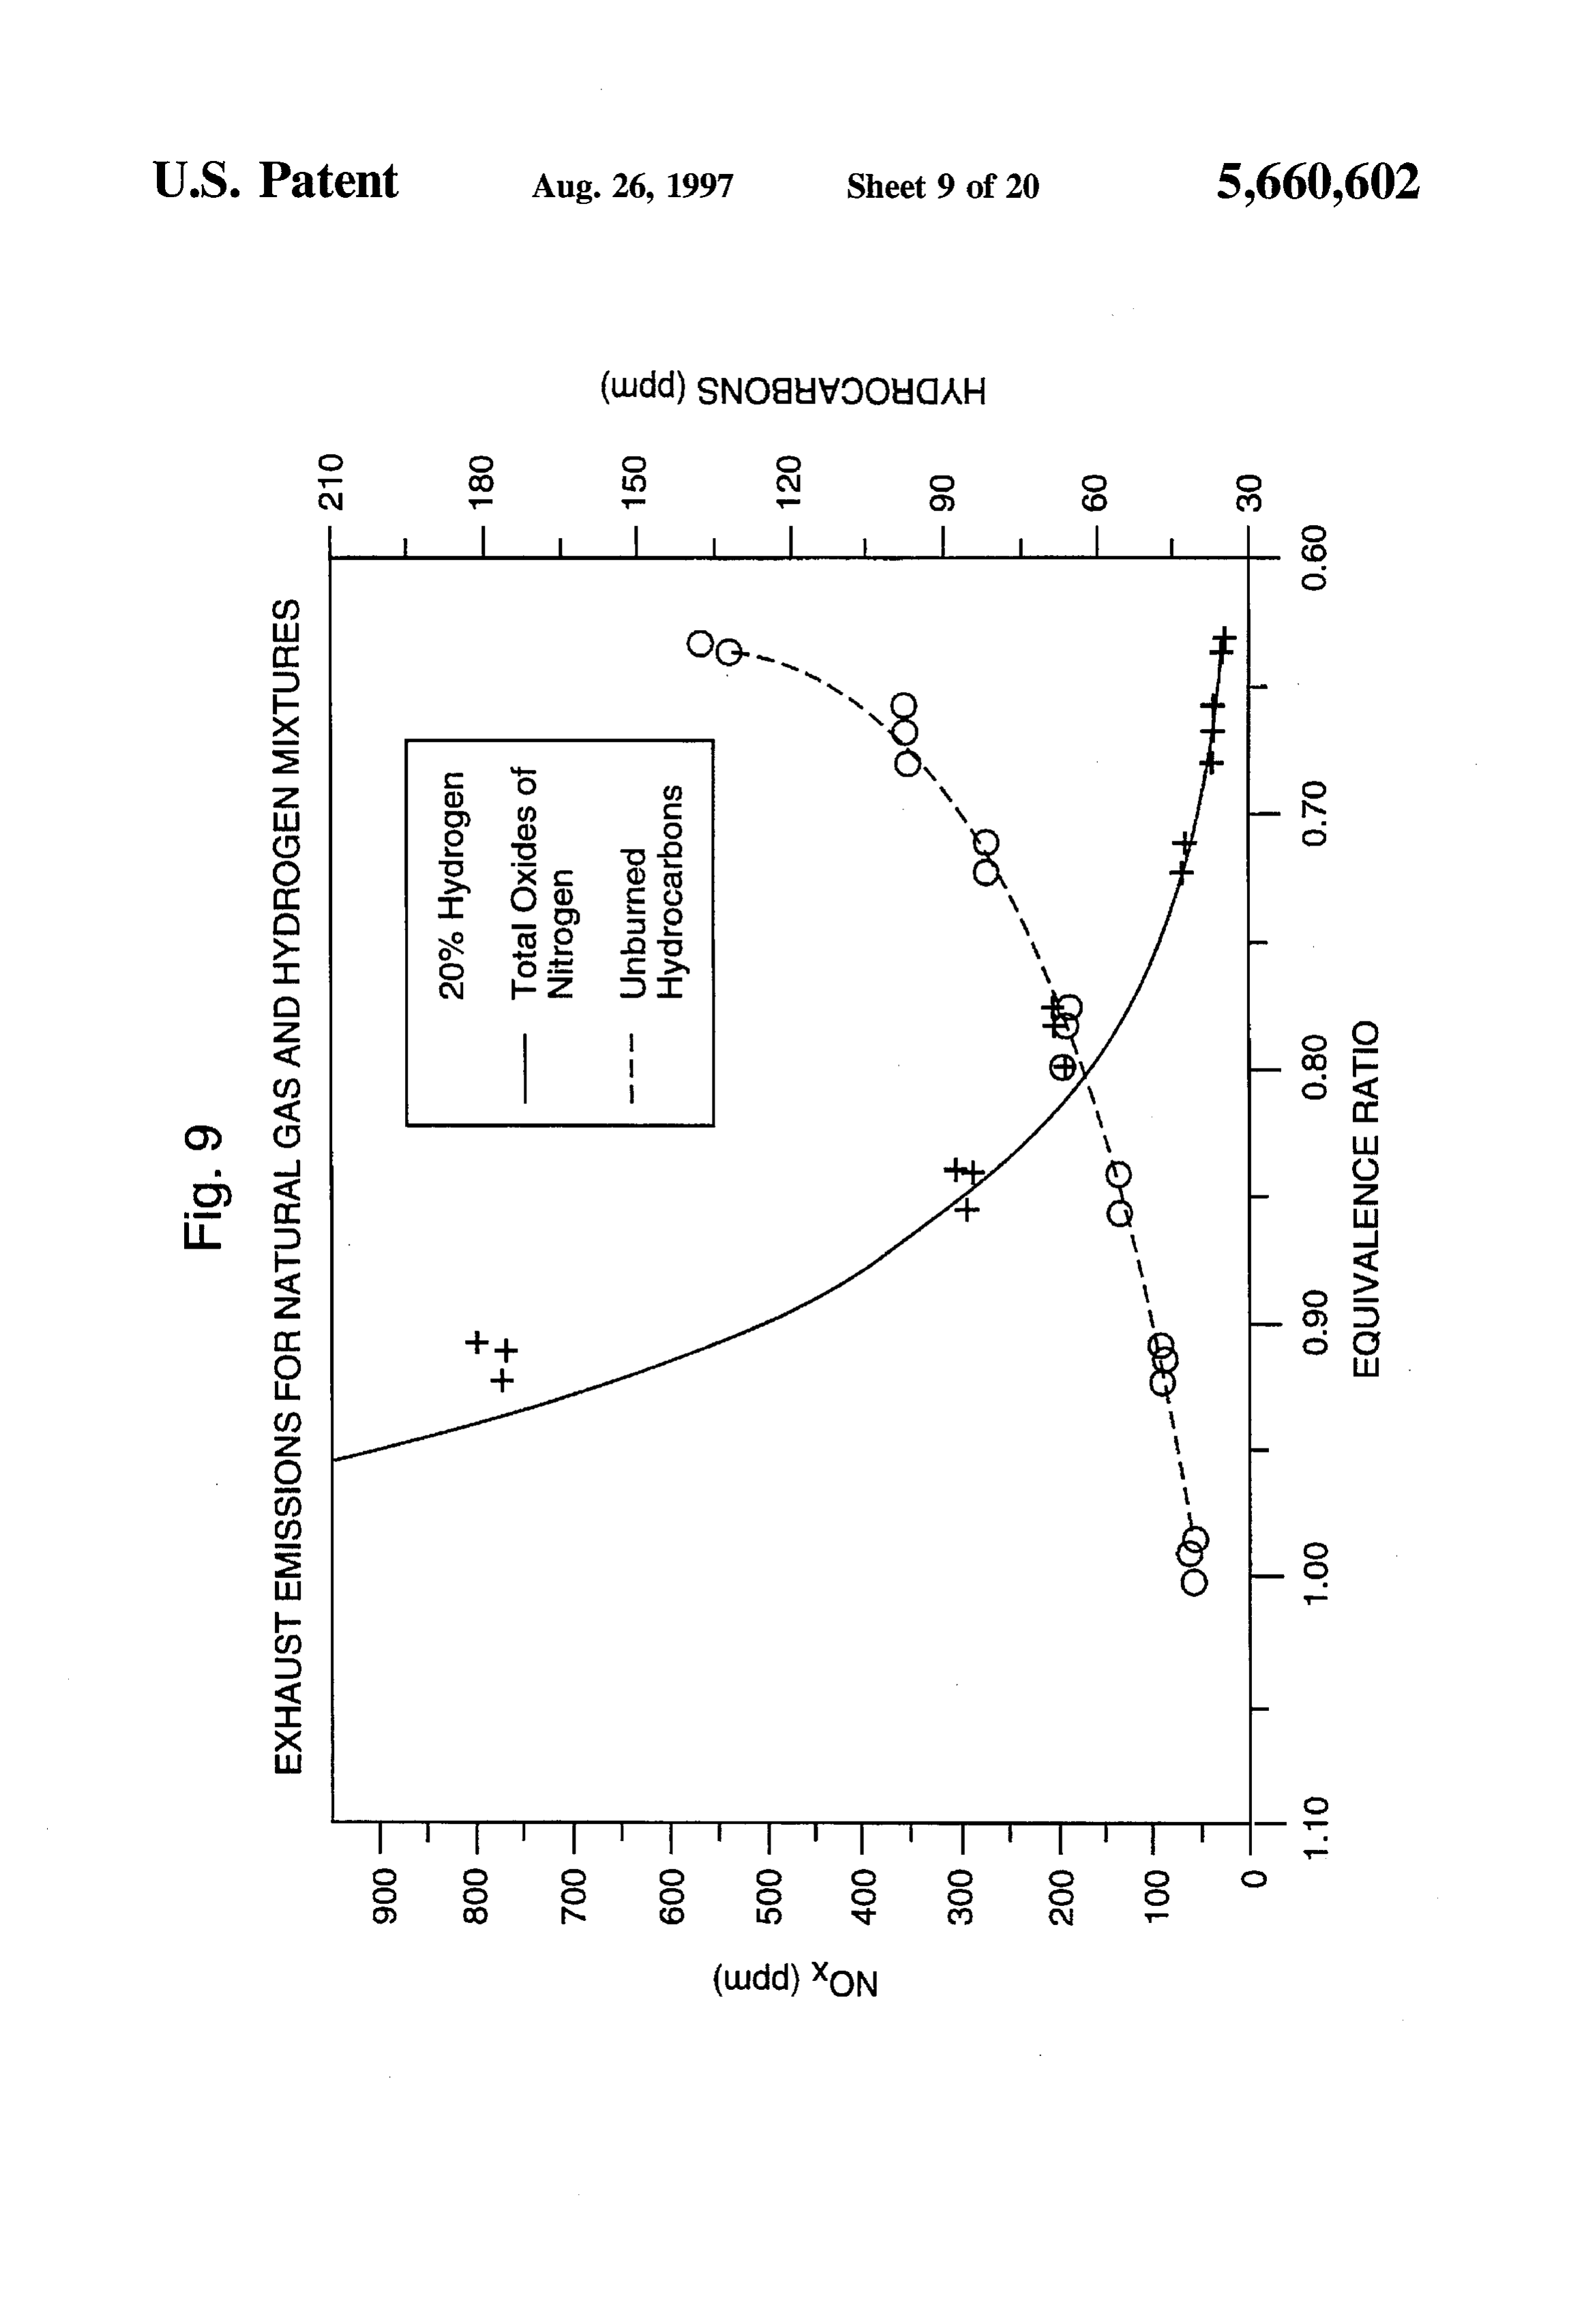
FIG. 9 shows a graph of exhaust emissions for natural gas Ignition: HEI with the vacuum spark advance removed and 20% hydrogen mixtures in parts per million(PPM) vs. Wires: Carbon Core
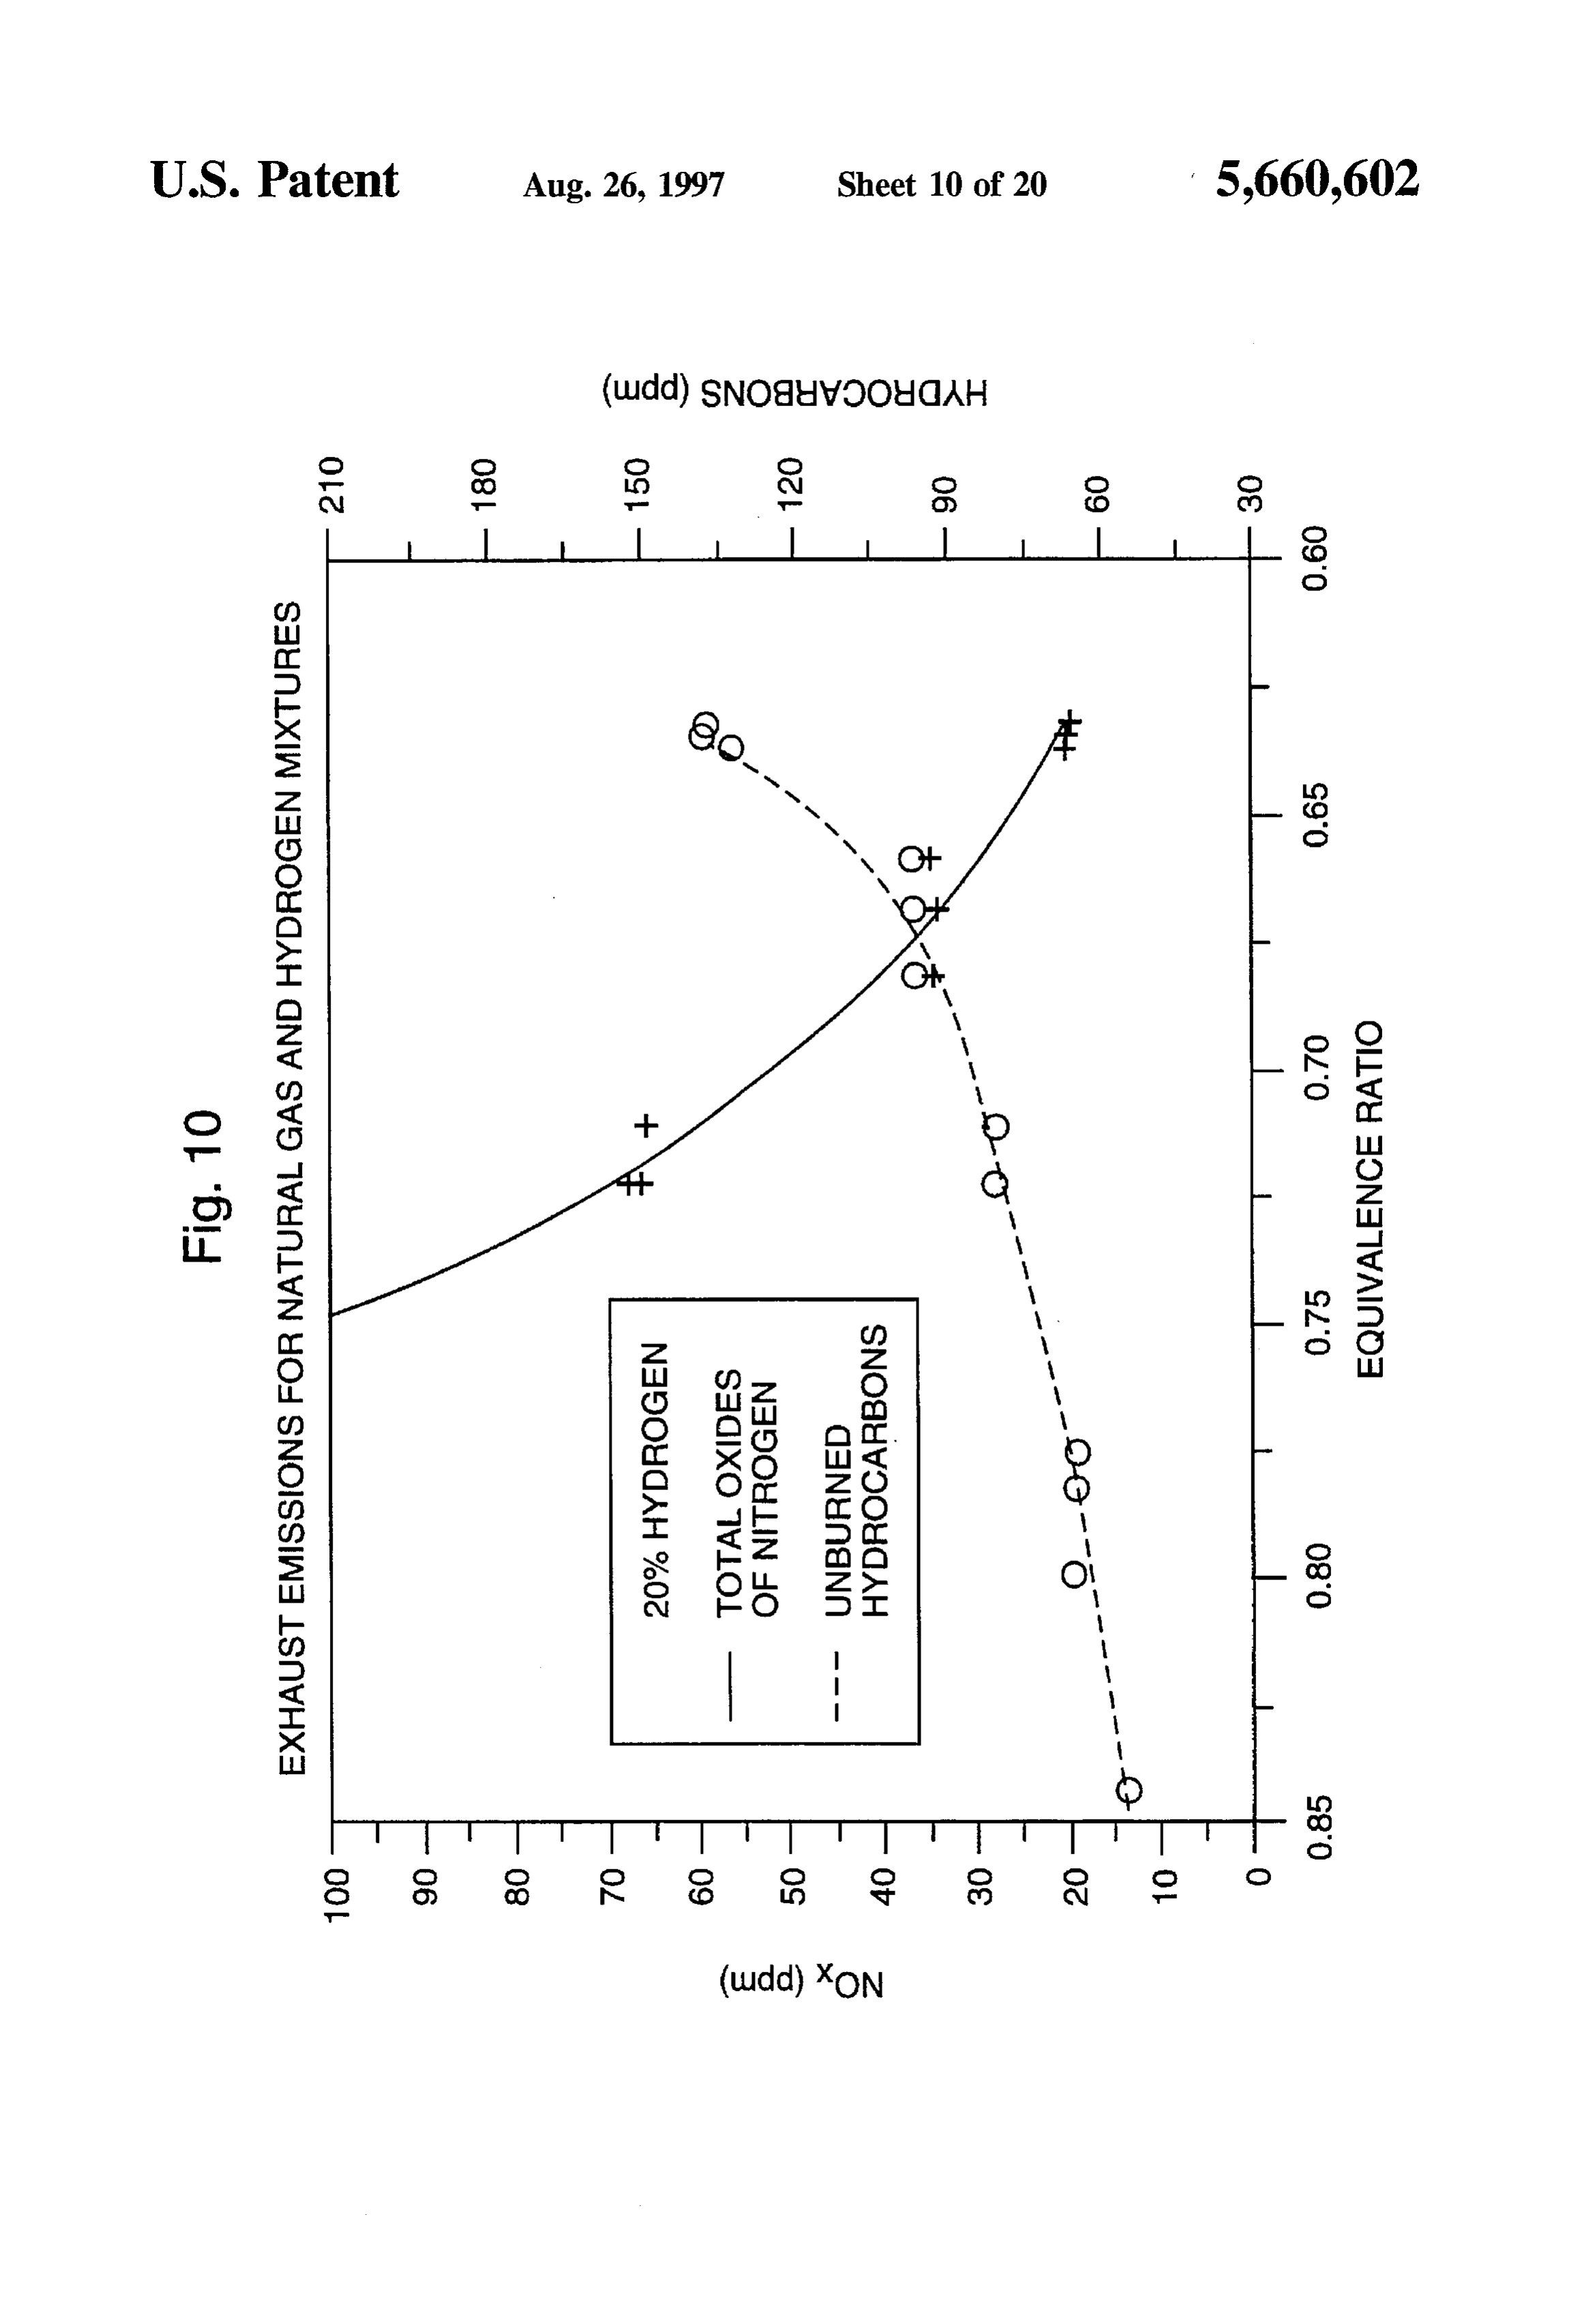
Equivalence Ratio. Carburetor: Throttle body with Impco Gaseous fuel meter FIG. 10 shows an enlarged sectional graph of FIG. 9 of 65 The dynamometer used in the tests was a Computer exhaust emissions for natural gas and 20% hydrogen mix Controlled Super Flow 901 with a maximum torque speci tures in pans per million(PPM) vs. Equivalence Ratio. fication of 1000 lb ft. The dynamometer was calibrated prior
Page 24
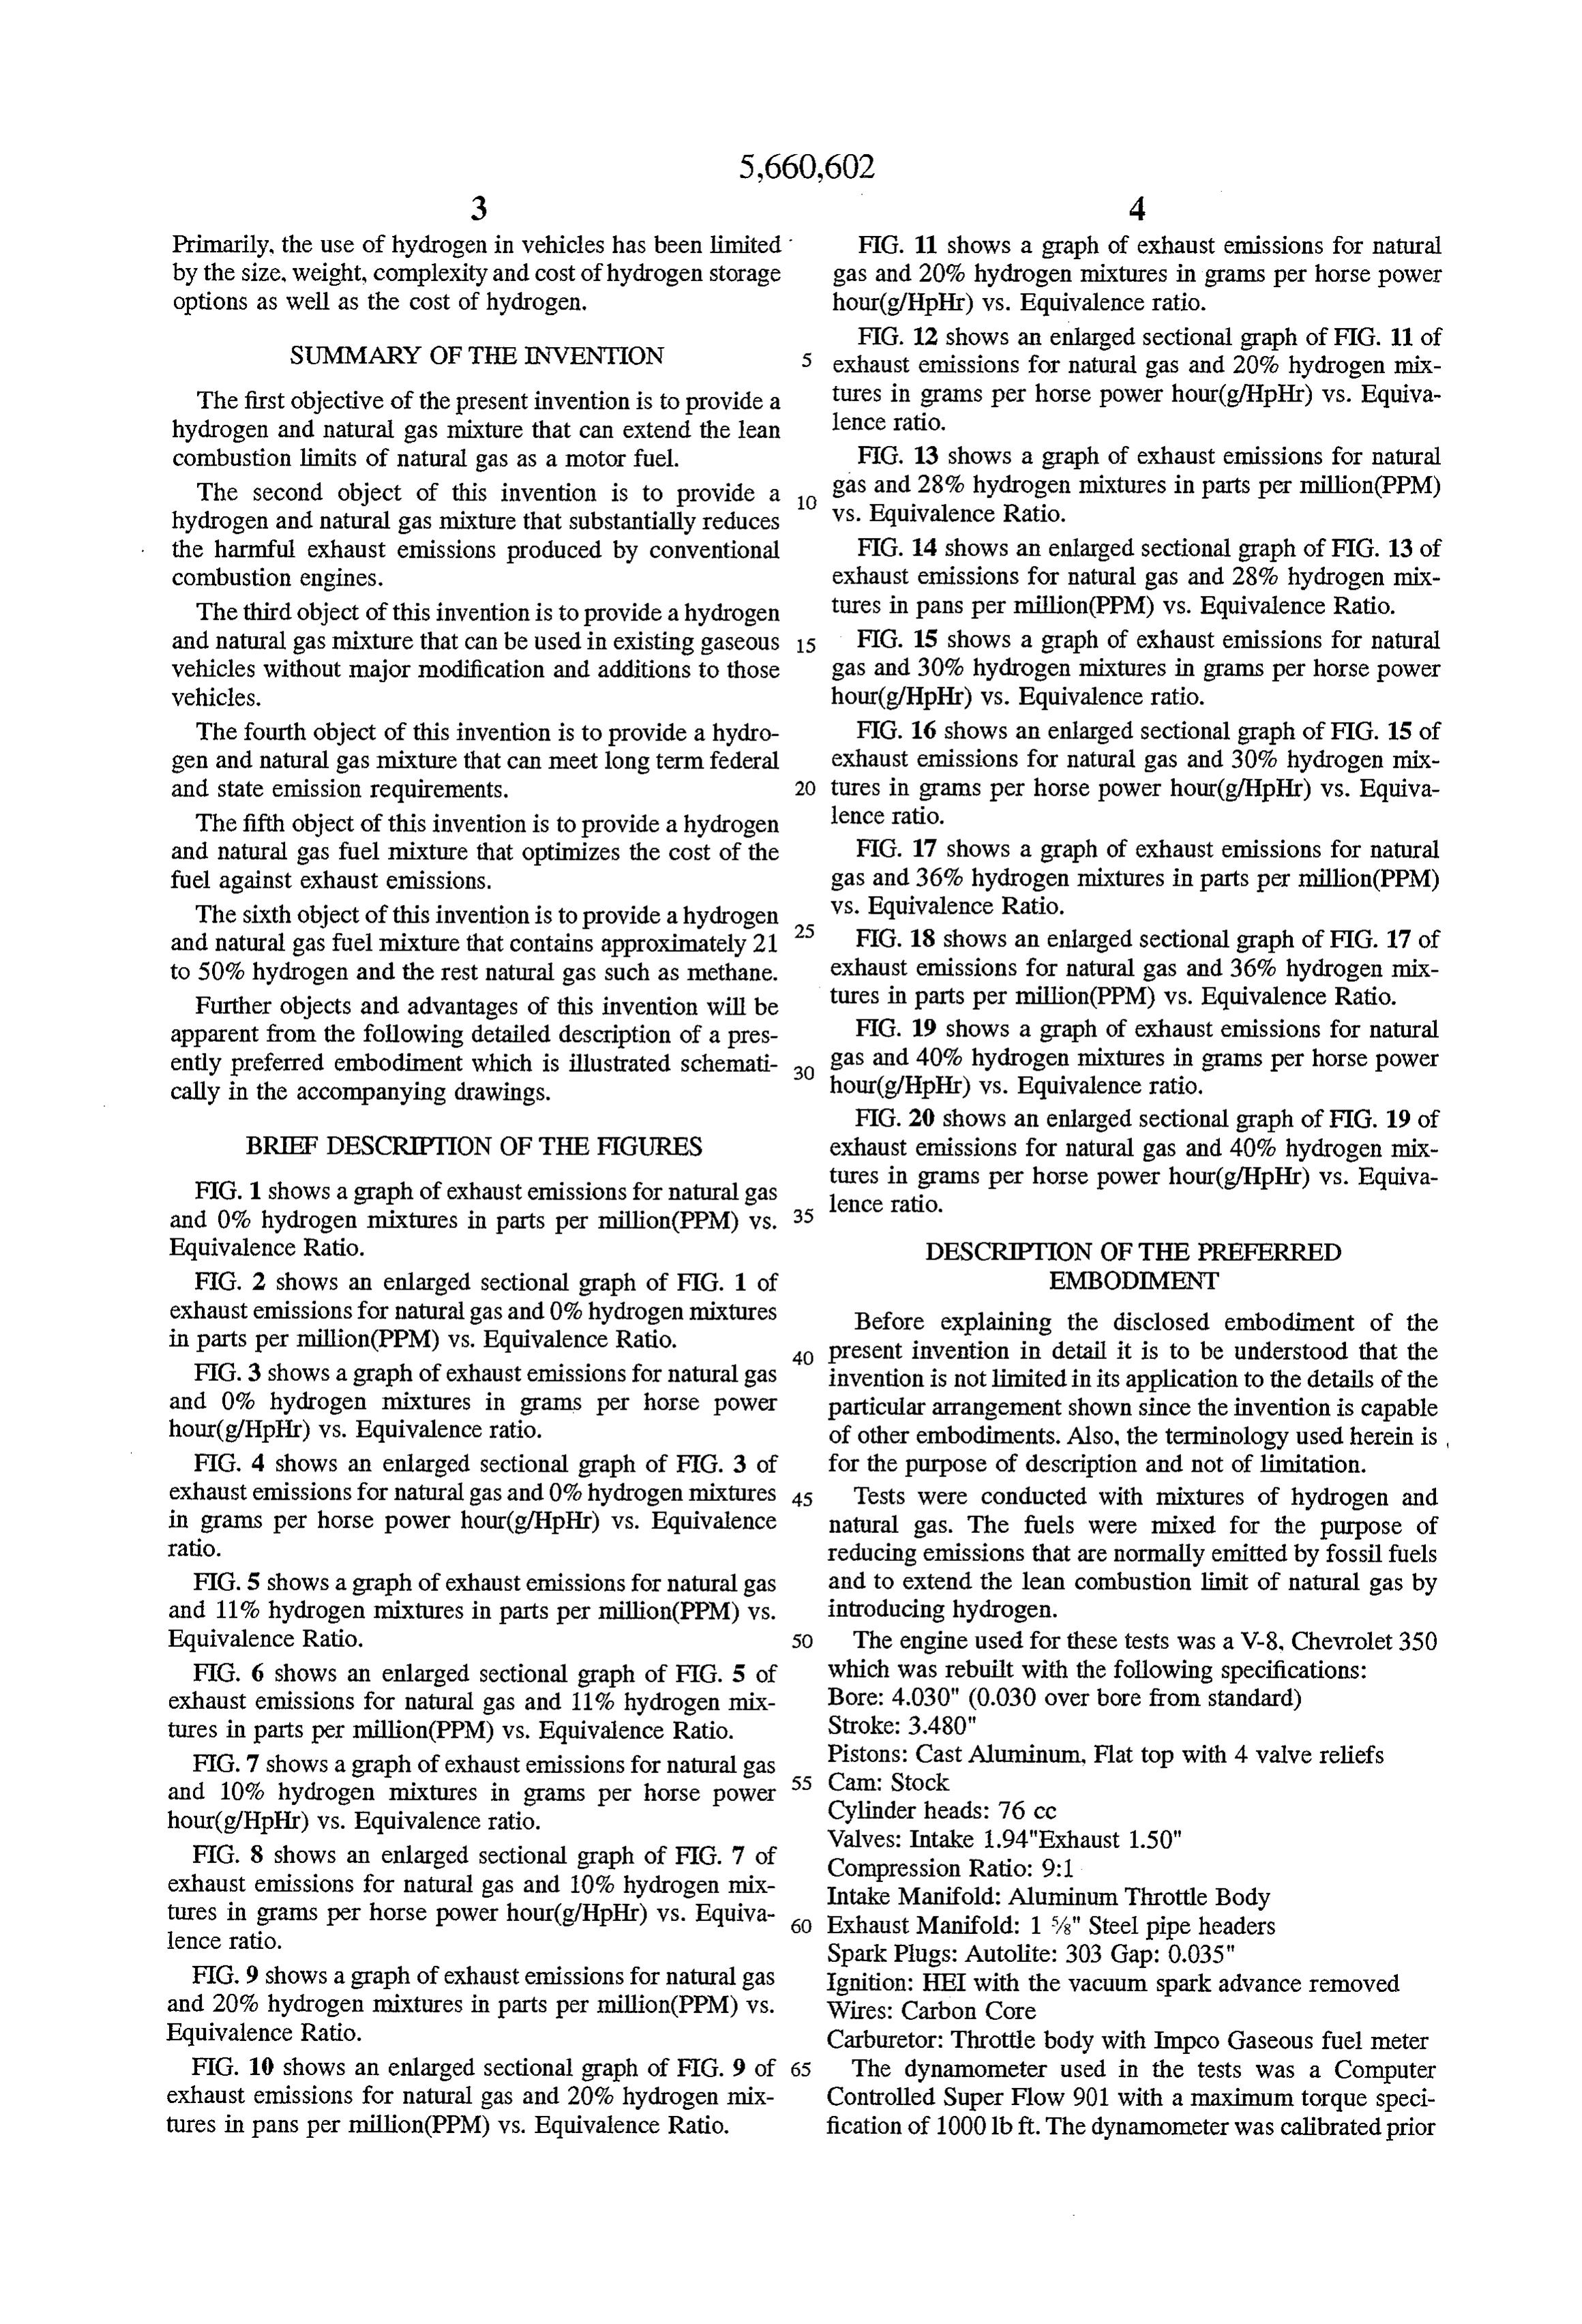
to the beginning of testing. In addition, the dynamometer cylinder was monitored using a K type thermocouple was checked for calibration drift due to the heating of the mounted in an aluminum plate which was bolted between strain gage and was re-Zeroed between each pull. the head and the exhaust header. The thermocouples were For the emissions monitoring a NOVA Model Number 7550/B was used to measure CO, CO. O., NO, NO, NO. mounted to take the exhaust temperature reading in the The instrument was modified by FSEC to output the results center of the exhaust stream. to an Analog to Digital Board mounted in an IBM- the mi d hydr compatible 286 computer. The NOVA was calibrated using certified span gases. The NOVA was zeroed using room air
SE y t rtF. CNG an s Efira, into MicroMotion Mass row Sensor. Model C.
and was spanned using 35 ppm certified NO span gas, 1402 The MicroMotion Sensor operates using the coriolis effect, ppm N-Hexane (Hydrocarbon), 8.993% Carbon Monoxide 10 which negates the need for turbines and bearings thus and 17490% Carbon Dioxide. The hydrocarbons measured Substantially increasing the accuracy and repeatability of the is ofStigtheWe, makeup total. It isSPECini, a gas flow measurements. The sensor was calibrated by Micro generally known that approxi mately 80 to 90% of the total hydrocarbons are made up of Motion and has a certified accuracy of 0.44% at a flow rate methane hydrocarbons. The methane hydrocarbons are non of 25 lbs per hour.
photo-reactive and are generally not considered to be a Each of the test runs were conducted at 17 horsepower significant pollutant. d 1700 rpm. The testi ducted at this level t The NO span gas bottle contained a liner to prevent any an pm. ne testing was conducted at this level to reaction between the gas and the bottle. The instrument was simulate a light-duty trucktraveling along a level paved road checked for Zero drift before and after each test. In addition, at 55 mph. Each of the five tests included a varying mixture E.ataspan s c E. Life test E. 20 level volumes was only accepted when both Zero and span repeate - of hydrogen with natural gas. The results of within the limits of the instrumentation. tests 1-5 are listed in tables 1-5 respectively. The emissions pickup tube was mounted in the collector pipe 14 inches from the primary pipes. Only stainless steel and Teflon tubing was used for exhaust gas delivery.
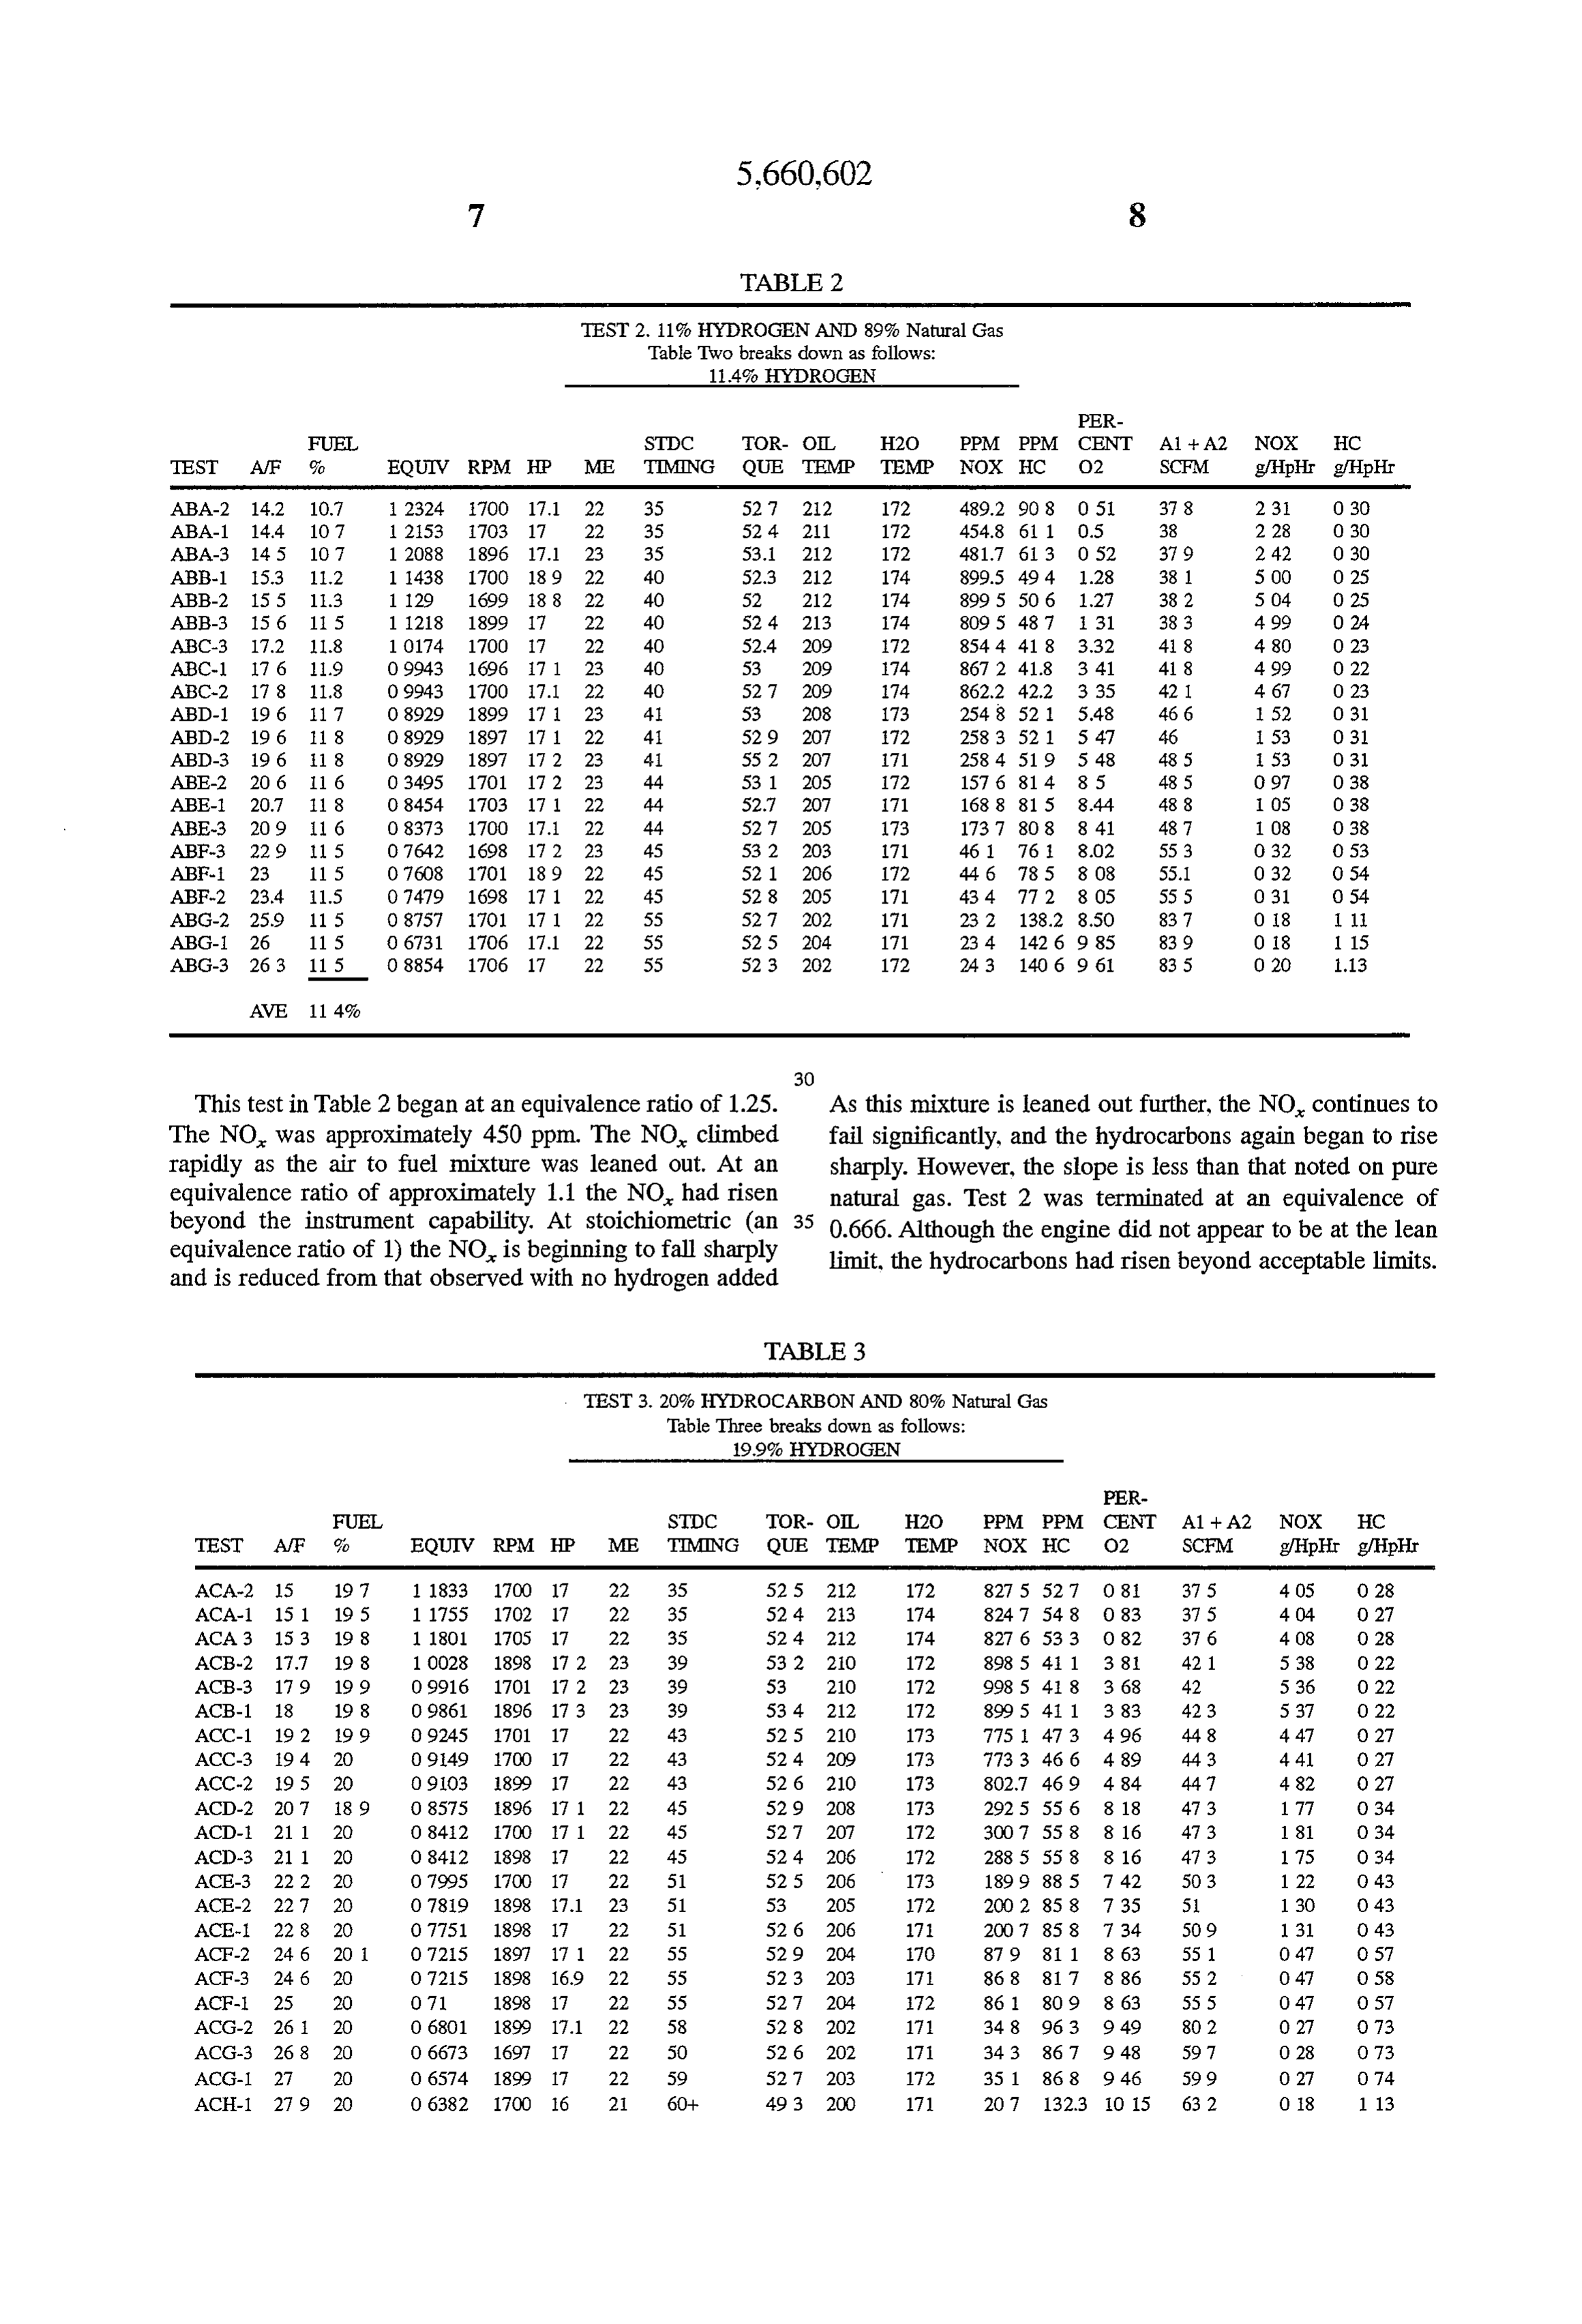
TABLE 1.
TEST 1.0% HYDROGEN and 100% Natural Gas
Table One breaks down as follows
0% HYDROGEN
PER
FUEL CHG STDC TOR- OIL H2O PPM PPM CENT A1+A2 NOX HC TEST A/F 9% EQUIV RPM HP ME TIMING QUE TEMP TEMP NOX HC O2 SCFM g/HipHr g/HipHr AAA-2 165 0 10424 1697 17 22 50 527 201 172 899 482 288 416 540 0 27 AAA-1 166 0 10361. 1695 17.1 23 50 53 1 202 172 899 488 288 42 541 O 26 AAA-3 16.8 0 10238 1696 168 22 50 529 203 173 899 489 293 416 548 O 27 AAB-2 17 0 1 0118 1696 17 22 49 525 206 172 899 47 6. 337 426 552 0.26 AAB-3 172 0 1. 1894 17 22 49 525 206 171 899 468 338 424 5.49 O 26 AAB- 173 0. 09942 1894. 17 22 49 527 206 73 899 467 338 425 550 0 26 AAC-2 187 0 O 9198 1700 168 22 51 521, 206 172 592 5 562 5 2. 461 3.54 O 34 AAC-3 88 0 0.9149 1899 17 22 51 525 205 173 903 8 567 519 463 380 O34 AAC-1 19 0 09005 700 17 22 51 52 5 204 173 8089 55.2 517 462 382 O 33 AAD-1 208 0 O 823 1697 18.8 22 5i 52 204 172 823 895 664 505 120 O 48 AAD-3 21 1 0 O 6152 1694 17 2 23 5. 534 202 71 1582 712 6.79 515 110 O 46 AAD-2 213 0 08075 1694, 17 2 23 51 531, 203 172 1835 684 664 519 12 045 AAE-2 229 0 O 7511 1699 17 22 58 529 202 171 526 1166 835 588 0.39 O 87 AAE-3 23 0 0 7478 1700 17 3 23 58 535 202 172 507 115.5 834 582 038 O 86 AAE-1 23 2 0 07434 1692 188 22 56 523 203 171 569 1158 832 59 0.43 O 88 AAF-1 239 0 0 71.97 1699 155 20 58 479 199 172 321 1844 821 826 0 28 181 AAF-2 243 0 0 7078 1704. 16 21 58 495 200 171 27 6. 2091. 834 834 O 24 178 AAF-3 244 o O 7049 1704 157 21 56 485 199 171 264. 2113 833 83 2 0 23 184 AWE 0%
The following engine and atmospheric condition and In Table 1, at an equivalence ratio of 1 on the stoichio monitoring equipment was utilized during testing and col 55 metric scale, the NO was beyond the scale of the NOVA lected by the dynamometer: Oil Pressure, Exhaust Gas instrument. At an equivalence ratio of 0.8333 the NO has Temperature, Water Temperature, RPM, Torque, Barometric fallen sharply, however, the hydrocarbons were beginning to Pressure, Humidity, Carburetor Air Temp. Air, and Oil rise sharply. This was an indication that the engine is at or Temperature. The mass air flow was measured using a 6" near the lean limit of combustion. Although a continuous calibrated turbine which was attached to the carburetor using reduction in the equivalence ratio yielded a sharp reduction a 6" sheet metal elbow. The exhaust gas temperature of each in NO the engine misfired.
Page 25
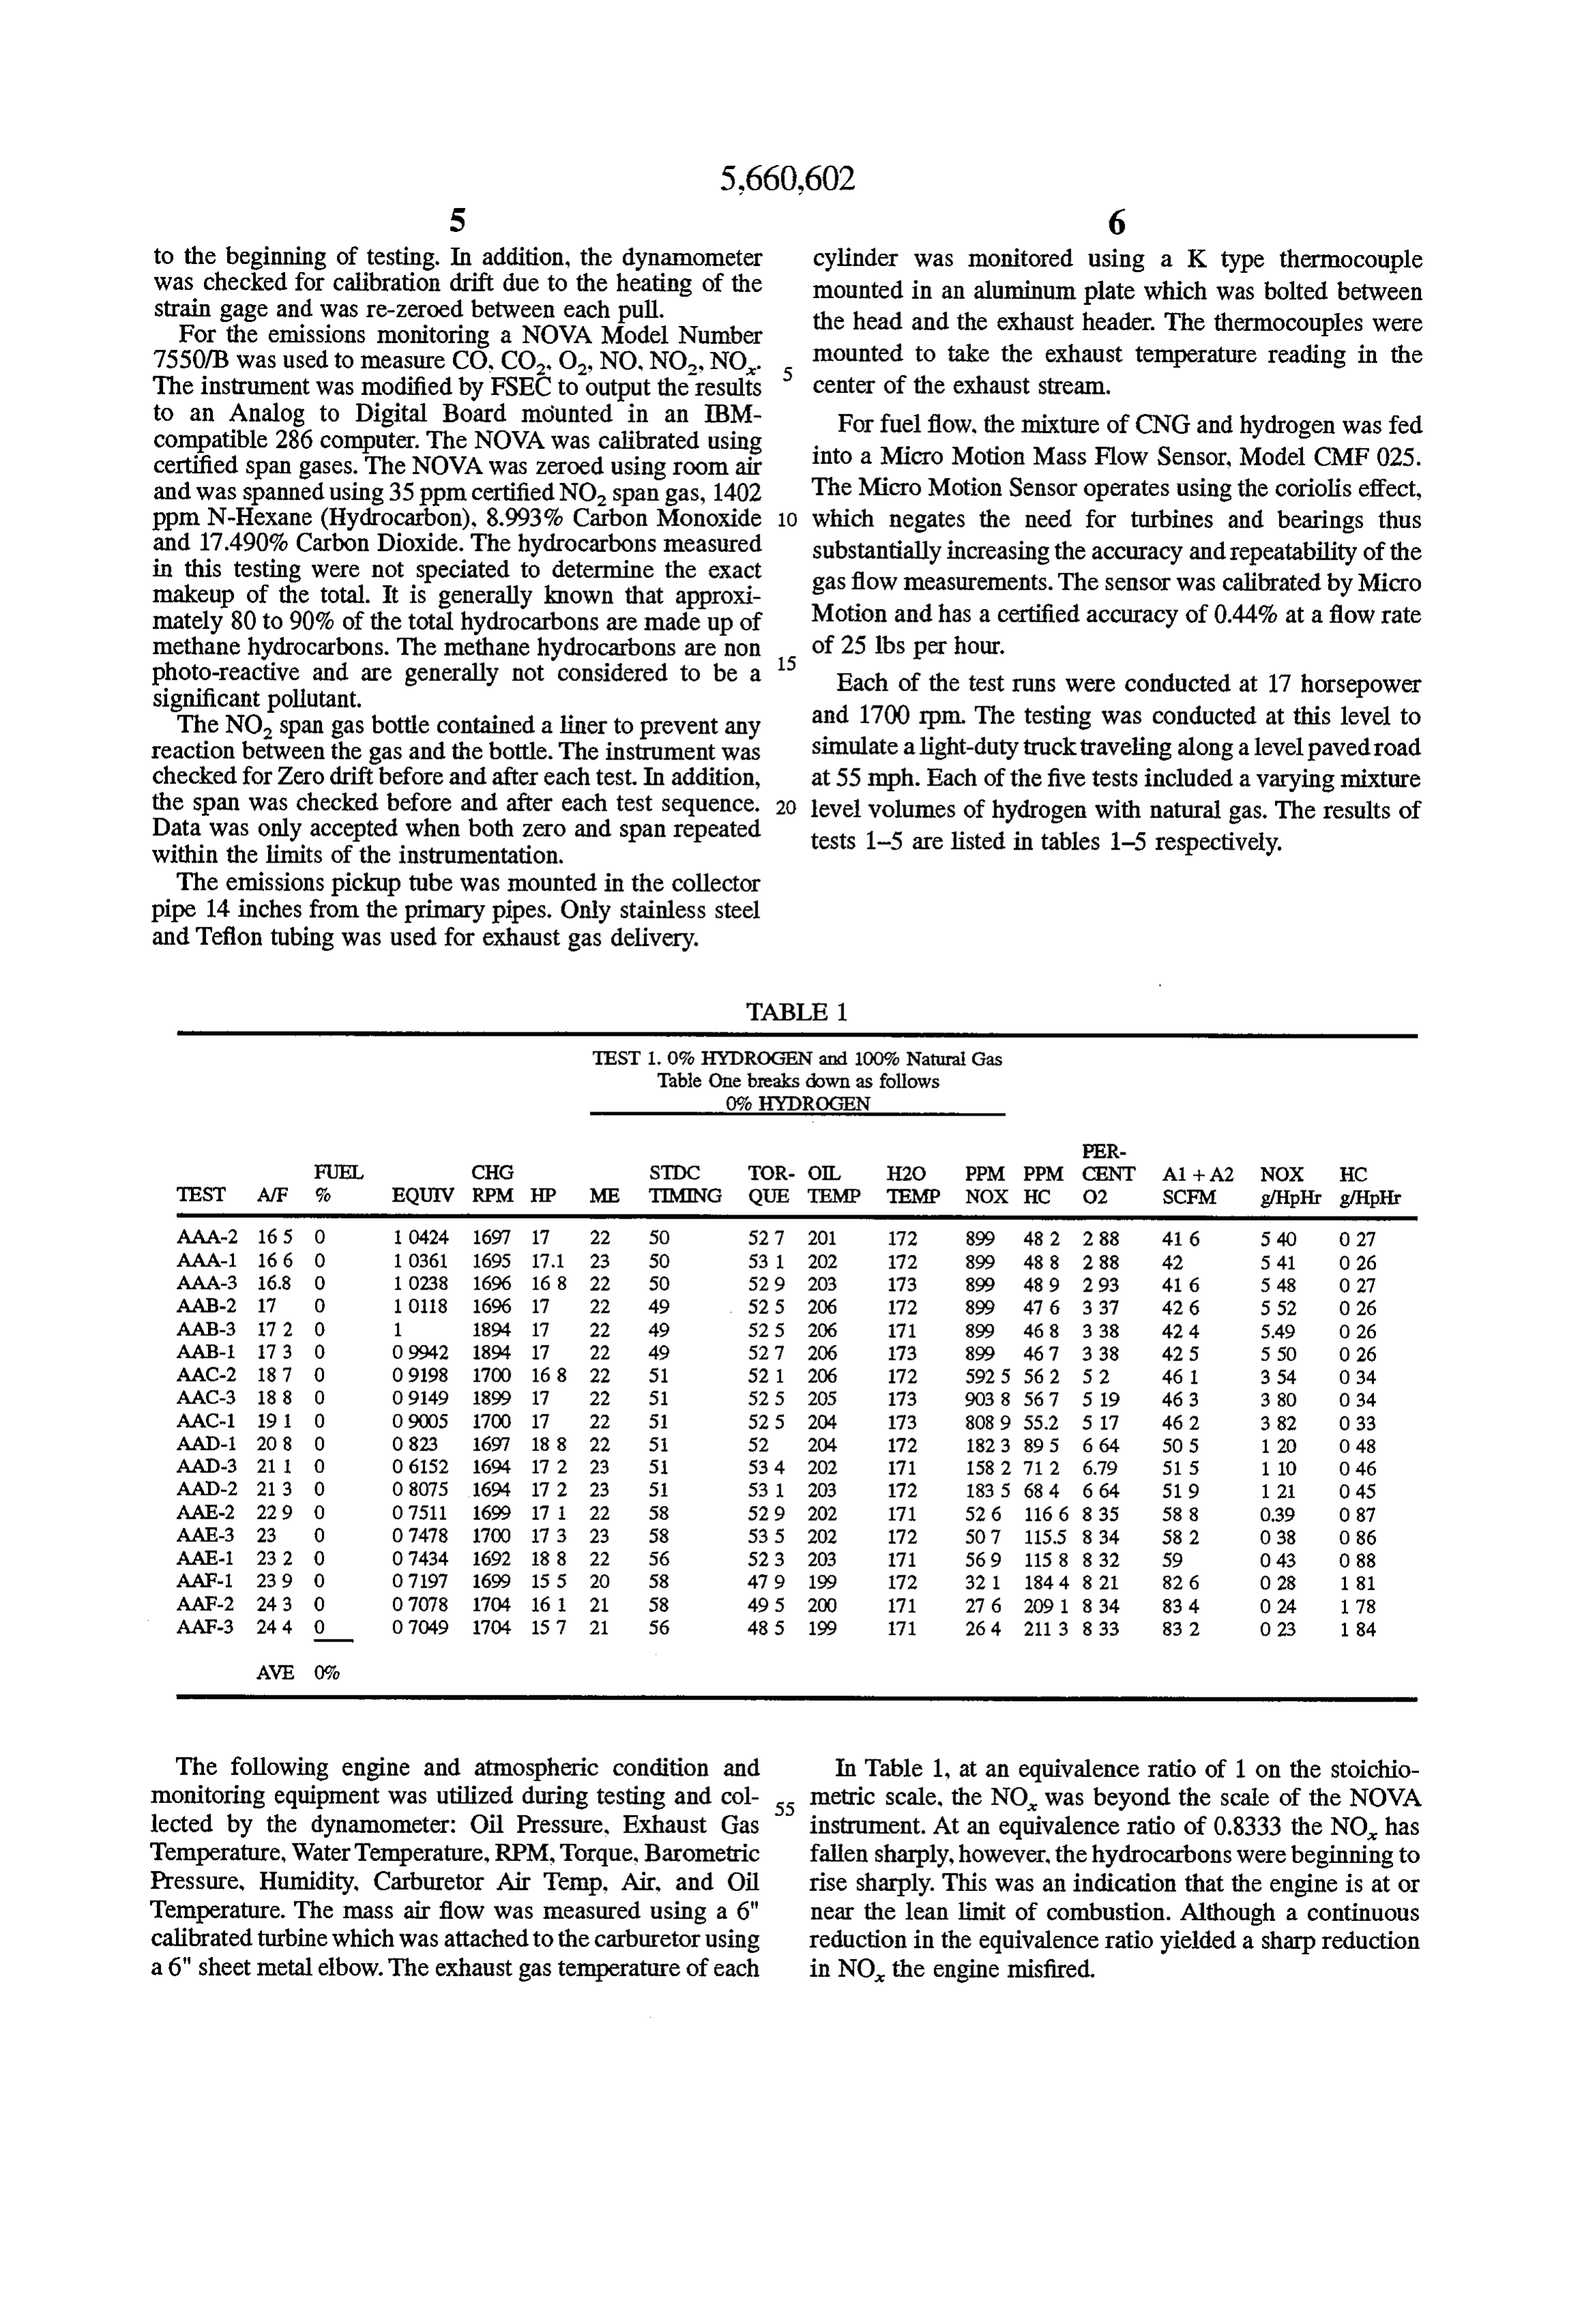
TABLE 2
TEST 2.1% HYDROGENAND 89% Natural Gas
Table Two breaks down as follows:
11.4% HYDROGEN
PER
FUEL STDC TOR- OEL H2O PPM PPM CENT A1+A2 NOX HC TEST AIF 9 EQUIV RPM HP ME TIMING QUE TEMP TEMP NOX HC O2 SCFM g/HipHr g/HipHr ABA-2 14.2 10.7 2324 IOO 17.1 22 35 527 22 172 489.2 908 O 51 378 2 31 O 3O ABA-1. 14.4 107 12153 1703 17 22 35 52 4 211 172 A548 61 1 0.5 38 228 030 ABA-3 4 5 107 12088, 1896 17.1 23 35 53.1 212 172 481.7 613 052 379 242 O30 ABB-1 5.3 11.2 11438 1700 189 22 40 52.3 2.12 174, 899.5 49 4 1.28 381 500 025 ABB-2 155 11.3 1129 1699 188 22 40 52 2.12 174 899 5 506 127 382 504 025 ABB-3 15 6 115 11218 1899 17 22 40 524, 213 174 8095 487 31 383 499 024 ABC-3 17.2 118 1 O174 1700 17 22 40 52.4 209 72 854 4 418 3.32 418 4 80 O 23 ABC-1 17 6 19 O9943 1696 7. 1 23 40 53 209 74 867 2 418 3 41 418 499 0 22 ABC-2 17 8 11.8 O9943 1700 7.1 22 40 527 209 74 862.2 42.2 335 421 4 67 O 23 ABD-1 19 6 17 O 8929 1899 it 23 4. 53 208 173 254 8 521 5.48 466 52 O 31 ABD-2 19 6 18 O 8929 1897 171 22 41 529 207 12 2583 521 547. 46 53 O 31 ABD-3 19 6 18 O 8929 1897 112 23 4. 552 207 171 258.4 519 548 485 53 O 31 ABE-2 20 6 16 O 3495 1701 17 2 23 44 53 1 205 172 1576 814 85 485 O 97 O38 ABE-1. 20.7 118 O 8454. 1703 17 1 22 A4 52.7 207 71 1688 815 8.44 488 105 038 ABE-3 209 16 O 8373 1700 17.1 22 44 527 205 173 1737 808 841. 487 08 038 ABF.3 229 15 O 76.42 1698 172 23 45 532 203 171 461 76 8.02 553 O 32 0.53 ABF- 23 115 01608 1701 189 22 45 521, 206 112 446 T85 808 55.1 O 32 O54 ABF.2 23.4 11.5 O 1479 1698 17. 1 22 45 528 205 171. 434 77 2 8 05 555 O 31 O54 ABG-2 25.9 115 O 8751 TO1 17 1, 22. 55 527 202 111 23 2 138.2 8.50 837 08 11. ABG- 26 115 06731. 1706 17.1 22 55 525 204 171 23 4. 1426 985 83.9 O 18 115 ABG-3 263 115 O 8854. 1706 17 22 55 523 202 172 243 1406 9 61 835 O 20 1.13
This test in Table 2 began at an equivalence ratio of 1.25. As this mixture is leaned out further, the NO continues to The NO was approximately 450 ppm. The NO climbed fail significantly, and the hydrocarbons again began to rise rapidly as the air to fuel mixture was leaned out. At an sharply. However, the slope is less than that noted on pure equivalence ratio of approximately 1.1 the NO had risen natural gas. Test 2 was terminated at an equivalence of beyond the instrument capability. At Stoichiometric (an 35 0.666.
equivalence ratio of 1) the NO is beginning to fall sharply
Although thebons limit, the h engine did not appear had risen b d to betable at thelimit lean and is reduced from that observed with no hydrogen added . . the hydrocarbons had risen beyond acceptable S.
TABLE 3
TEST 3.20% HYDROCARBONAND 80% Natural Gas
Table Three breaks down as follows:
19.9% HYDROGEN
PER
FUEL STDC TOR OL H2O PPM PPM CENT A1+A2 NOX HC TEST A/F 2, EQUIV RPM HP ME TIMING QUE TEMP TEMP NOX HC O2 SCFM g/HipHr g/HipHr ACA-2 15 19 7 1 1833 17OO 17 22 35 52 5 212 172 827 5527 O8. 375 405 O 28 ACA-1 15 1 195 11755 1702 17 22 35 524, 213 174 824 7 548 083 375 404 O 27 ACA3 153 198 1 1801 1705 17 22 35 524, 212 174 827 6 533 082 37 6 408 O 28 ACB-2 17.7 198 1 OO28 1898 172 23 39 53 2 20 172 8985 4 1 38 421 538 O 22 ACB-3 179 199 O9916 1701 17 2 23 39 53 210 172 998.5 48 3 68 42 536 O 22 ACB-1 18 198 O 9861 1896 17 3 23 39 S3 4 212 172 8995 4 1 383 423 537 O 22 ACC-1 192 199 O 9245 1701 17 22 43 52 5 210 173 775 473 496 448 447 O 27 ACC-3 94 20 O 949 1700 17 22 43 524 209 173 1733 466 489 44 3 4 41 O 27 ACC.2 9 5 20 O 903 1899 17 22 43 52 6 210 173 802.7 469 484 447 482 O 27 ACD-2 207 189 O8575 896 17 1 22 45 529 208 173 2925 556 818 47 3 177 O 34 ACD- 21 1 20 O 842 TOO 7 1 22 45 527 207 172 300 7 558 8 16 47 3 181 O 34 ACD-3 21 1 20 O 84.2 1898 17 22 45 524 206 172 2885 558 8 16 473 175 O34. ACE-3 222 20 O 7995 1700 17 22 51 52 5 206 173 1899 885 742 503 1 22 O 43 ACE-2 227 20 O7819 1898 17.1 23 51 53 205 172 2002. 858 7 35 51 130 O 43 ACE- 228 20 O 7751. 1898 17 22 51 52 6 206 171 2007 858 734 509 131 O 43 ACF-2 24 6 20 0 725 1891. 1T 1, 22 55 529 204 TO 879 811 863 551 O 41 O 57 ACF-3 24 6 20 O7215 1898 16.9 22 55 523 203 171 868 817 886 552 O41 O58 ACF- 25 20 O 71 1898 17. 22 55 527 204 72 86 809 863 555 O47 O57 ACG-2 26 20 O 6801 1899 17.1 22 58 528 202 171 348 963 949 802 O 27 O 73 ACG-3 268 20 O 6673 1697 17 22 50 52 6 202 171 343 867 948 597 O 28 O 73 ACG-1 27 2O O 6574 1899 17 22 59 527 203 172 351 868 946 599 O 27 O 74 ACH-1 279 20 O 6382 17OO 6 21 60+ 493 200 171 207 132.3 0 15 632 O 8 113
Page 26
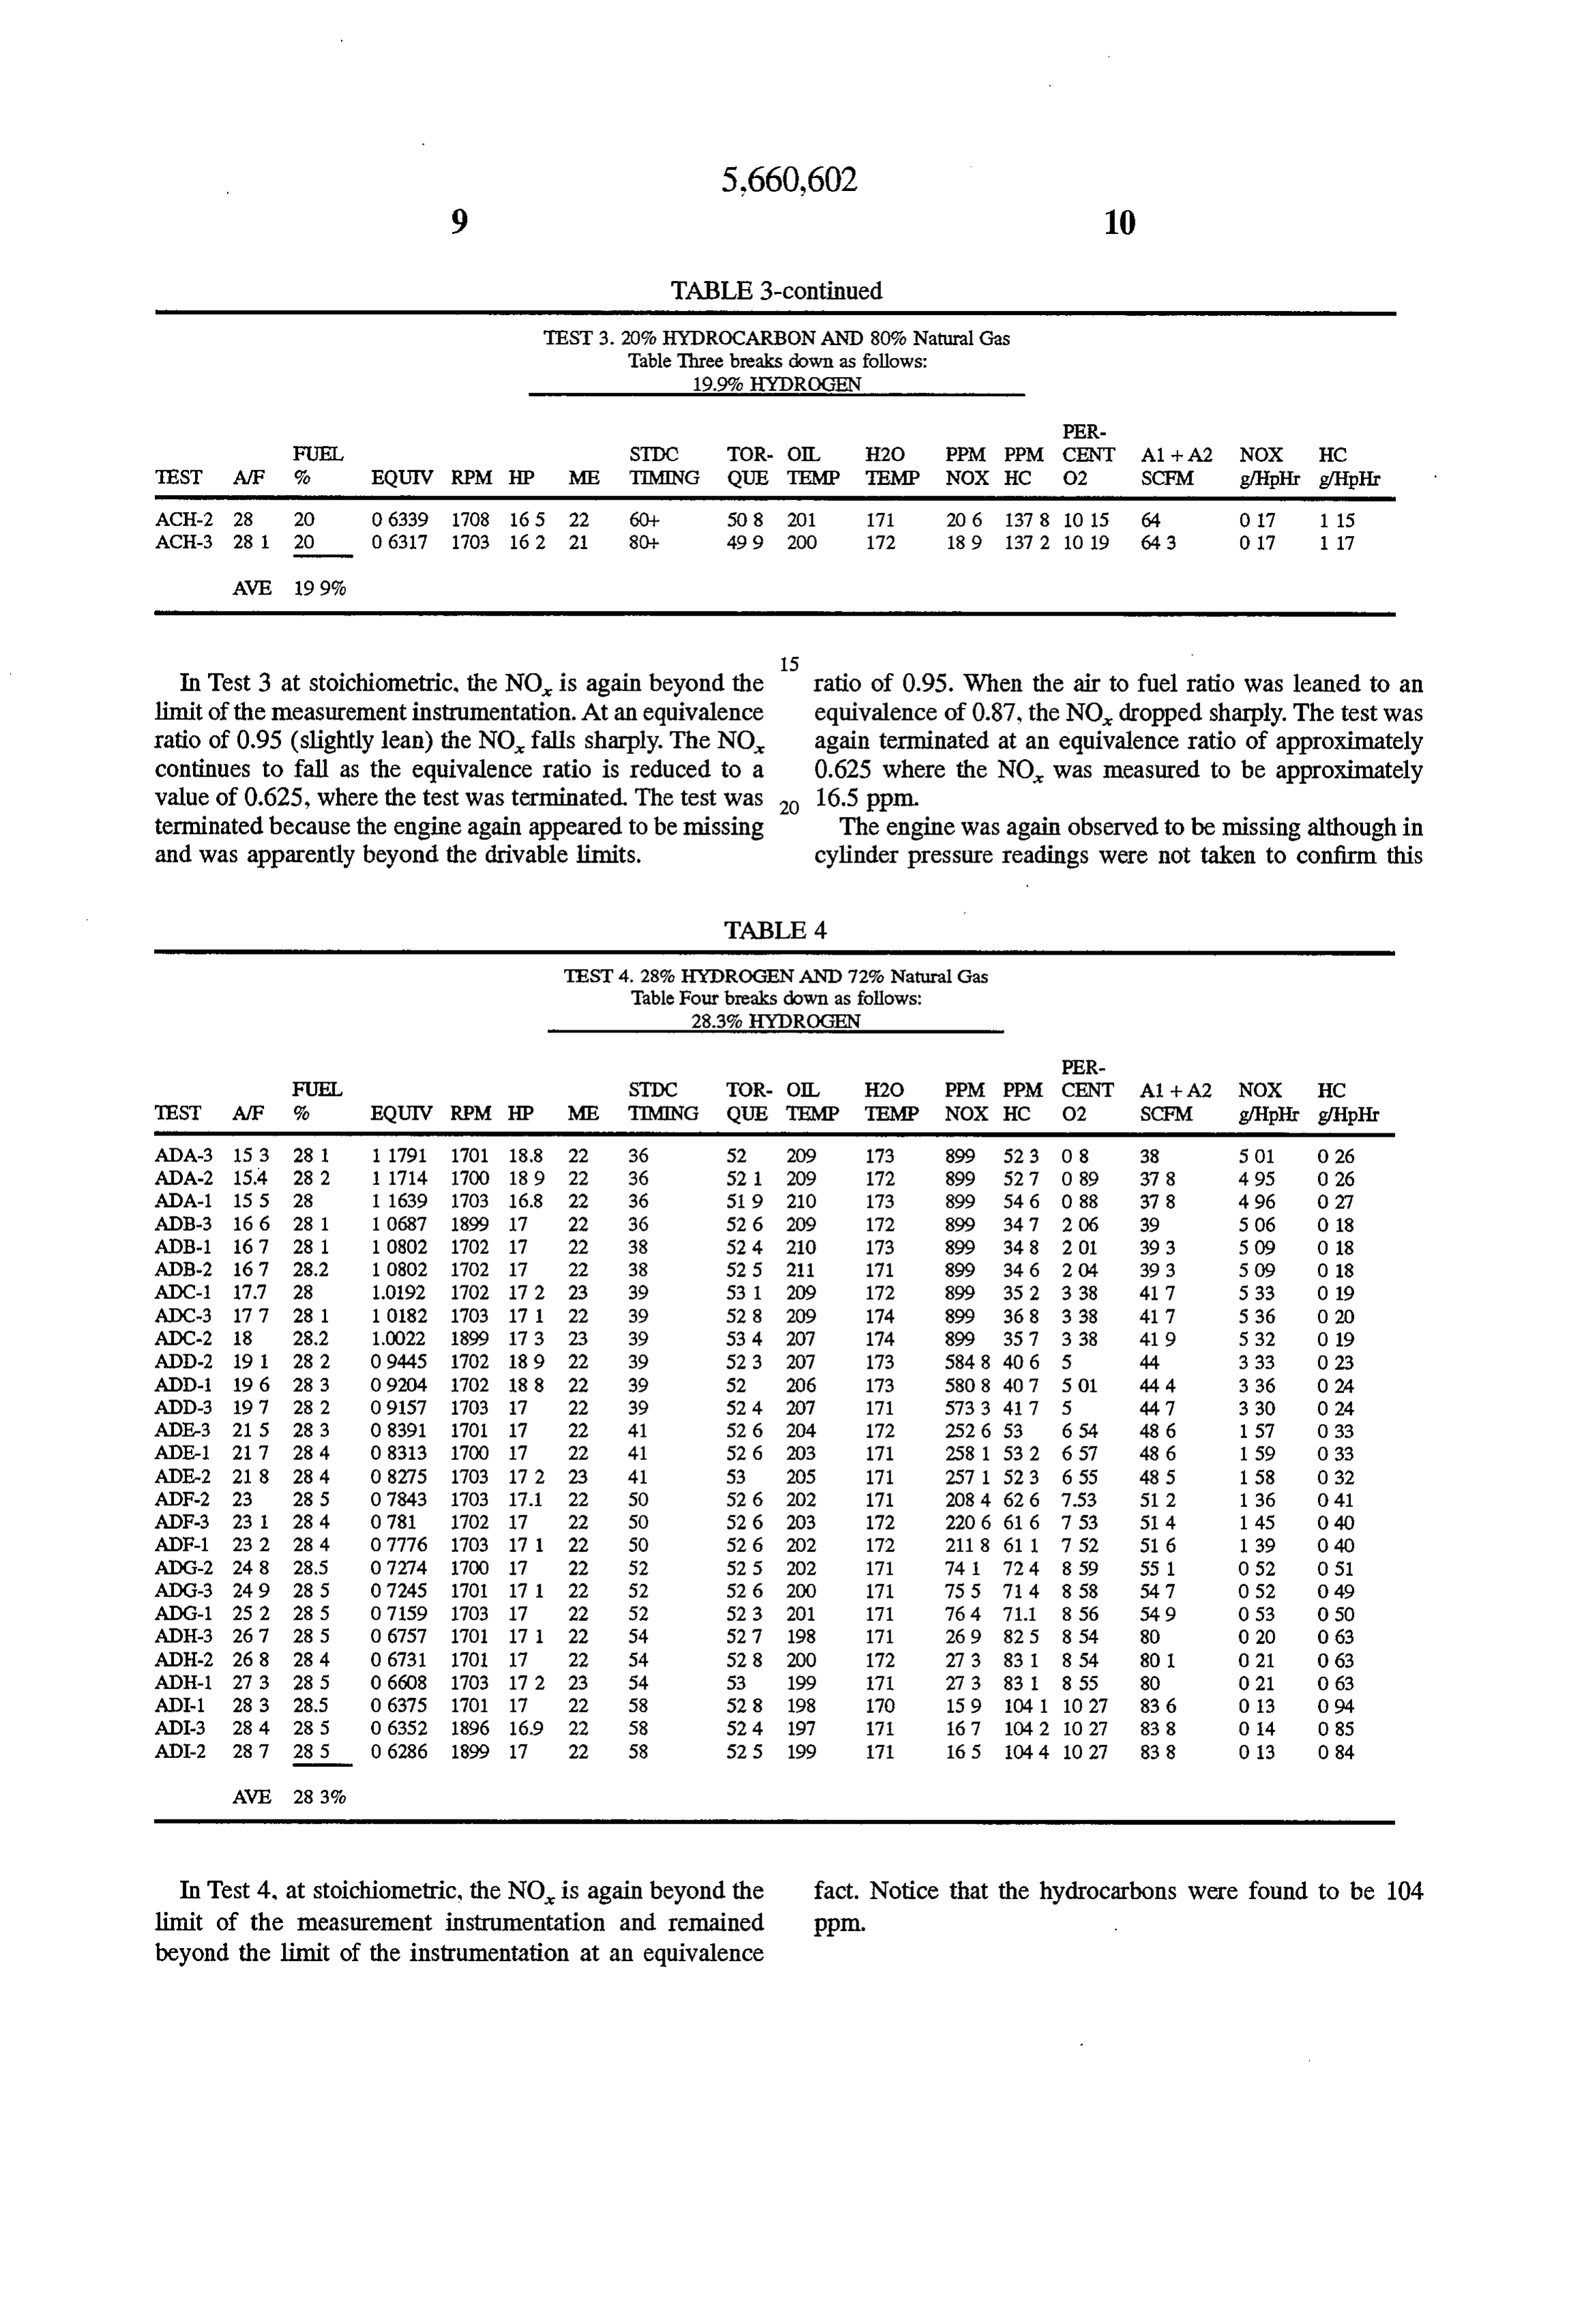
TABLE 3-continued
TEST 3.20% HYTDROCARBONAND 80% Natural Gas
Table Three breaks down as follows:
19.9% HYDROGEN
PER
FUEL STDC TOR. OIL H2O PPM PPM CENT A1+A2 NOX HC TEST AIF 9% EQUTV RPM HP ME TIMING QUE TEMP TEMP NOX HC O2 SCFM g/HipHr g/HipHr ACH-2 28 20 O 6339 1708 165 22 60+ 508 201 171 206 1378 10 15 64 O 7 115 ACH-3 28 1. 20 O 63.17 1703 162 2. 80 499 200 172 189 1372 10 19 643 O 17 117
In Test 3 at stoichiometric, the NO is again beyond the ratio of 0.95. When the air to fuel ratio was leaned to an limit of the measurement instrumentation. At an equivalence equivalence of 0.87, the NO, dropped sharply. The test was ratio of 0.95 (slightly lean) the NO, falls sharply. The NO again terminated at an equivalence ratio of approximately continues to fall as the equivalence ratio is reduced to a 0.625 where the NO was measured to be approximately value of 0.625, where the test was terminated. The test was 16.5 ppm.
terminated because the engine again appeared to be missing The engine was again observed to be missing although in and was apparently beyond the drivable limits. cylinder pressure readings were not taken to confirm this
TABLE 4
TEST 4.28% HYDROGENAND 72% Natural Gas
Table Four breaks down as follows:
28.3% HYDROGEN
PER
FUEL STDC TOR OL H2O PPM PPM CENT A1-A2 NOX HC TEST AIF EQUTV RPM HP ME TIMING QUE TEMP TEMP NOX HC O2 SCFM g/HipHr g/HipHr ADA-3 153 281 1791. 1701 18.8 22 36 52 209 173 899 523 O 8 38 501 O 26 ADA-2 15.4 282 1714 1700 189 22 36 521, 209 172 899 527 O 89 378 495 O 26 ADA-1 155 28 1, 1639 1703 16.8 22 36 5 9 210 173 899 546 0 88 378 496 0 27 ADB-3 16. 6 281 10687 1899 17 22 36 52 6 209 172 899 34 7 206 39 5 O6 O 18 ADB-1 167 281 10802 1702 17 22 38 52 4 210 173 899 348 201 393 5 09 0 18 ADB-2 167 28.2 10802 1702 17 22 38 525 211 171 899 34 6 204 393 509 0 18 ADC- 7.7 28 1092 1702 T2 23 39 531, 209 172 899 352 338 417 533 O 19 ADC-3 177 281 10182 103 171 22 39 528 209 1T4 899 368 338 417 536 O20 ADC-2 18 28.2 1.0022, 1899 17 3 23 39 53 4. 207 14 899 357 338 419 532 O 19 ADD-2 19 282 O9445 1702 189 22 39 523 207 173 584.8 406 5 44 333 O 23 ADD- 19 6 283 O9204 1702 188 22 39 52 2O6 173 5808 407 501 444 336 O 24 ADD-3 197 282 O9157 1703 17 22 39 524 207 171 5733 417 5 447 330 0 24 ADE-3 215 283 O 8391 T01. 17 22 41 526 204 172 252 6 53 654 486 157 O33 ADE-1 217 284 O 833 100 17 22 41 526 203 171 2581 532 657 486 1.59 O 33 ADE-2 218 28 4 O 82.75 1703 17 2 23 41 53 205 171 2571 523 655 485 158 O32 ADF-2 23 285 0.7843 1703 17.1 22 50 526 202 171 2084 626 (53 512 136 O 41 ADF-3 23 284 O781 1702 17 22 50 526 203 172 2206 616 53 514 145 O 40 ADF-1 23 2. 284 O 7776. 1703 17 1 22 50 526 202 172 2118 611. 752 51, 6 139 0.40 ADG-2 24 8. 28.5 O 7274 700 17 22 52 52 5 202 171 74 724 859 551 052 OS1 ADG-3 249 285 0 7245 TO1 171 22 52 526 200 171 T55 T14 858 547 O 52 0.49 ADG-1 252 285 O7159 1703 17 22 52 523 201 171 764 71.1. 856 549 O53 O 50 ADH-3 267 285 O 6757 1701 17 22 54 527 198 171 269 825 854 80 O 20 O 63 ADH-2 268 284 O 6731. 1701 17 22 54 528 200 172 273 831, 854 801 O 21 O 63 ADH-1 27 3 285 O 6608 1703 17 2 23 54 53 199 171 273 83 855 80 0 21 O 63 AD-1 283 28.5 O 6375 1701 17 22 58 528 198 170 159 041. 10 27 836 O 3 0.94 AD-3 284 285 O 6352 1896 16.9 22 58 524. 197 T1 16 7 1042 10 27 838 014 0.85 AD-2 287 285 O 6286 1899 17 22 58 525 199 171 165 04 4 10 27 838 03 O 84
In Test 4, at stoichiometric, the NO is again beyond the fact. Notice that the hydrocarbons were found to be 104 limit of the measurement instrumentation and remained ppm.
beyond the limit of the instrumentation at an equivalence
Page 27
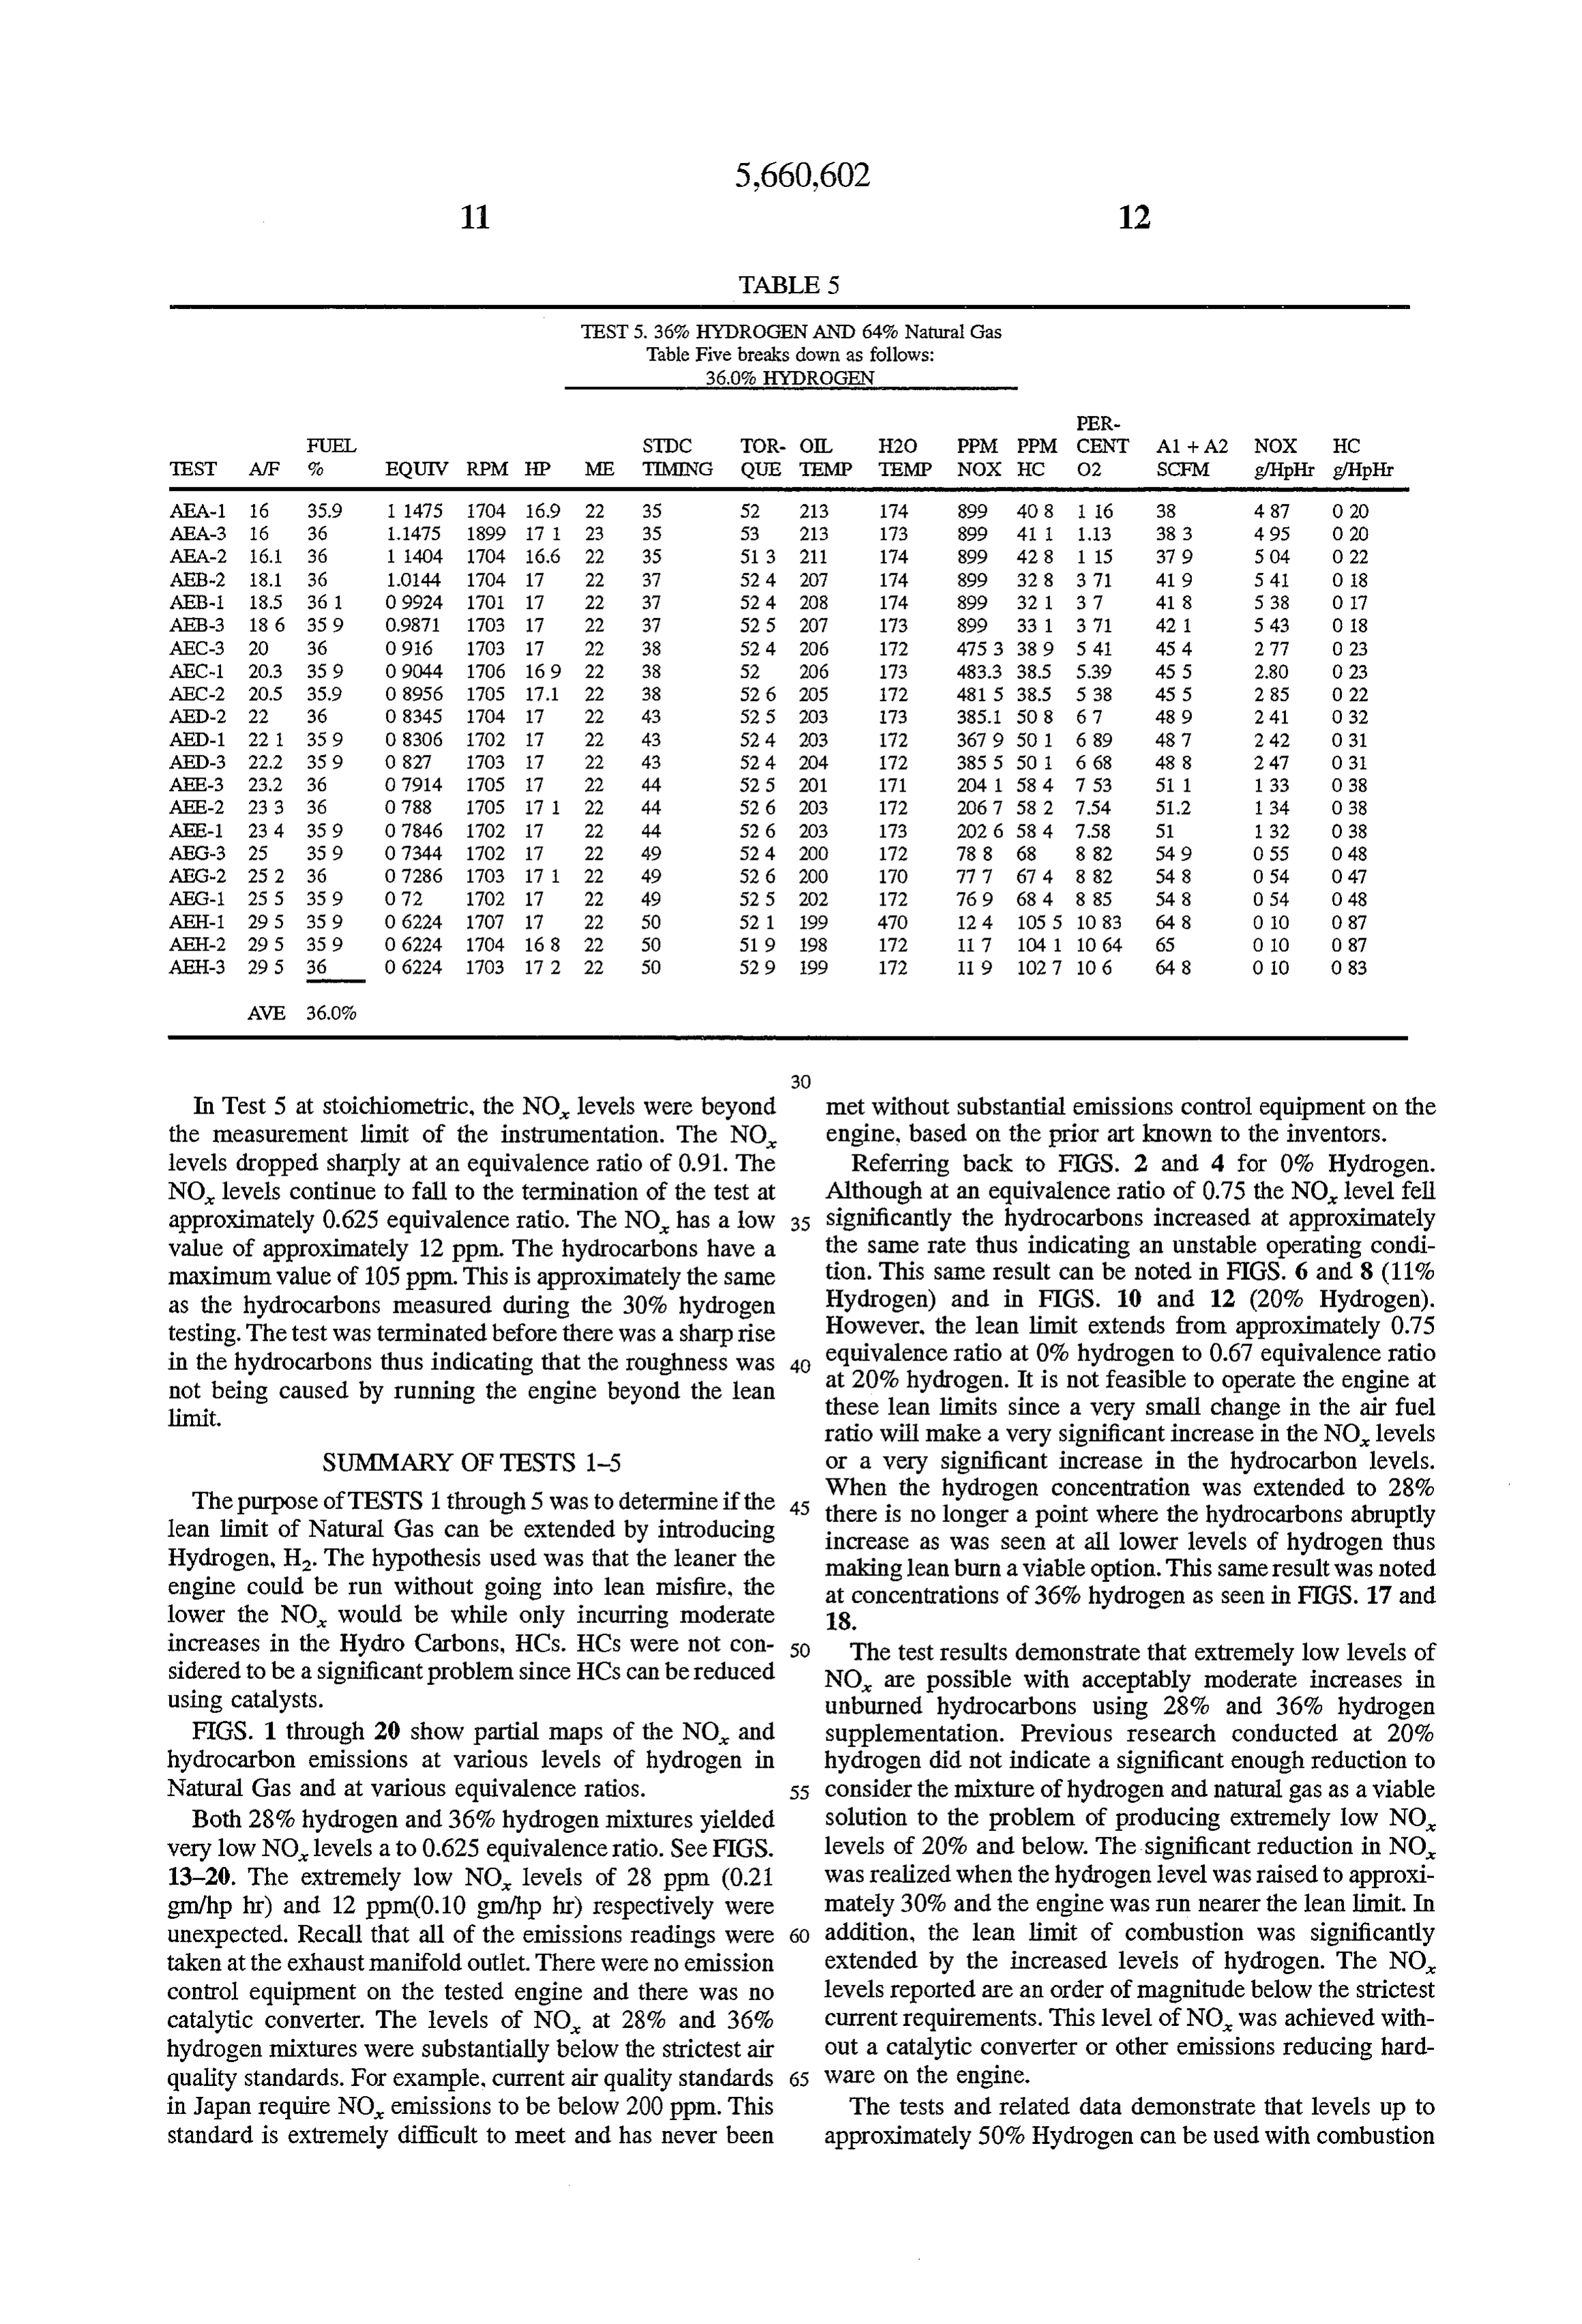
TABLE 5
TEST 5.36% HYDROGENAND 64% Natural Gas
Table Five breaks down as follows:
36.0% HYDROGEN
PER
FUEL STDC TOR- OIL H2O PPM PPM CENT A1-A2 NOX HC TEST AIF 9 EQUTV RPM HP ME TIMING QUE TEMP TEMP NOX HC O2 SCFM g/HipHr g/HipHr AEA-1 16 35.9 1. 1475 704 16.9 22 35 52 213 174 899 408 6 38 487 O 20 AEA-3 16 36 1.1475 1899 7 23 35 53 213 173 899 4, 1.13 383 495 0 20 AEA-2 16.1 36 1 404 1704 6.6 22 35 513 211 174 899 428 115 37 9 5 04. O 22 AEB-2 18.1 36 1044 1704 17 22 37 524 20 174 899 328 371 419 54. O 8 AEB- 18.5 361 O9924. 1TO 17 22 37 524 208 174 899 321 37 41 8 538 O 7 AEB-3 186 359 0.9871 1703 17 22 37 52 5 207 113 899 33 1 371 42 1. 543 0 18 AEC-3 20 36 O96 1703 17 22 38 524 206 172 4753 389 541 454 277 O 23 AEC-1 20.3 359 O9044 1706 169 22 38 52 2O6 173 483.3 38.55.39 455 2.80 O 23 AEC-2 20.5 35.9 O 89.56 1705 17.1 22 38 526 205 72 4815 38.5 538 45.5 285 O 22 AED-2 22 36 O 8345 704 17 22 43 525 203 73 385.1 508 67 a89 2 41 O 32 AED-1 22 359 O 8306 TO2 7 22 43 524. 203 172 3679 5O1 689 48T 242 O 31 AED-3 22.2 359 O827 TO3 17 22 43 524 204 172 3855 50 6 68 488 247 O3 AEE-3 23.2 36 O 7914 1705 7 22 44 525 201 171 204 1584 753 511 133 O38 AEE-2 233 36 O788 1705 7 22 44 526 203 172 2O67 582 7.54 51.2 134 O38 AEE-1 234 359 O 1846 1702 17 22 44 526 203 173 2026 584 7.58 51 32 038 AEG-3 25 359 O7344 1702 17 22 49 524 200 172 788 68 882 549 O 55 O 48 AEG-2 252 36 O 7286 1703 17 1 22 49 526 200 170 777 674 882 548 O54 O 47 AEG-1 255 359 O 72 1702 17 22 49 525 202 172 769 684 885 548 O54 O 48 AEH-1 295 359 O 6224. 1707 17 22 50 521, 199 470 124 1055 1083 648 OO O 87 AEH-2 295 359 O 6224 1704 16.8 22 50 519 198 172 17 1041 1064 65 O 10 O 87 AEH-3 295 36 O 6224. 1103 17 2 22 50 529 99 172 19 1027 106 648 00 O 83
In Test 5 at stoichiometric, the NO levels were beyond met without substantial emissions control equipment on the the measurement limit of the instrumentation. The NO engine, based on the prior art known to the inventors. levels dropped sharply at an equivalence ratio of 0.91. The Referring back to FIGS. 2 and 4 for 0%. Hydrogen. NO levels continue to fall to the termination of the test at Although at an equivalence ratio of 0.75 the NO level fell approximately 0.625 equivalence ratio. The NO has a low 35 significantly the hydrocarbons increased at approximately value of approximately 12 ppm. The hydrocarbons have a the same rate thus indicating an unstable operating condi maximum value of 105 ppm. This is approximately the same tion. This same result can be noted in FIGS. 6 and 8 (11% as the hydrocarbons measured during the 30% hydrogen Hydrogen) and in FIGS. 10 and 12 (20% Hydrogen). testing. The test was terminated before there was a sharp rise However, the lean limit extends from approximately 0.75 in the hydrocarbons thus indicating that the roughness was 40 equivalence ratio at 0% hydrogen to 0.67 equivalence ratio not being caused by running the engine beyond the lean these at 20% hydrogen. It is not feasible to operate the engine at limit. lean limits since a very small change in the air fuel ratio will make a very significant increase in the NO levels
SUMMARY OF TESTS 1-5 or a very significant increase in the hydrocarbon levels. The purpose of TESTS 1 through 5 was to determine if the 45 When the hydrogen concentration was extended to 28% lean limit of Natural Gas can be extended by introducing there is no longer a point where the hydrocarbons abruptly Hydrogen, H2. The hypothesis used was that the leaner the increase as was seen at all lower levels of hydrogen thus making lean burn a viable option. This same result was noted engine could be run without going into lean misfire, the at concentrations of 36% hydrogen as seen in FIGS. 17 and lower the NO would be while only incurring moderate 18.
increases in the Hydro Carbons, HCs. HCs were not con 50 The test results demonstrate that extremely low levels of sidered to be a significant problem since HCs can be reduced NO are possible with acceptably moderate increases in using catalysts. unburned hydrocarbons using 28% and 36% hydrogen FIGS. 1 through 20 show partial maps of the NO, and Supplementation. Previous research conducted at 20% hydrocarbon emissions at various levels of hydrogen in hydrogen did not indicate a significant enough reduction to Natural Gas and at various equivalence ratios. 55 consider the mixture of hydrogen and natural gas as a viable Both 28% hydrogen and 36% hydrogen mixtures yielded solution to the problem of producing extremely low NO very low NO levels a to 0.625 equivalence ratio. See FIGS. levels of 20% and below. The significant reduction in NO 13-20. The extremely low NO levels of 28 ppm (0.21 was realized when the hydrogen level was raised to approxi gm/hp hr) and 12 ppm (0.10 gm/hphr) respectively were mately 30% and the engine was run nearer the lean limit. In unexpected. Recall that all of the emissions readings were 60 addition, the lean limit of combustion was significantly taken at the exhaust manifold outlet. There were no emission extended by the increased levels of hydrogen. The NO control equipment on the tested engine and there was no levels reported are an order of magnitude below the strictest catalytic converter. The levels of NO at 28% and 36% current requirements. This level of NO was achieved with hydrogen mixtures were substantially below the strictest air out a catalytic converter or other emissions reducing hard quality standards. For example, current air quality standards 65 ware on the engine.
in Japan require NO emissions to be below 200 ppm. This The tests and related data demonstrate that levels up to Standard is extremely difficult to meet and has never been approximately 50%. Hydrogen can be used with combustion
Page 28
engines. Over 50%. Hydrogen gas in the mixture could create Methane, Carbon Dioxide, Nitrogen, Ethane, Propane, possible problems related to storage and safety. However, Iso-Butane, N-Butane, Iso Pentane, N-Pentane, and the specific mixture amounts of between approximately 21 Hexanes Plus.
and 50%. Hydrogen, can be further narrowed down by 3. The method of claim 1, wherein the operating step engine size(46.8 cylinders) and regulatory concerns. 5 further includes;
While natural gas has been referred to as including a catalytic converter to further reduce hydrocarbon emis SOS.
primarily methane, natural gas can include other compo 4.The method of claim.1, wherein the lean burn operating nents in much smaller amounts. Besides primarily contain ing methane, natural gas can include Carbon Dioxide, 10 stepanfurther air and includes:
fuel equivalence ratio of approximately 0.625.
Nitrogen, Ethane, Propane, Iso-Butane, N-Butane, Iso 5. The method of claim 1, wherein the internal combus Pentane, N-Pentane, and Hexanes Plus.
tion engine further includes an engine size selected from one
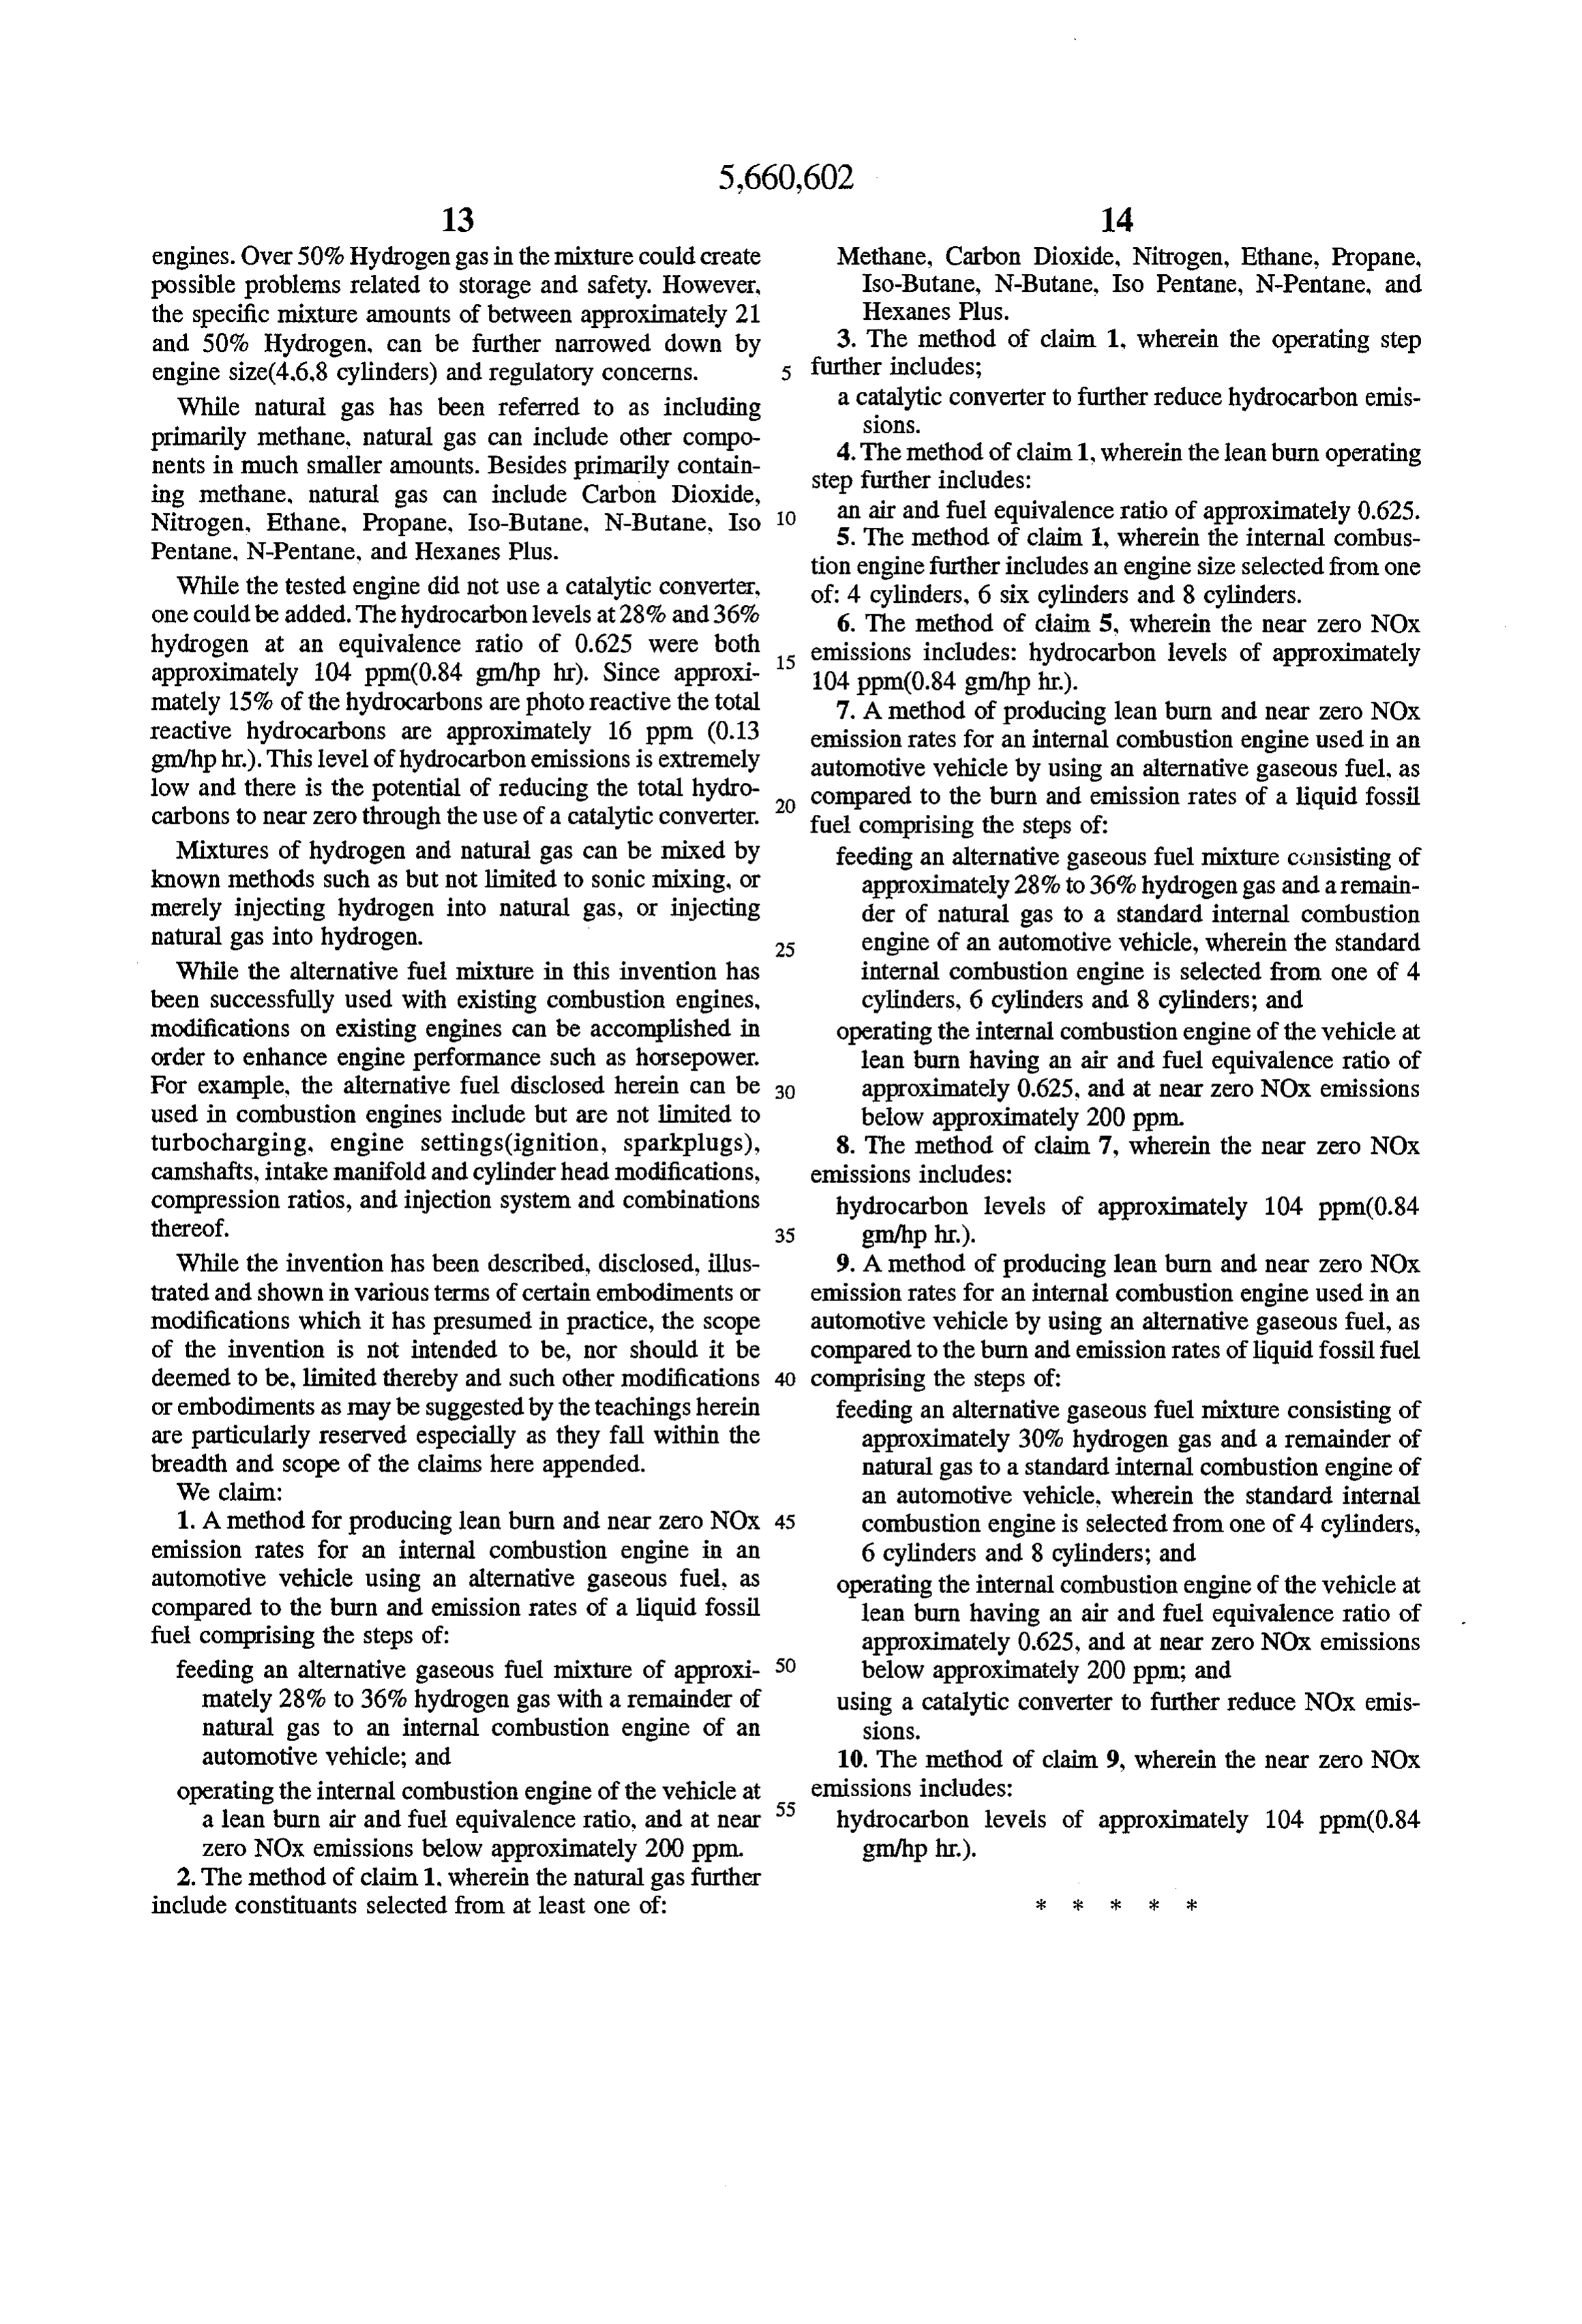
While the tested engine did not use a catalytic converter, of: 4 cylinders, 6 six cylinders and 8 cylinders. one could be added. The hydrocarbon levels at 28% and 36% 6. The method of claim 5, wherein the near Zero NOx hydrogen at an equivalence ratio of 0.625 were both 15 emissions includes: hydrocarbon levels of approximately approximately 104 ppm(0.84 gm/hp hr). Since approxi 104 ppm(0.84 gm/hphr).
mately 15% of the hydrocarbons are photo reactive the total 7. A method of producing lean burn and near zero NOx reactive hydrocarbons are approximately 16 ppm (0.13 emission gm/hphr.). This level of hydrocarbon emissions is extremely automotiverates for an internal combustion engine used in an vehicle by using an alternative gaseous fuel, as low and there is the potential of reducing the total hydro compared to the burn and emission rates of a liquid fossil carbons to near Zero through the use of a catalytic converter. fuel comprising the steps of:
Mixtures of hydrogen and natural gas can be mixed by feeding an alternative gaseous fuel mixture consisting of known methods such as but not limited to sonic mixing, or approximately 28% to 36% hydrogen gas and a remain merely injecting hydrogen into natural gas, or injecting der of natural gas to a standard internal combustion natural gas into hydrogen. 25 engine of an automotive vehicle, wherein the standard While the alternative fuel mixture in this invention has internal combustion engine is selected from one of 4 been successfully used with existing combustion engines, cylinders, 6 cylinders and 8 cylinders; and modifications on existing engines can be accomplished in operating the internal combustion engine of the vehicle at order to enhance engine performance such as horsepower. lean burn having an air and fuel equivalence ratio of For example, the alternative fuel disclosed herein can be 30 approximately 0.625, and at near zero NOx emissions used in combustion engines include but are not limited to below approximately 200 ppm. turbocharging, engine settings(ignition, sparkplugs), 8. The method of claim 7, wherein the near zero NOx camshafts, intake manifold and cylinder head modifications, emissions includes:
compression ratios, and injection system and combinations hydrocarbon levels of approximately 104 ppm(0.84 thereof. 35 gm/hphr.).
While the invention has been described, disclosed, illus 9. A method of producing lean burn and near zero NOx trated and shown in various terms of certain embodiments or emission rates for an internal combustion engine used in an modifications which it has presumed in practice, the scope automotive vehicle by using an alternative gaseous fuel, as of the invention is not intended to be, nor should it be compared to the burn and emission rates of liquid fossil fuel deemed to be, limited thereby and such other modifications comprising the steps of:
or embodiments as may be suggested by the teachings herein feeding an alternative gaseous fuel mixture consisting of are particularly reserved especially as they fall within the approximately 30% hydrogen gas and a remainder of breadth and scope of the claims here appended. natural gas to a standard internal combustion engine of We claim: an automotive vehicle, wherein the standard internal 1. A method for producing lean burn and near zero NOx 45 combustion engine is selected from one of 4 cylinders, emission rates for an internal combustion engine in an 6 cylinders and 8 cylinders; and automotive vehicle using an alternative gaseous fuel, as operating the internal combustion engine of the vehicle at compared to the burn and emission rates of a liquid fossil lean burn having an air and fuel equivalence ratio of fuel comprising the steps of: approximately 0.625, and at near ZeroNOx emissions feeding an alternative gaseous fuel mixture of approxi SO below approximately 200 ppm; and mately 28% to 36% hydrogen gas with a remainder of using a catalytic converter to further reduce NOx emis natural gas to an internal combustion engine of an SOS automotive vehicle; and 10. The method of claim 9, wherein the near Zero NOx operating the internal combustion engine of the vehicle at 55 emissions includes:
a lean burn air and fuel equivalence ratio, and at near hydrocarbon levels of approximately 104 ppm (0.84 zero NOx emissions below approximately 200 ppm. gm/hphr.).
2. The method of claim 1, wherein the natural gas further include constituants selected from at least one of:
Provenance
- Collection
- Patents citing this work
- Original assignee
- University of Central Florida
- Pages
- 28
- Method
- pdftotext (the PDF's own text layer) + pdftoppm 300dpi page scans
- Patent office record
- patents.google.com →
- Source
- Google Patents citing-documents table
- Inventors
- Robert Kirk Collier, Jr.; Robert Louis Hoekstra; David Neal Mulligan; Douglas Edward Hahn; University of Central Florida
- Published
- 1997-08-26
- Transcribed from
- patentimages.storage.googleapis.com →