patent · US5736410
Up-converting reporters for biological and other assays using laser excitation techniques
7 April 1998
Page 1 — bibliographic record
United States Patent (19) 11 Patent Number: 5,736,410 Zarling et al. 45) Date of Patent: Apr. 7, 1998 54 UP-CONVERTING REPORTERS FOR 4,492.75 l/1985 Boguslaski et al. ................... 435/.2 BOLOGICAL AND OTHER ASSAYS USING 4,666,862 5/1987 Chan ....................................... 436/50 LASER EXCITATION TECHNIQUES 4,695,393 9/1987 Whitehead et al. ... 252/62.54
75) Inventors: David A. Zarling. Menlo Park, Calif.; 4,724.217 2/1988 Miller et al. ... Michel J. Rossi, Lausanne, 4,727,020 2/1988 Recktenwald ............................... 435/6 4.837,169 6/1989 Toner ............. ... 436,546
Switzerland; Norman A. Peppers, 4.905,169 2/1990 Buican et al. .......................... 364,525 Belmont. Calif.; James Kane.
Lawrenceville, N.J.; Gregory W. Faris, (List continued on next page.) Menlo Park. Calif.; Mark J. Dyer. San FOREIGN PATENT DOCUMENTS
Jose, Calif.; Steve Y. Ng. San
Francisco. Calif.; Luke W. Schneider, O07859 2f1983 European Pat. Off.. Half Moon Bay. Calif. O74744 3/1986 European Pat. Off. .
73) Assignee: SRI International. Menlo Park, Calif. 2103362 2f1983 United Kingdom.
OTHER PUBLICATIONS
22 Filed: Jun. 7, 1995 P.A. Santa Cruz et al. Quinn. Nova 1983, 6, 149-151. B.J. Tromberg et al. Proc. SPIE-int. Soc. Opt. Eng. 1991.
Related U.S. Application Data
63 Continuation-in-part of Ser. No. 416,023, Mar. 30, 1995, J. Wojciechowski et al. Electron Technol. 1978, 11. 31-47. which is a continuation-in-part of Ser. No. 381,006, Jan. 30, R. Nakano et al. Oyo Butsuri 1983. 52, 806-808. 1995, abandoned, which is a continuation of Ser. No.
946.068, Sep. 14, 1992, abandoned. K. Moser et al. J. Appl. Phys, 1985, 57. 5438-5442.
(51) Int. Cl. ....................... G01N 21/64; G01N 21/62:
GON 2101 (List continued on next page.)
(52) U.S. Cl. ................... 436/172: 422/82.05: 422/82.09:
422/81: 356/244; 356/346; 250/458.1: 250/459.1: Primary Examiner-Arlen Soderquist 436/52, 436/63: 436/81. 436/524; 436/518 Attorney, Agent, or Firm-Morgan, Lewis and Bockius LLP 58) Field of Search .............................. 422/82.05, 82.09, 57 ABSTRACT
518, 519, 525,526. 56: 356/244, 73, 327. The invention provides methods. compositions, and appa 346. 365, 39; 250/458.1459.1 ratus for performing sensitive detection of analytes, such as biological macromolecules and other analytes, by labeling a 56) References Cited probe molecule with an up-converting label. The up-converting label absorbs radiation from an illumination
frequencies, providing enhanced signal-to-noise ratio and 3.593,055 7/1971 Geusic et al. ........ ... 33/501 the essential elimination of background sample autofluores 3.599,109 8/1971 Guggenheim et al. ... 372/40 cence. The methods, compositions, and apparatus are suit 3,634,614 1/1972 Geusic et al. ........ ... 348/759 4,032.35l 6/1977 Auzel et al. ................................ 50/3 able for the sensitive detection of multiple analytes and for 4,100.416 7/1978 Hirschfeld et al. 250/.461.2 various clinical and environmental sampling techniques. 4.206.132 6/1980 Sievers ...................................... 534/15 4,228.237 10/1980 Hevey et al. ............................... 435/5 23 Claims, 35 Drawing Sheets
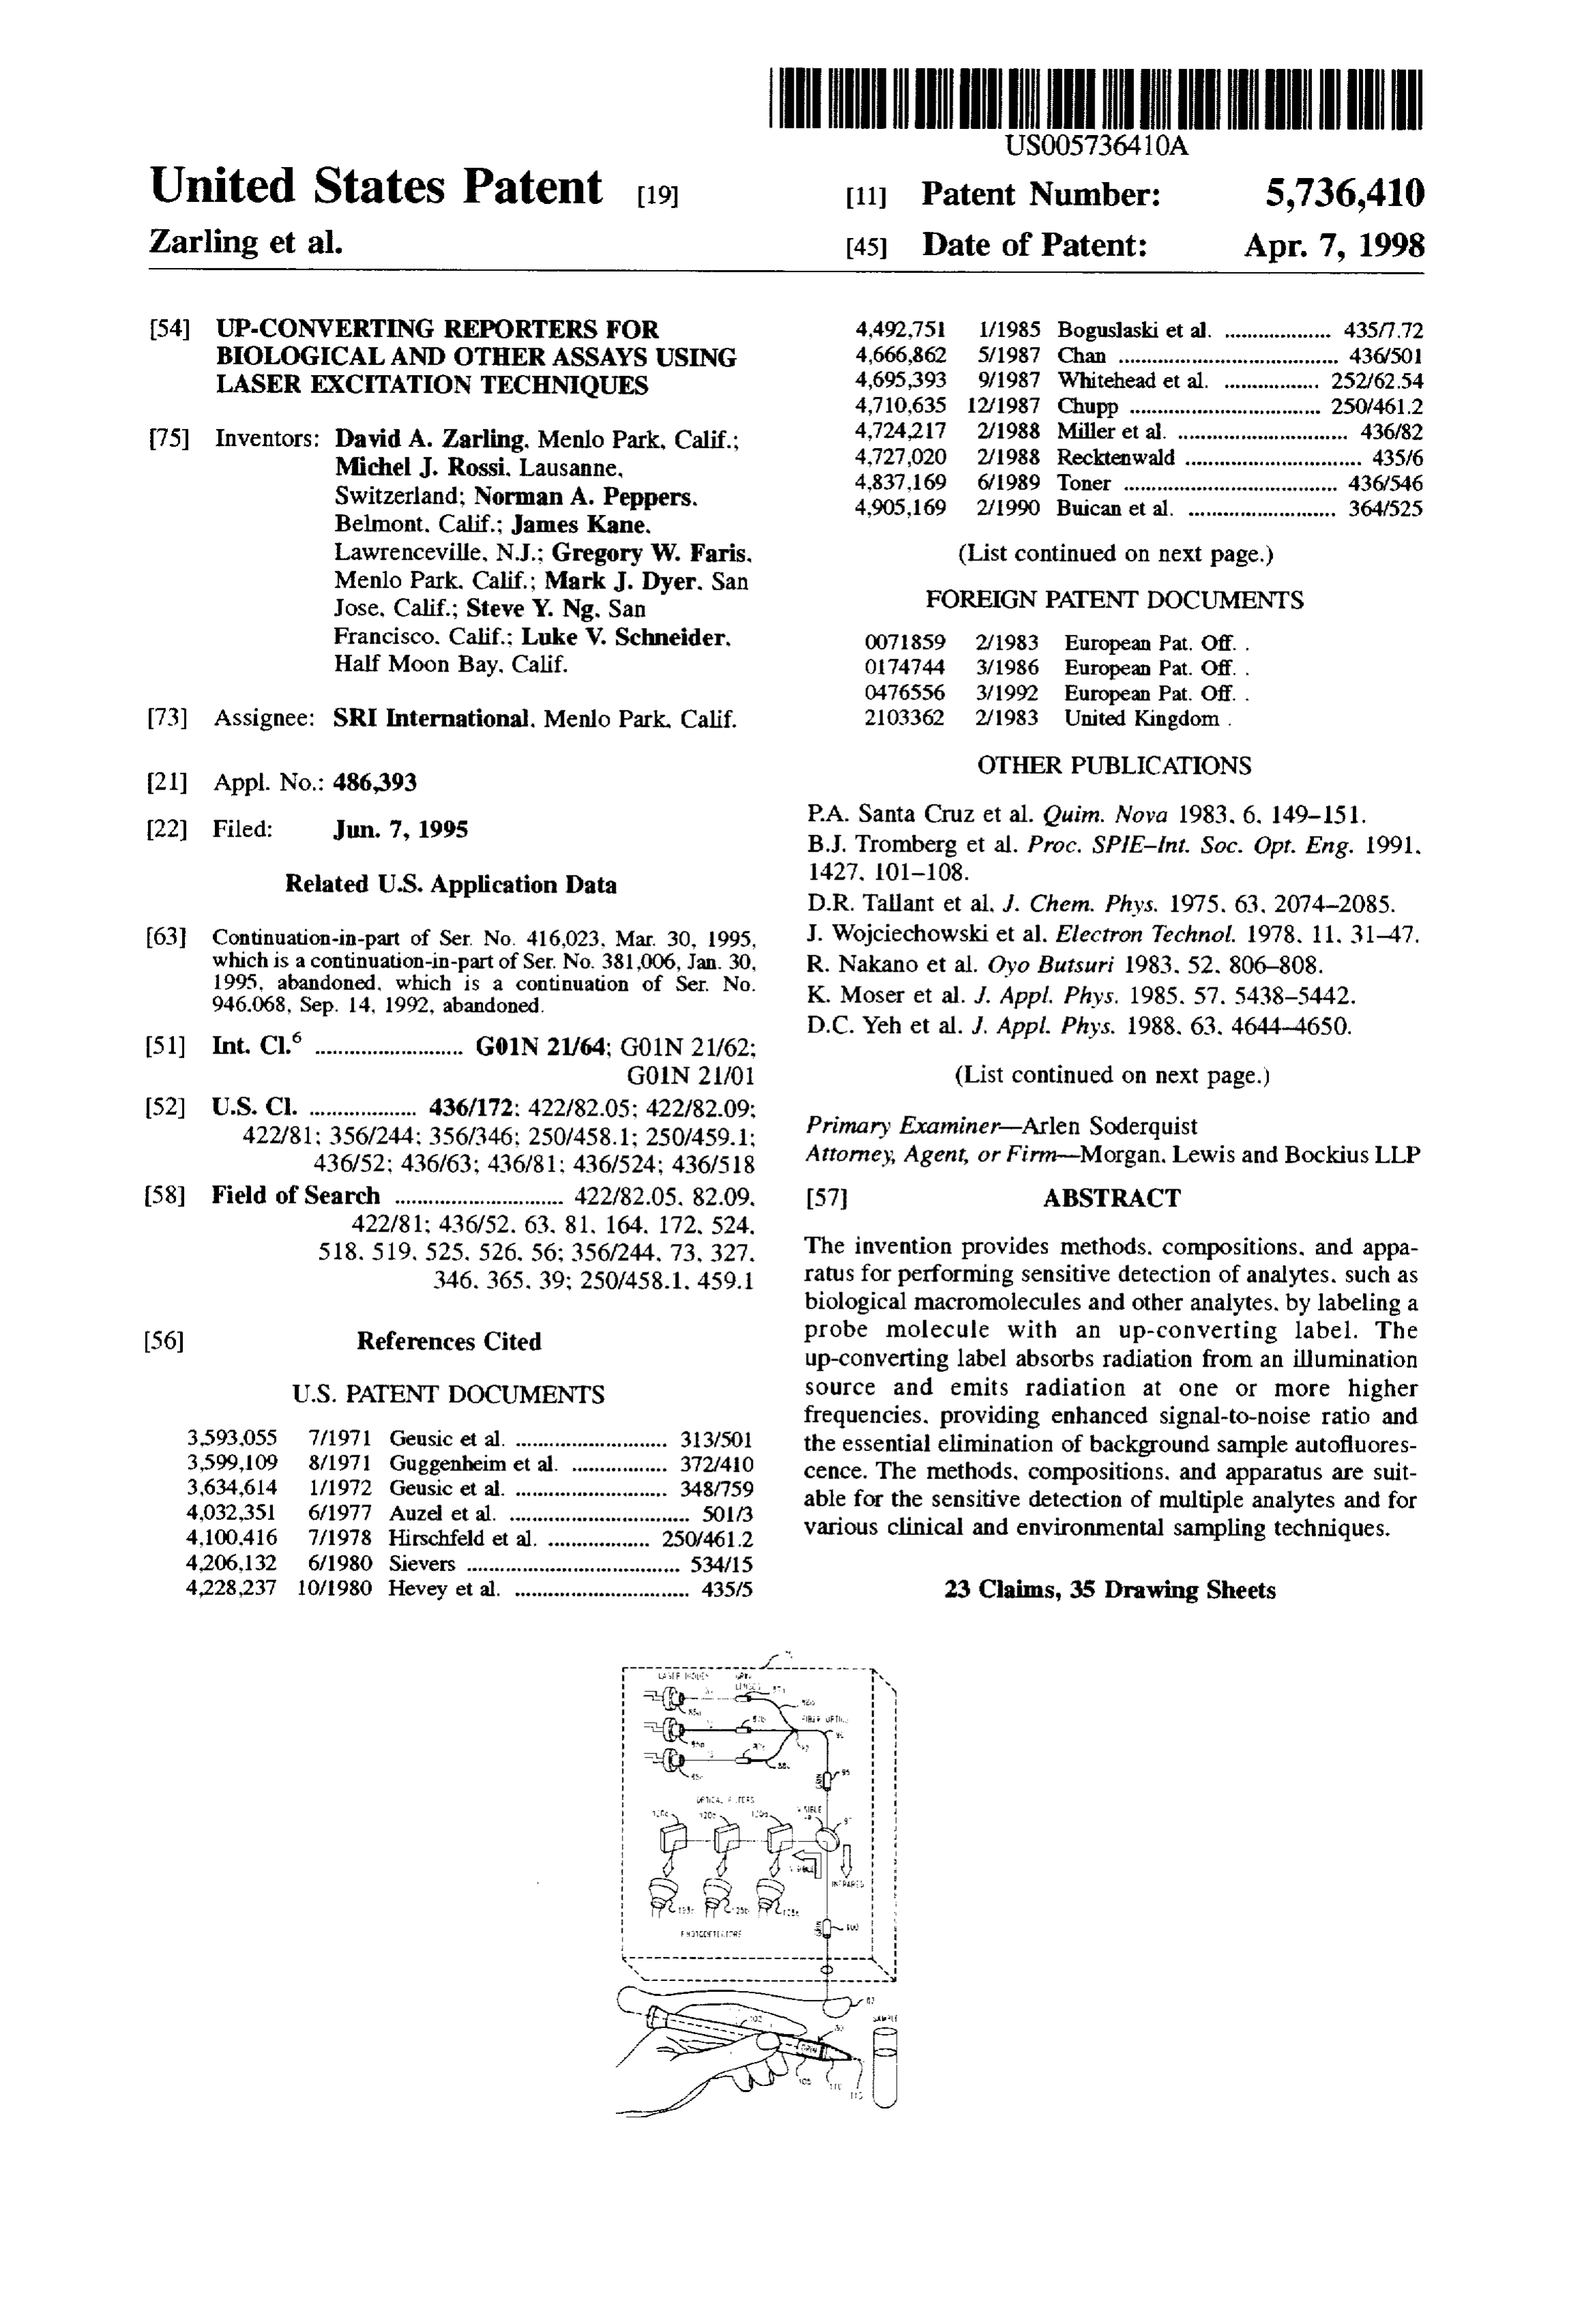
Page 2
4.913,383 4/1990 Imai et al. ........................... 422,82.01 green-emitting infrared-excited phosphors. J. Electrochen. 4,983,359 1/1991 Tomioka et al. .......................... 422/81 Soc. 119:1561-1564.
5,043,265 8/1991 Tanke et al. . ... 435/6 Leif and Vallarino (1991). "Rare-earth chelates as fluores 5,066,580 1/1991 Lee et al. ... 435/.2 cent markers in cell separation and analysis," in Cell Sepa 5,132,242 7/1992 Cheung ................ ... 436/501 ration Science and Technology, Amer: Chem. Soc., Chapt. 3, 5,141,740 8/1992 Rajagopalan et al. ... 4249.364 pp. 41-58.
5,166,948 1/1992 Gavrilovic et al. ... 372/70 Lenth and MacFarlane (1992), Lasers, Optics & Photonics 5,185,265 2/1993 Steen et al. ........... 436/63 News, 3:8-15.
5,188,942 2/1993 Reddington et al. . ....... 435/5 5,196,709 3/1993 Berndt et al. ..... 250/458.1 Louge et al. (1991), "Optical fiber measurements of particle 5,208.65 5/1993 Buican ..... ... 356,346 velocity using laser-induced phosphorescence." Applied 5.247.339 9/1993 Ogino ........................................ 356/3 Optics 30:1976-1981.
5,324,633 6/1994 Fodor et al. ................................ 435/6 Lovgren et al. (1992). "Detection of lanthanide chelates by OTHER PUBLICATIONS time-resolved fluorescence." in Nonisotopic DNA Probe Techniques, pp. 227-261. L.J. Kricka, ed., Academic Press.
D.C. Yeh et al. Phys. Rey. B 1989, 39, 80-90. Manashirov et al. (Jan. 23, 1989), "Effect of the purity of S. Tanabe et al. J. Non-Cryst. Solids 1990, 122, 79-82. initial substances on luminescence intensity of erbium in H.B. Beverloo et al. Cytometry 1990, 11, 784-792, anti-stroke luminophores." Chemical Abstracts, 110:457. Andrés D. Campiglia et al. "Utilization of an Inorganic Abstract No. 3075OB.
Phosphor as a Reference Signal in Solid-Surface Room McFarlane (1989). "Dual wavelength visible upconversion Temperature Phosphorimetry" Anal. Chem. No. 60, pp. laser." Appl. Phys. Letts. 54:2301-2302. 2165-2167 (1988). McFarlane (1988), "Violet CW neodymium upconversion Allain et al. (1990). "Room temperature CW tunable green laser." Appl. Phys. Lett. 52:1300–1302. upconversion holmium fibre laser". Electronics Letters Mukkala et al. (1989). "The synthesis and use of activated 26:26-263. N-benzyl derivatives of diethylenetriaminetetraacetic acids: Allain et al. (1990). "Blue upconversion fluorozirconate alternative reagents for labelling of antibodies with metal fibre laser". Electronics Letters 26:166-168. ions.' Anal. Bio, 176:319-325. Auzel (1973), "Materials and devices using double-pumped Nguyen et al. (1989), "Blue-green (450-nm) upconversion phosphors and energy transfer”. Proceedings of the IEEE Tm":YLF laser." Applied Optics 28:3553-3555.
Berthou and Jorgensen (1990). "Optical-fiber temperature Eichstein et al. (1988). "Laser-excited time-resolved solid-phase fluoroimmunoassays with the new europium sensor based on upconversion-excited fluorescence", Optics chelate 4.7-bis(chlorosulfophenyl)-1,10-phenanthroline-2, Letters 5: 100-1102. 9-dicarboxylic acid as label." Anal. Chem. 60:1069-1074. Beverloo et al. (1992). "Preparation and microscopic visu Rich and Pinnow (1972). "Exploring the ultimate efficiency alization of multicolor luminescent immunophosphors". in infrared-to-visible converting phosphors activated with Cytometry 13:561-570. Er and sensitized with Yb." J. Appl. Phys. 43:2357-2365. Beverloo et al. (1990), "Inorganic phosphors as new lumi Schindele and Renzoni (1990), "Ultra-fluors: new fluoro nescent labels for immunocytochemistry and time-resolved phores for immunological applications." J. Clin. Immura. microscopy", Cytometry 11:784-792. 3:182-186.
Bethune et al. (1993). "Atoms in carbon cages: the structure Seveus et al. (1992). "Time-resolved fluorescence imaging and properties of endohedral fullerences”. Nature of europium chelate label in immunohistochemistry and in
Camus et al. (1978), "Two-photon absorption spectroscopy situ hybridization." Cytometry 13:329-338. in ytterbium." J. Phys. B. Atom. Molec. Phys. Silversmith et al. 1986, "Green infrared-pumped erbium 11:L395-L397. upconversion laser." J. Opt. Soc. Am. A3, p.128, pdp12. Diamandis and Christopoulos (1992), “Detection of lan Smart et al. (1991), "CW room temperature upconversion thanide chelates and multiple labeling strategies based on lasing at blue, green and red wavelengths in infrared time-resolved fluorescence," in Nonisotopic DNA Probe -pumped Pr-doped fluoride fibre." Electronics Letters
Techniques, pp. 263-274, L.J. Kricka. ed., Academic Press.
Evangelista et al. (1991), "Enzyme-amplified lanthanide Soini and Kojola (1983). "Time-resolved fluorometer for luminescence for enzyme detection in bioanalytical assays." lanthanide cachelates-a new generation of nonisotopic Anal. Biol. 197:213-224. immunoassays." Clin. Chem, 29/1:65-68. Gudgin Templeton et al. (1991). "Time resolved fluores Soules and Hoffman (1981), “Luminescent materials (phos cence detection of enzyme-amplified lanthanide lumines phors)." in Encyclopedia of Chemical Technology, Third cence for nucleic acid hybridization assays." Clin. Chem. Edition, vol. 14, pp. 527-545. 37/9:1509-1512. Tiffany (1986). "Fluorometry, nephelometry, and turbidim Hemmila et al. (1984). “Europium as a label in time-re etry," in Ttextbook of Clinical Chemistry. Tietz, ed., W.B. solved immunofluorometric assays.” Anal. Bio. Saunders Co. pp. 78-90.
137:335-343. Voller (1978), "The enzyme linked immunosorbent assay Johnson et al. (1972), "Infrared-to-visible conversion by (ELISA)," in Diagnostic Horizons, vol. 2. No. 1, pp. 1-7. rare-earth ions in crystals." J. Appl. Phys, vol. 43. No. 3. Xu and hemmila (1992), "Co-fluorescence enhancement Johnston and Wright (1979), "Trace analysis of nonfluores system based on pivaloyltrifluoroacetone and yttrium for the centions by associative clustering with a fluorescent probe." simultaneous detection of europium, terbium. Samarium and Anal. Chen. 51:1774-1780. dysprosium.” Anal. Chinica Acta. 256:9-16.
Page 3
Drawing sheet — no readable text.
Page 4
Drawing sheet — no readable text.
Page 5
Drawing sheet — no readable text.
Page 6
Drawing sheet — no readable text.
Page 7
Drawing sheet — no readable text.
Page 8
Drawing sheet — no readable text.
Page 9
Drawing sheet — no readable text.
Page 10
Drawing sheet — no readable text.
Page 11
Drawing sheet — no readable text.
Page 12
Drawing sheet — no readable text.
Page 13
Drawing sheet — no readable text.
Page 14
Drawing sheet — no readable text.
Page 15
Drawing sheet — no readable text.
Page 16
Drawing sheet — no readable text.
Page 17
Drawing sheet — no readable text.
Page 18
Drawing sheet — no readable text.
Page 19
Drawing sheet — no readable text.
Page 20
Drawing sheet — no readable text.
Page 21
Drawing sheet — no readable text.
Page 22
Drawing sheet — no readable text.
Page 23
Drawing sheet — no readable text.
Page 24
Drawing sheet — no readable text.
Page 25
Visible Light Out = Negative Sample
Infrared
Add Antigen
Cooted light
Phosphor B. Optic Phosphor
Target linked
Step 1: Mix Antigen Step 2: Interogate with Coated Phosphors Antibody Cooted Probe Competitive Homogeneous Assay
Page 26
Add Antigen
Emitted Light NO CAPTURE is of Low AT SURFACE intensity
Focal point (high intensity excitation)
Excitation Light of low intensity
CAPTURE AT
Emitted Light SURFACE is of High
Intensity
Focal point (high intensity excitation)
Excitation Light of low intensity
Competitive Homogeneous Antigen Capture Assay
Page 27
Drawing sheet — no readable text.
Page 28
Drawing sheet — no readable text.
Page 29
Drawing sheet — no readable text.
Page 30
Drawing sheet — no readable text.
Page 31
Drawing sheet — no readable text.
Page 32
Drawing sheet — no readable text.
Page 33
FIG 51A
10 x 10 Gridded Array F5 of 980 nm Diode Losers
Aqueous
F5 MZZZZZZZYAS 10 x 10 Gridded Arroy of Photodiode Detectors
Individual
Diode laser
Pulvet PPuvres.
DXXX XXXX-XXX-XXXXC Curler rew
verture
Support Matrix Y Ya s Sample Flow F9
Overlay UsedPolymer as film individual Photodiode
Detector in Array Capture Surface Antibody immund or Nudeic Acid Coniugated Antigen Capture Probe Bonded to
PhoSchor
FIG. 31B
Page 34
Drawing sheet — no readable text.
Page 35
DIODE
LASER
PHOSPHOR
t : PHOTODODE ARRAY
FLOW PATH
COLUMNATED 1
EXCITATION
REGION
REGION
PHOSPHORESCENCE
INTENSITY
DSTANCE ALONG FLOW PATH
FLOW CYTOMETER DISPLAY
LATEX BEADS
(W/O AGENT)
ALARMS
soo PARTICLES
UNEOUND
v PHOSPHORS
PHOSPHORESCENCE
INTENSTY
Page 36
:FORWARDS
;:SCATTERS
FORWARD DETECTORS
SCATTER
DETECTORS
MICROSCOPE
OBJECTIVES
PRESSURE WATER
980 nm LASER
... MERCURY ARC; =3;
;LAMP EMISSION
- MIRRORS N DETECTORS
FLUORESCENCE
: DETECTORS:
BASIC RETROFIT PHOSPHOR
REPORTER ADDITION MODIFICATION
E. BASC FLUORESCENCE-BASED FLOW
CYTOMETER DETECTION DAGRAM
Page 37
:FORWARDS:
SCATER:
:DETECTORS
FORWARD
SCATTER
DETECTORS
MICROSCOPE
OBJECTIVES
F OBJECTIVES
LAMP EMISSION:
PHOSPHORESCENCE
DETECTORS
OCHROC MIRRORS
FLUORESCENCE:
EDETECTORS:
BASIC RETROFIT PHOSPHOR
REPORTER ADDITION MODIFICATION
BASIC FLUORESCENCE-BASED FLOW
CYTOMETER DETECTION DIAGRAM
FIG. 34B
Page 38
UP-CONVERTNG REPORTERS FOR disposal, special licensing requirements, and instability BIOLOGICAL AND OTHER ASSAYS USENG (radioactive decay and radiolysis). Further, the fact that LASER EXCITATION TECHNIQUES radioisotopic labels typically do not produce a strong (i.e.,
CONTINUING DATA
non-Cerenkov) signal in the ultraviolet, infrared, or visible portions of the electromagnetic spectrum makes radioiso
This application is a continuation-in-part of application topes generally unsuitable as labels for applications, such as Ser. No. 08/416,023, filed Mar. 30, 1995; which is a microscopy, image spectroscopy, and flow cytometry, that continuation-in-part of application Ser. No. 08/381,006. employ optical methods for detection. filed Jan. 30, 1995, now abandoned, which is a continuation For these and other reasons, the fields of clinical of application Ser. No. 071946,068. filed Sep. 14, 1992, now 10 chemistry, water and air monitoring, and biomedical abandoned. research have sought alternative detectable labels that do not require radioisotopes. Examples of such non-radioactive
BACKGROUND OF THE INVENTION labels include: (1) enzymes that catalyze conversion of a The invention relates generally to detectable labels and 15 chromogenic substrate to an insoluble, colored product (e.g. compositions useful in assay methods for detecting soluble. alkaline phosphatase. B-galactosidase, horseradish suspended, or particulate substances or analytes such as peroxidase) or catalyze a reaction that yields a fluorescent or proteins, carbohydrates. nucleic acids. bacteria, viruses, and luminescent product (e.g. luciferase) (Beck and Koster eukaryotic cells and more specifically relates to composi (1990) Anal. Chem. 62: 2258: Durrant. I. (1990) Nature 346: tions and methods that include luminescent (phosphorescent 297: Analytical Applications of Bioluminescence and or fluorescent) labels. Chemiluminescence (1984) Kricka et al. (Eds.) Academic Methods for detecting specific macromolecular species. Press, London), and (2) direct fluorescent labels (e.g., fluo such as proteins. drugs. and polynucleotides. have proven to rescein isothiocyanate, rhodamine. Cascade blue). which be very valuable analytical techniques in biology and absorb electromagnetic energy in a particular absorption medicine, particularly for characterizing the molecular com 25 wavelength spectrum and subsequently emit visible light at position of normal and abnormal tissue samples and genetic one or more longer (i.e., less energetic) wavelengths. material. Many different types of such detection methods are Using enzymes and phosphorescent/fluorescent or colo widely used in biomedical research and clinical laboratory rimetric detectable labels offers the significant advantage of medicine. Examples of such detection methods include: signal amplification, since a single enzyme molecule typi immunoassays. immunochemical staining for microscopy, cally has a persistent capacity to catalyze the transformation fluorescence-activated cell sorting (FACS). nucleic acid of a chromogenic substrate into detectable product. With hybridization, water sampling, air sampling, and others. appropriate reaction conditions and incubation time, a single Typically, a detection method employs at least one ana enzyme molecule can produce a large amount of product, lytical reagent that binds to a specific target macromolecular and hence yield considerable signal amplification. However, species and produces a detectable signal. These analytical 35 detection methods that employ enzymes as labels disadvan reagents typically have two components: (1) a probe tageously require additional procedures and reagents in macromolecule, for example. an antibody or order to provide a proper concentration of substrate under oligonucleotide. that can bind a target macromolecule with conditions suitable for the production and detection of the a high degree of specificity and affinity, and (2) a detectable colored product. Further, detection methods that rely on label. such as a radioisotope or covalently-linked fluorescent enzyme labels typically require prolonged time intervals for dye molecule. In general, the binding properties of the probe generating detectable quantities of product, and also gener macromolecule define the specificity of the detection ate an insoluble product that is not attached to the probe method, and the detectability of the associated label deter molecule.
mines the sensitivity of the detection method. The sensitivity An additional disadvantage of enzyme labels is the dif of detection is in turn related to both the type of label 45 ficulty of detecting multiple target species with enzyme employed and the quality and type of equipment available to labeled probes. It is problematic to optimize reaction con detect it. ditions and development time(s) for two or more discrete For example, radioimmunoassays (RIA) have been enzyme label species and, moreover, there is often consid among the most sensitive and specific analytical methods erable spectral overlap in the chromophore endproducts used for detecting and quantitating biological macromol 50 which makes discrimination of the reaction products diffi ecules. Radioimmunoassay techniques have been used to cult.
detect and measure minute quantities of specific analytes, Fluorescent labels do not offer the signal amplification such as polypeptides, drugs. Steroid hormones. advantage of enzyme labels. nonetheless, fluorescent labels polynucleotides, metabolites, and tumor markers, in biologi possess significant advantages which have resulted in their cal samples. Radioimmunoassay methods employ immuno 55 widespread adoption in immunocytochemistry. Fluorescent globulins labeled with one or more radioisotopes as the labels typically are small organic dye molecules, such as analytical reagent. Radiation (O. B. or Y) produced by decay fluorescein, Texas Red, or rhodamine, which can be readily of the attached radioisotope label serves as the signal which conjugated to probe molecules, such as immunoglobulins or can be detected and quantitated by various radiometric Staph. aureus Protein A. The fluorescent molecules methods. (fluorophores) can be detected by illumination with light of Radioisotopic labels possess several advantages, such as: an appropriate excitation frequency and the resultant spec very high sensitivity of detection, very low background tral emissions can be detected by electro-optical sensors or signal, and accurate measurement with precision radiometric light microscopy.
instruments (scintillation and gamma counters) or with A wide variety of fluorescent dyes are available and offer inexpensive and sensitive autoradiographic techniques. 65 a selection of excitation and emission spectra. It is possible However, radioisotopic labels also have several to select fluorophores having emission spectra that are disadvantages, such as: potential health hazards, difficulty in sufficiently different so as to permit multitarget detection and
Page 39
discrimination with multiple probes, wherein each probe (e.g., Azure A) are organic molecules susceptible to pho species is linked to a different fluorophore. Because the tobleaching and undergoing undesirable chemical interac spectra of fluorophores can be discriminated on the basis of tions with other reagents, and (3) emitted radiation is down both narrow band excitation and selective detection of converted , i.e., of longer wavelength(s) than the absorbed emission spectra, two or more distinct target species can be excitation radiation. For example. Azure A absorbs at 632 detected and resolved (Titus et al. (1982) J. Immunol. nm and emits at 645 nm, and allophycocyanin absorbs at 645 Methods 50: 193; Nederlof et al. (1989) Cytometry 10:20; nm and emits at 655 nm, and therefore autofluorescence and Ploem, J. S. (1971) Ann. NY Acad. Sci. 177: 414). background noise from scattered excitation light is not Unfortunately, detection methods which employ fluores eliminated.
cent labels are of limited sensitivity for a variety of reasons. 10 Another alternative class of fluorophore that has been First, with conventional fluorophores it is difficult to dis proposed are the down-converting luminescent lanthanide criminate specific fluorescent signals from nonspecific back chelates (Soini and Lovgren (1987) CRC Crit. Rey. Anal. ground signals. Most common fluorophores are aromatic Chem. 18: 105: Leif et al. (1977) Clin. Chem. 23: 1492; organic molecules which have broad absorption and emis Soini and Hemmila (1979) Clin. Chem. 25: 353; Seveus et sion spectra, with the emission maximum red-shifted 15 al. (1992) Cytometry 13: 329). Down-converting lanthanide 50-100 nm to a longer wavelength than the excitation (i.e., chelates are inorganic phosphors which possess a large absorption) wavelength. Typically, both the absorption and downward Stokes shift (i.e., emission maxima is typically at emission bands are located in the UV/visible portion of the least 100 nm greater than absorption maxima) which aids in spectrum. Further, the lifetime of the fluorescence emission the discrimination of signal from scattered excitation light. is usually short, on the order of 1 to 100 ns. Unfortunately, Lanthanide phosphors possess emission lifetimes that are these general characteristics of organic dye fluorescence are sufficiently long (i.e. greater than 1 us) to permit their use also applicable to background signals which are contributed in time-gated detection methods which can reduce. but not by other reagents (e.g., fixative or serum), or autofluores totally eliminate, noise caused by shorter-lived autofluores cence or the sample itself (Jongkind et al. (1982) Exp. Cell cence and scattered excitation light. Further, lanthanide Res. 138.: 409; Aubin. J. E. (1979).J. Histochem. Cytochem. 25 phosphors possess narrow-band emission. which facilitates 27:36). Autofluorescence of optical lenses and reflected wavelength discrimination against background noise and excitation light are additional sources of background noise scattered excitation light, particularly when a laser excita in the visible spectrum (Beverloo et al. (1991) Cytometry 11: tion source is utilized (Reichstein et al. (1988) Anal. Chem. 784: Beverloo et al. (1992). Cytometry 13:561). Therefore. 60: 1069). Recently, enzyme-amplified lanthanide lumines the limit of detection of specific fluorescent signal from 30 cence using down-converting lanthanide chelates has been typical fluorophores is limited by the significant background proposed as a fluorescent labeling technique (Evangelista et noise contributed by nonspecific fluorescence and reflected al. (1991) Anal. Biochem. 197: 213; Gudgin-Templeton et al. excitation light. (1991) Clin Chem. 37: 1506). A second problem of organic dye fluorophores that limits Until recently, down-converting lanthanide phosphors sensitivity is photolytic decomposition of the dye molecule 35 have had the significant disadvantage that their quantum (i.e. photobleaching). Thus, even in situations where back efficiency in aqueous (oxygenated) solutions is so low as to ground noise is relatively low, it is often not possible to render them unsuitable for cytochemical staining. Beverloo integrate a weak fluorescent signal over a long detection et al. (op.cit.) have described a particular down-converting time, since the dye molecules decompose as a function of lanthanide phosphor (yttrium oxysulfide activated with incident irradiation in the UV and near-UV bands. 40 europium) that produces a signal in aqueous solutions which However, because fluorescent labels are attractive for can be detected by time-resolved methods. Seveus et al. various applications, several alternative fluorophores having (op.cit.) have used down-converting europium chelates in advantageous properties for sensitive detection have been conjunction with time-resolved fluorescence microscopy to proposed. One approach has been to employ organic dyes reject the signal from prompt fluorescence and thereby comprising a phycobiliprotein acceptor molecule dye that 45 reduce autofluorescence. Tanke et al. (U.S. Pat. No. 5,043. emits in the far red or near infrared region of the spectrum 265) report down-converting phosphor particles as labels for where nonspecific fluorescent noise is reduced. Phycobilip immunoglobulins and polynucleotides.
roteins are used in conjunction with accessory molecules However, the down-converting lanthanide phosphor of that effect a large Stokes shift via energy transfer mecha Beverloo et al. and the europium chelate of Seveus et al. nisms (U.S. Pat. No. 4,666,862; Oi et al. (1982) J. Cell. Biol. 50 require excitation wavelength maxima that are in the ultra 93: 891). Phycobiliprotein labels reduce the degree of spec violet range, and thus produce significant sample autofluo tral overlap between excitation frequencies and emission rescence and background noise (e.g. serum and/or fixative frequencies. An alternative approach has been to use cyanine fluorescence, excitation light scattering and refraction, etc.) dyes which absorb in the yellow or red region and emit in the that must be rejected (e.g., by filters or time-gated signal red or far red where autofluorescence is reduced (Mujumbar 55 rejection). Further, excitation with ultraviolet irradiation et al. (1989) Cytometry 10: 11). damages nucleic acids and other biological macromolecules. However, with both the phycobiliproteins and the cyanine posing serious problems for immunocytochemical applica dyes the emission frequencies are red-shifted (i.e., frequency tions where it is desirable to preserve the viability of living downshifted) and emission lifetimes are short, therefore cells and retain cellular structures (e.g., FACS, cyto background autofluorescence is not completely eliminated architectural microscopy).
as a noise source. More importantly perhaps, phycobilipro Laser scanning fluorescence microscopy has been used teins and cyanine dyes possess several distinct disadvan for two-photon excitation of a UV-excitable fluorescent tages: (1) emission in the red, far red, and near infrared organic dye, Hoechst 33258, using a stream of strongly region is not well-suited for detection by the human eye, focused laser pulses (Denk et al. (1990) Science 248: 73). hampering the use of phycobiliprotein and cyanine labels in 65 The organic fluorphore used by Denk et al. was significantly optical fluorescence microscopy, (2) cyanines. photobleached by the intense, highly focused laser light phycobiliproteins, and the coupled accessory molecules during the course of imaging. Motsenbocker et al. (EP 476
Page 40
556) describes a method to increase luminol chemilumines The laser light is preferably focused to a small region in the cence by adding a dye catalyst that absorbs long wavelength sample, and light emanating from that region is collected radiation (deep red light) and subsequently reacts with and directed to the detector. An electrical signal representing molecular oxygen to generate an oxidant which can itself the intensity of light in the emission band provides a react with luminol and produce oxidized luminol which 5 measure of the amount of reporter present. Depending on the emits blue light. Gavrilovic (U.S. Pat. No. 5.166,948) dis detector's spectral response, it may be necessary to provide closes a method and apparatus for optical pumping of a filter to block the excitation light.
infrared pump light to a visible or ultraviolet emision light Simultaneous detection of multiple reporters is possible, having a wavelength shorter than the pump light (i.e., at least where the reporters have different excitation bands or different emission bands. Where the excitation bands differ, up-converted emisison). Xu et al. (1995).J. Phys. Chem.99: O multiple laser diodes emitting at respective appropriate 4447 reports up-conversion emission from Er-doped sol wavelengths are combined using a wavelength division gel silica glasses. multiplexer or other suitable techniques, such as frequency Thus, there exists a significant need in the art for labels labeling, frequency modulation, and lock-in detector device. and detection methods that permit sensitive optical and/or If the emission bands are different (whether or not the spectroscopic detection of specific label signal(s) with 15 excitation bands are different), light in the different emission essentially total rejection of nonspecific background noise. bands is separated and sent to multiple detectors. If the and which are compatible with intact viable cells and emission bands overlap. a single detector may be used, but aqueous or airborne environments. other detection techniques are used. One example is to use The references discussed herein are provided solely for 20 time multiplexing techniques so that only one reporter is their disclosure prior to the filing date of the present appli emitting at a given time. Alternatively, the different laser cation. Nothing herein is to be construed as an admission diodes can be modulated at different characteristic frequen that the inventors are not entitled to antedate such disclosure cies and lock-in detection performed. by virtue of prior invention. Detection methods and detection apparatus of the present invention enable the ultrasensitive detection of
SUMMARY OF THE INVENTION 25 up-converting phosphors and up-converting organic dyes by exploiting what is essentially the total absence of back
The present invention provides labels, detection methods, ground noise (e.g., autofluorescence, serum/fixative and detection apparatus which permit ultrasensitive detec fluorescence, excitation light scatter) that are advantageous tion of cells, biological macromolecules, and other analytes. characteristics of up-converting labels. Some embodiments which can be used for multiple target detection and target 30 of the invention utilize time-gated detection and/or discrimination. The up-converting labels of the invention wavelength-gated detection for optimizing detection permit essentially total rejection of non-specific background sensitivity, discriminating multiple samples, and/or detect autofluorescence and are characterized by excitation and ing multiple probes on a single sample. Phase-sensitive emitted wavelengths that are typically in the infrared or detection can also be used to provide discrimination between visible portions of the spectrum, respectively, and thus avoid 35 signal(s) attributable to an up-converting phosphor and the potentially damaging effects of ultraviolet radiation. The background noise (e.g. autofluorescence) which has a dif up-converting labels of the invention convert long ferent phase shift.
wavelength excitation radiation (e.g. near-IR) to emitted alsoUp-converting organic dyes, such as red-absorbing dyes. can be used in an alternate embodiment that converts radiation at about one-half to one-third the wavelength of the the photons absorbed by the dye into a transient voltage that excitation wavelength. Since background fluorescence in the visible range is negligible if near-IR excitation wavelengths can be measured using electrodes and conventional elec tronic circuitry. After having undergone two-photon absorp are used, the use of up-converting labels provides essentially tion the dye is ionized by additional photons from the light background-free detection of signal. source (e.g. a laser) leading to short-lived molecular ions In brief, the invention provides the use of luminescent whose presence can be detected and quantified by measuring materials that are capable of multiphoton excitation and 45 the transient photoconductivity following the excitation irra have upshifted emission spectra. In one embodiment of the diation. In this embodiment, resonant multiphoton ioniza invention, up-converting phosphors (i.e., which absorb mul tion is used to provide a quantitative measurement of the tiple photons in a low frequency band and emit in a higher number and/or concentration of dye molecules in a sample. frequency band) are used as labels which can be linked to Furthermore, essentially all photoions formed in the irradi one or more probes, such as an immunoglobulin. 50 ated sample contribute to the signal, whereas photons are polynucleotide, streptavidin, Protein A. receptor ligand, or emitted isotropically and only a fraction can be collected other probe molecule. In an another embodiment. using optics. Measurement of the transient photocurrent up-converting organic dyes serve as the label. The organic effectively transfers the conversion of photons into an elec dye labels and phosphor labels of the invention are highly tronic signal that is readily measured with relatively simple compatible with automated diagnostic testing, microscopic 55 and inexpensive sensors such as electrodes. imaging applications, and coded particle detection, among In some embodiments, the present invention utilizes one many other applications. or more optical laser sources for generating excitation The nature of the invention provides considerable flex illumination of one or more discrete frequency(ies). In ibility in the apparatus for carrying out the methods. As a certain variations of the invention, laser irradiation of an general matter, the excitation source may be any convenient up-converting label can modify the immediate molecular light source, including inexpensive near-infrared laser environment through laser-induced photochemical pro diodes or light-emitting diodes (LEDs), and the detector cesses involving either direct absorption or energy transfer; may be any convenient detector, such as a photodiode. In the such spatially-controlled deposition of energy can be used to case of a single reporter, the apparatus includes a laser diode produce localized damage and/or to probe the chemical capable of emitting light at one or more wavelengths in the 65 environment of a defined location. In such embodiments, the reporter's excitation band and a detector that is sensitive to up-converting label can preferably act as a photophysical at least some wavelengths in the reporter's emission band. catalyst.
Page 41
The invention provides methods for producing targeted performing fluorescence-activated cell sorting (FACS) by damage (e.g., catalysis) in chemical or biological materials, flow cytometry using excitation radiation that is in the wherein a probe is employed to localize a linked infrared portion of the spectrum and does not significantly up-converting label to a position near a targeted biological damage cells. This provides a significant advantage over structure that is bound by the probe. The localized 5 present FACS methods which rely on excitation illumination up-converting label is excited by one or more excitation in the ultraviolet portion of the spectrum, including wave wavelengths and emit at a shorter wavelength which may be lengths which are known to produce DNA lesions and directly cytotoxic or genotoxic (e.g., by producing free damage cells.
radicals such as superoxide, and/or by generating thymine The invention also provides compositions comprising at thymine dimers), or which may induce a local photolytic least one fluorescent organic dye molecule attached to an chemical reaction to produce reactive chemical species in inorganic up-converting phosphor. The fluorescent organic the immediate vicinity of the label, and hence in the vicinity dye molecule is selected from the group consisting of: of the targeted biological material. Thus, targeting probes rhodamines. cyanines, xanthenes, acridines, oxazines.
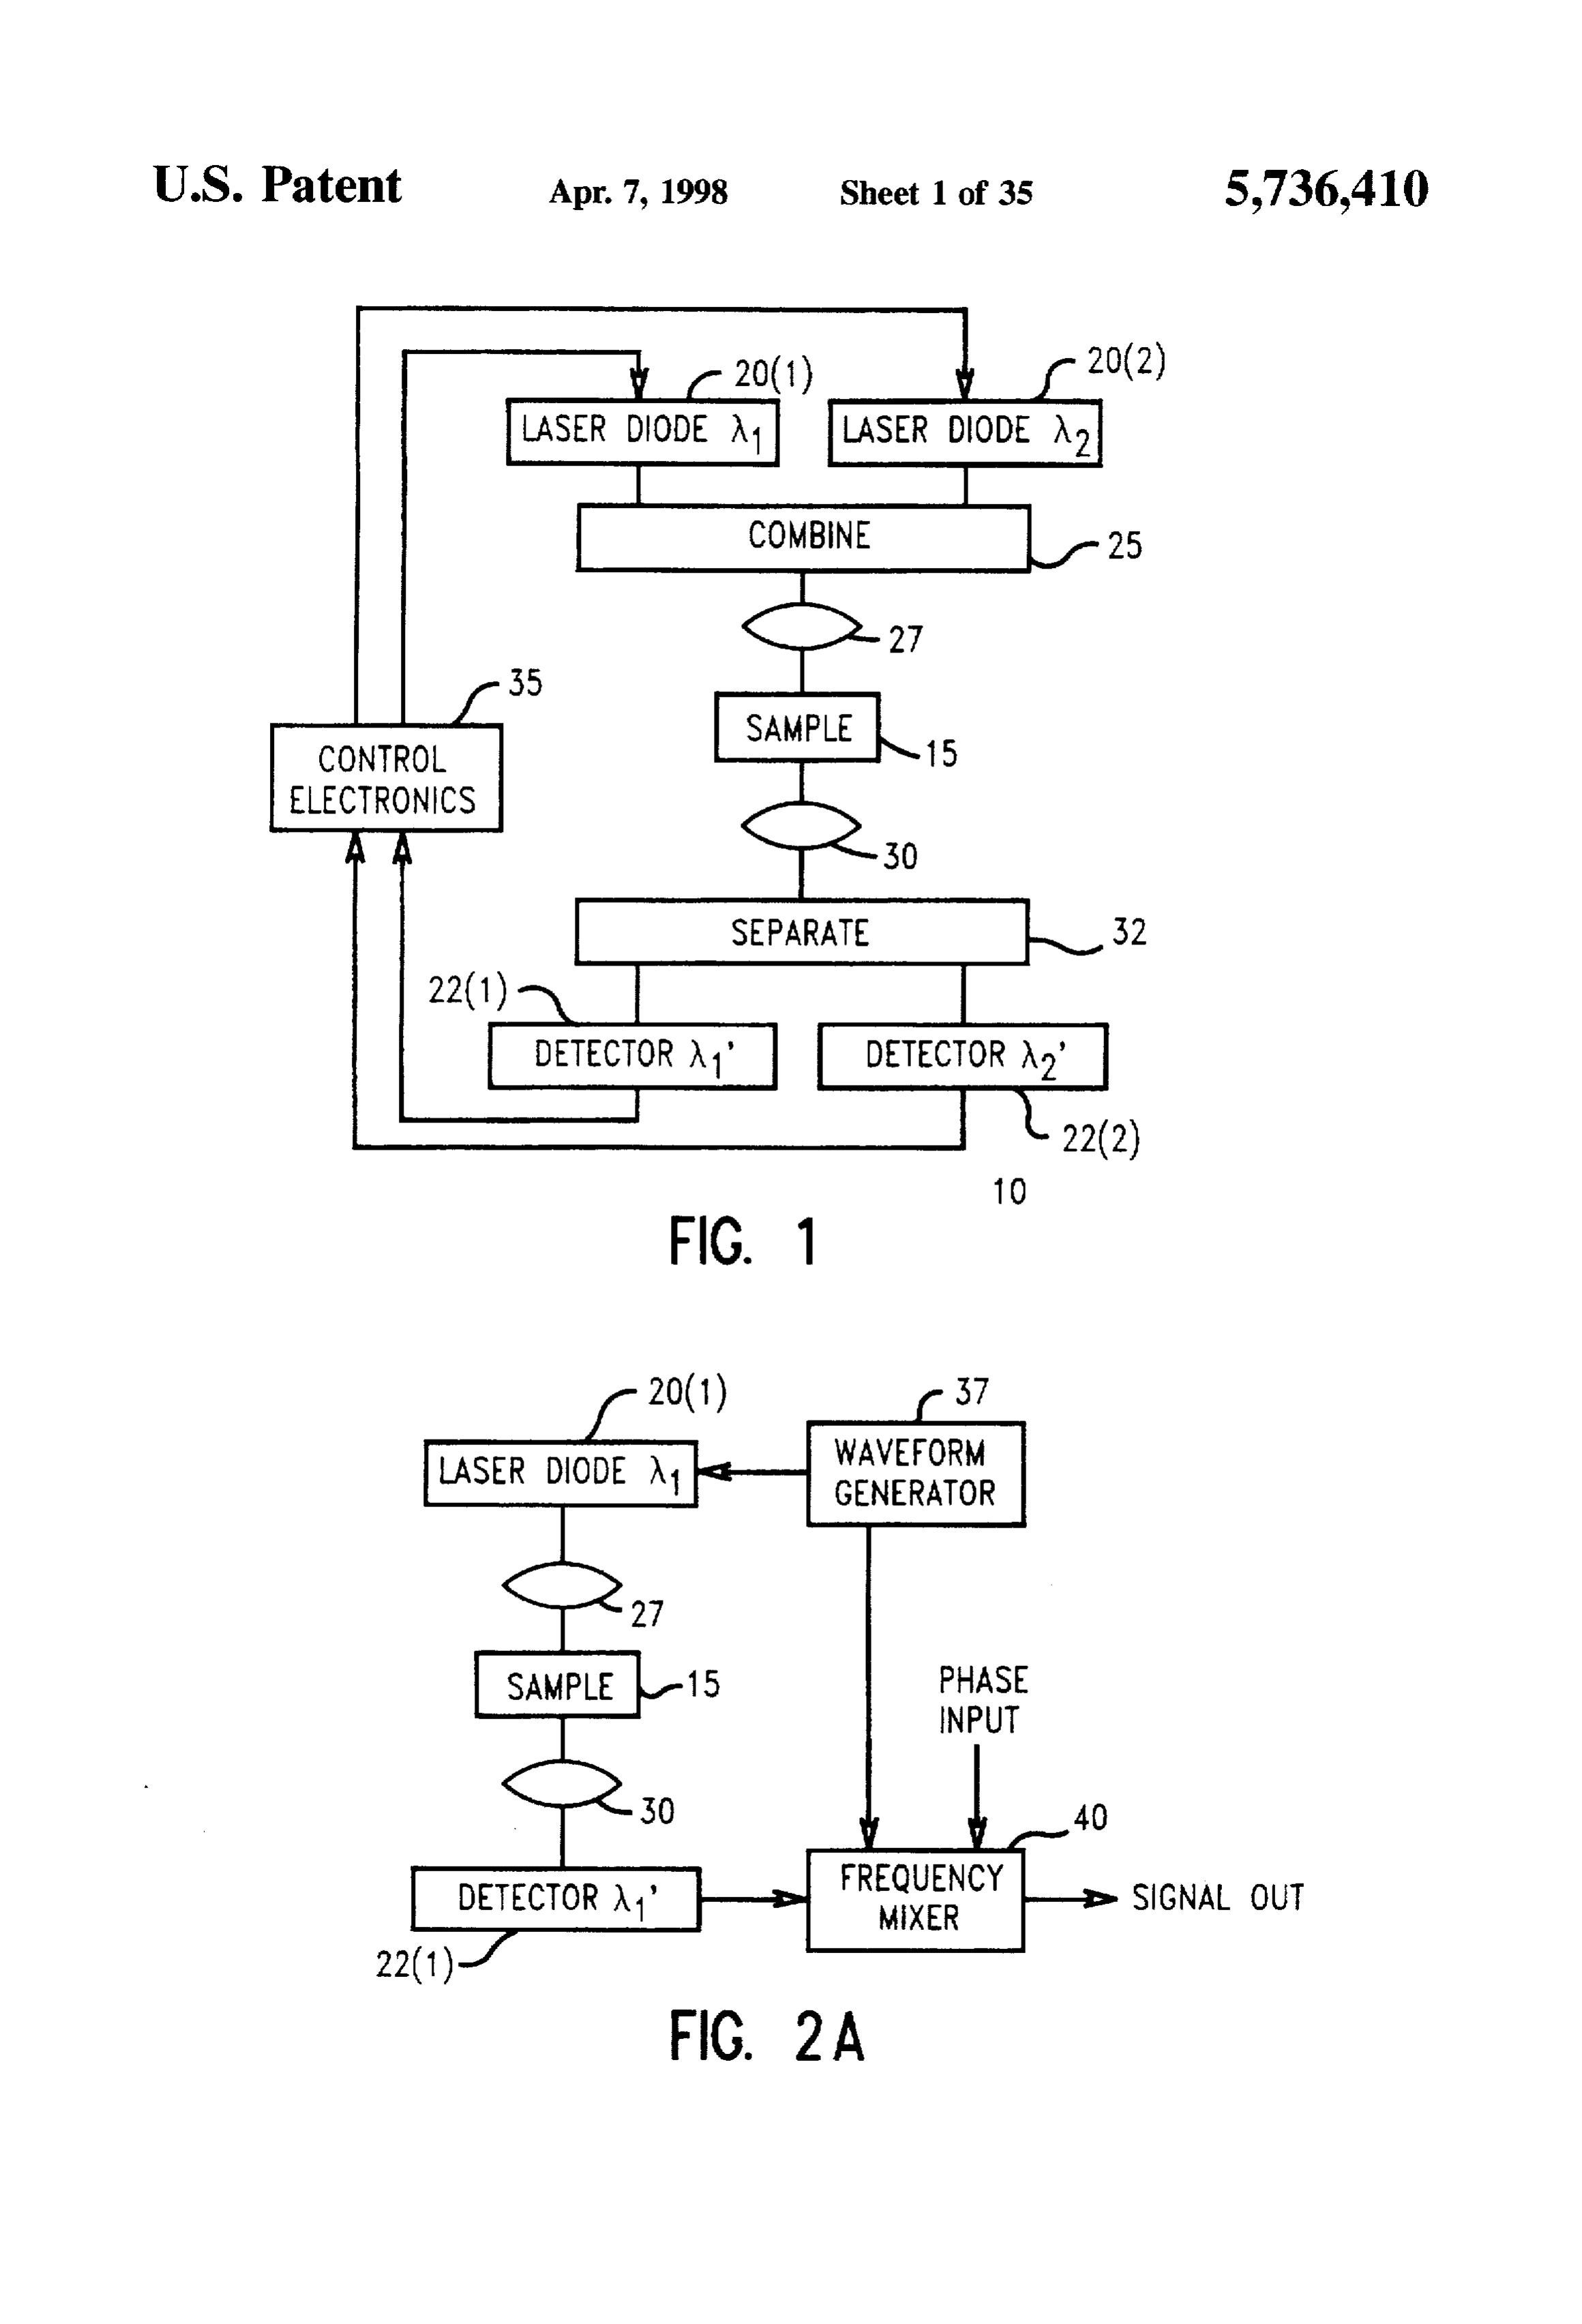
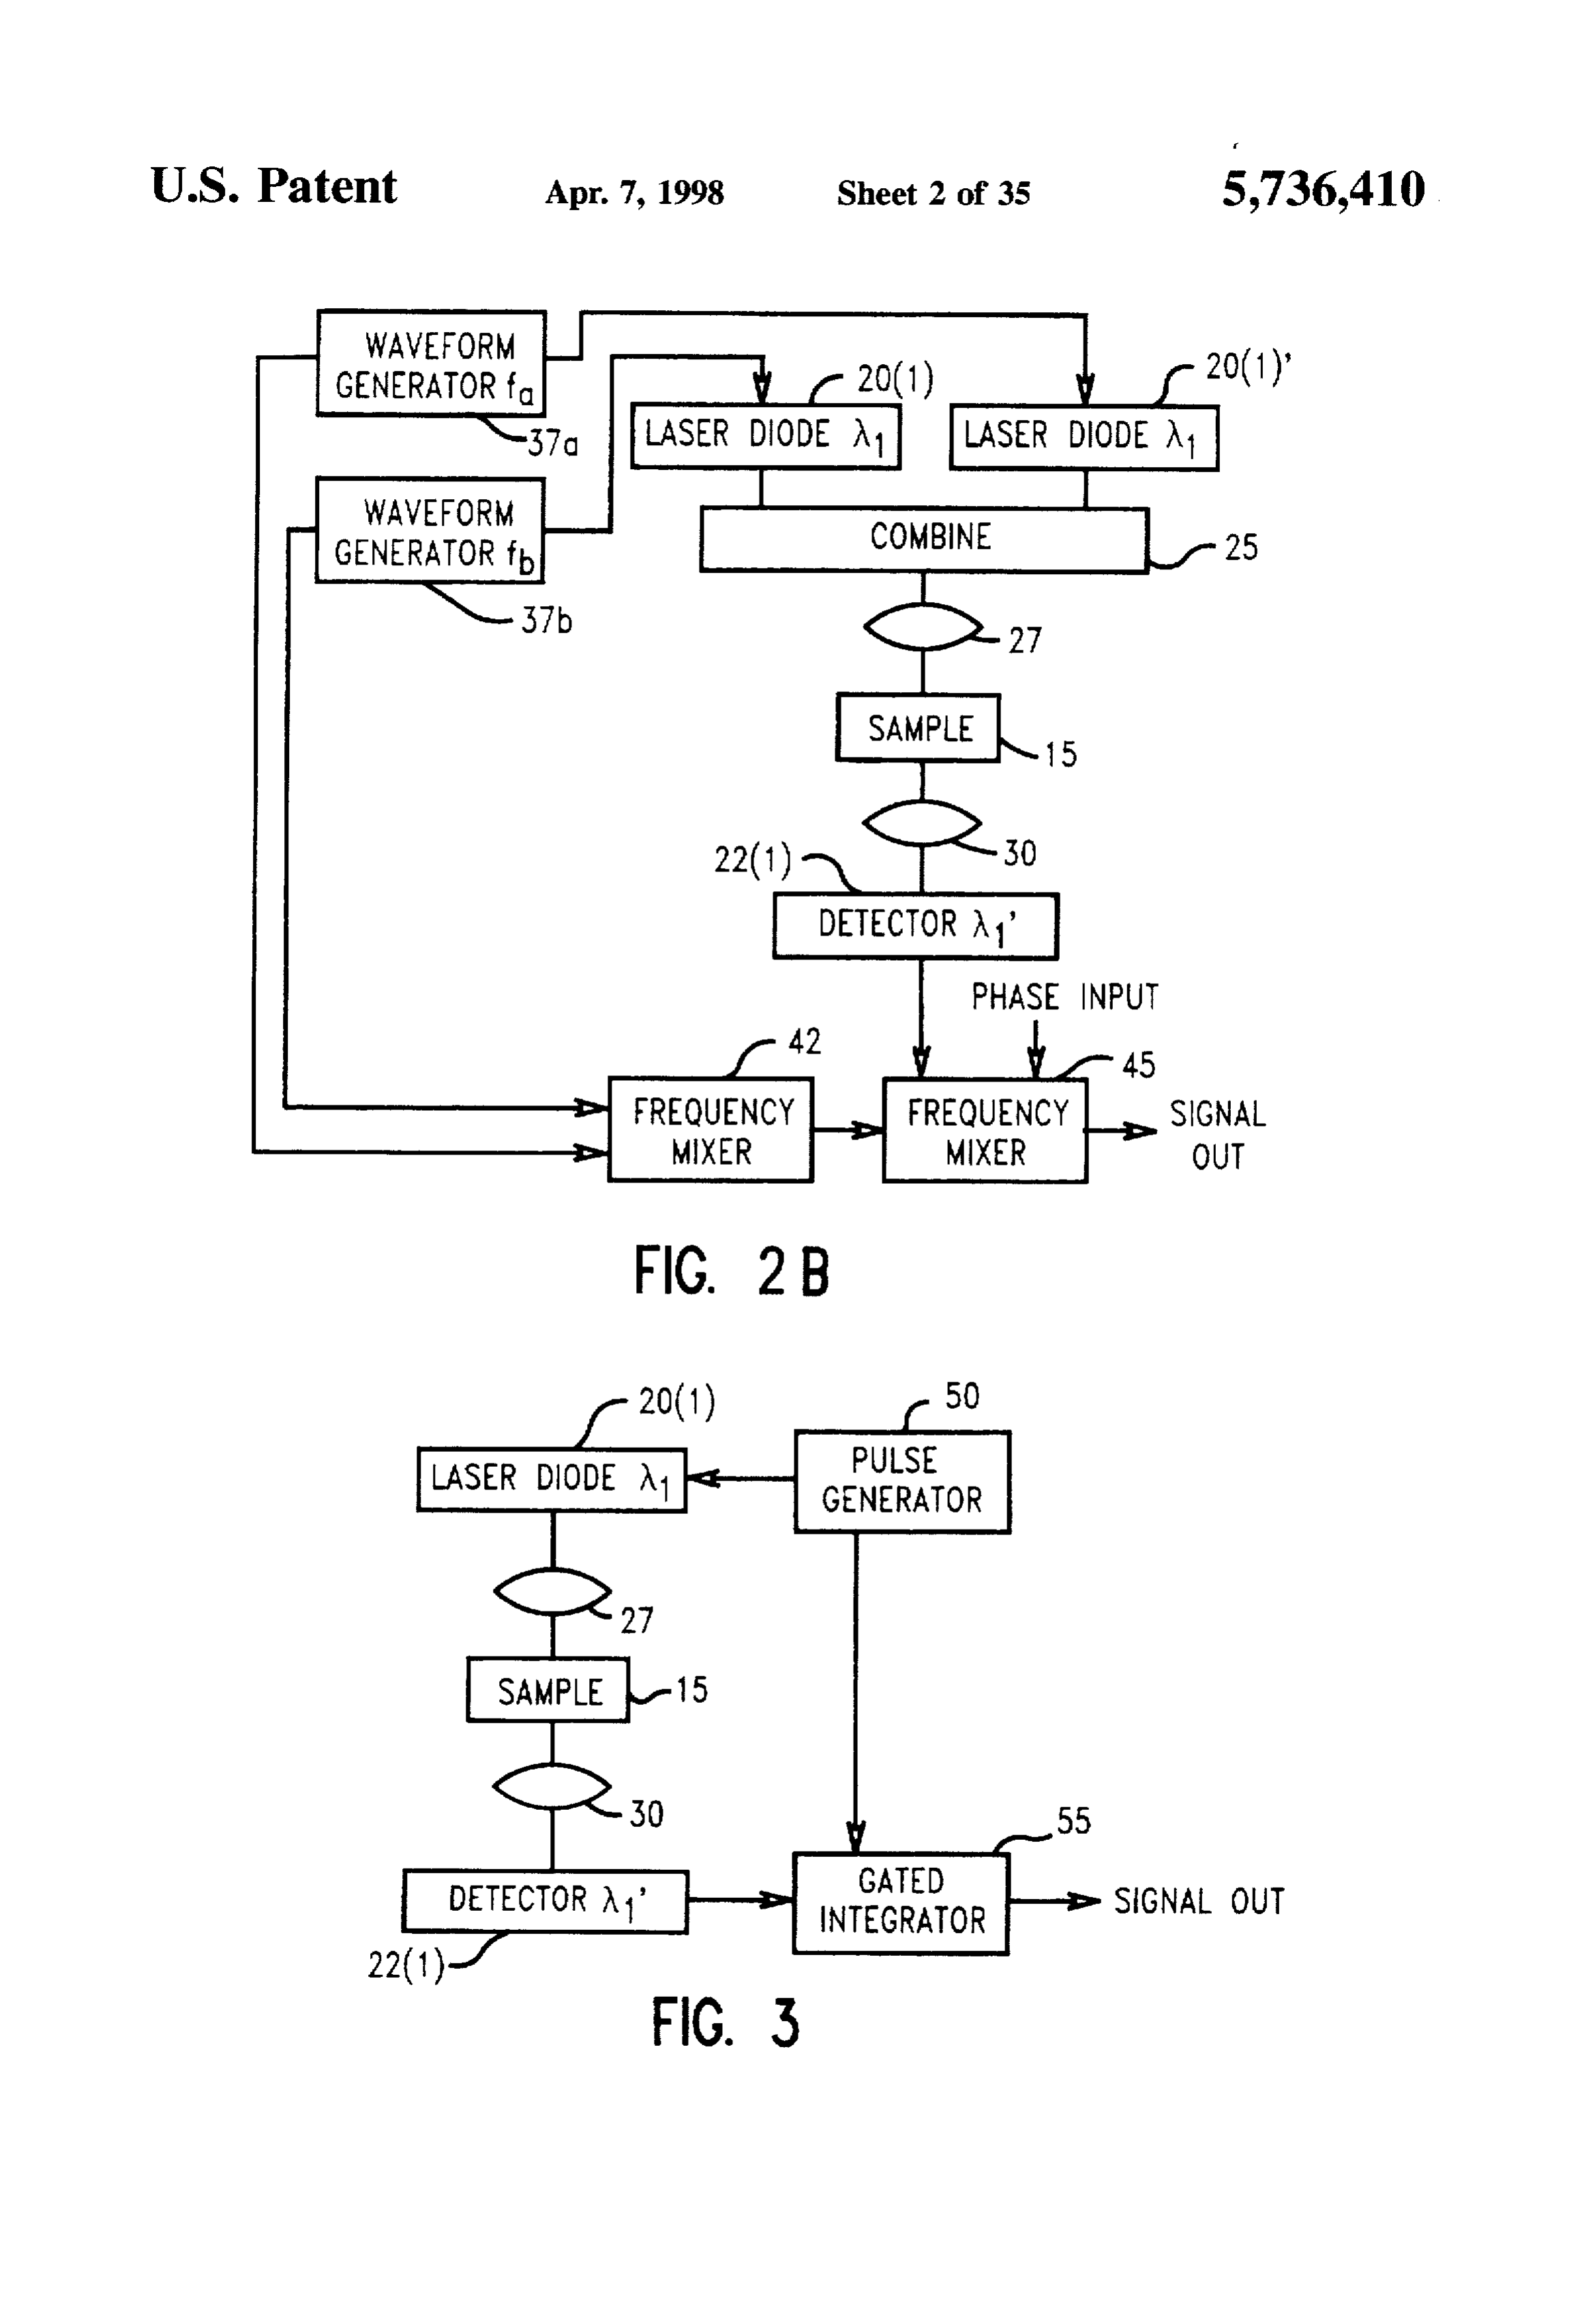
labeled with one or more up-converting labels (e.g., an porphyrins, up-converting inorganic phosphor) may be used to produce and phthalocyanines, and may optionally be targeted damage to biological structures, such as cells, 5 complexed with a heavy metal. The fluorescent organic dye tissues. neoplasms, vasculature, or other anatomical or his may be adsorbed to the inorganic up-converting phosphor tological structures. crystal and/or may be covalently attached to a coated Embodiments of the present invention also include inorganic up-converting phosphor, a derivatized vitrocer up-converting phosphors which can also be excited by an amic up-converting phosphor, or a microencapsulated inor electron beam or other beam of energetic radiation of 20 ganic up-converting phosphor. Frequently, covalent conju sufficient energy and are cathodoluminescent. Such gation between the up-converting inorganic phosphor electron-stimulated labels afford novel advantages in elimi particles and proteins (e.g. avidin, immunoglobulin) can be nating background in ultrasensitive biomolecule detection accomplished with heterobifunctional crosslinkers. methods. Typically, stimulation of the up-converting phos phor with at least two electrons is employed to generate a 25 BRIEF DESCRIPTION OF THE DRAWINGS visible-light or UV band emission. FIG. 1 is an optical and electronic block diagram illus The invention also provides for the simultaneous detec trating representative apparatus for performing diagnostics tion of multiple target species by exploiting the multiphoton on a sample according to the present invention. excitation and subsequent background-free fluorescence detection of several up-converting phgsphors or 30 tiveFIG. 2A shows apparatus for implementing phase sensi detection in the context of a single channel;
up-converting dyes. In one embodiment, several phosphors/ FIG. 2B shows apparatus where first and second laser dyes are selected which have overlapping absorption bands diodes are modulated by signals from waveform generators; which allow simultaneous excitation at one wavelength (or FIG. 3 shows apparatus for performing gated detection: in a narrow bandwidth), but which vary in emission char acteristics such that each probe-label species is endowed 35 FIG. 4 shows an apparatus for performing diagnostics on with a distinguishable fluorescent "fingerprint." By using a sample using first and second reporters excitation bands various methods and devices, the presence and concentra centered at 1 and 2. respectively, and having overlapping tion of each of the phosphors or dyes can be determined. emission bands near Wa:
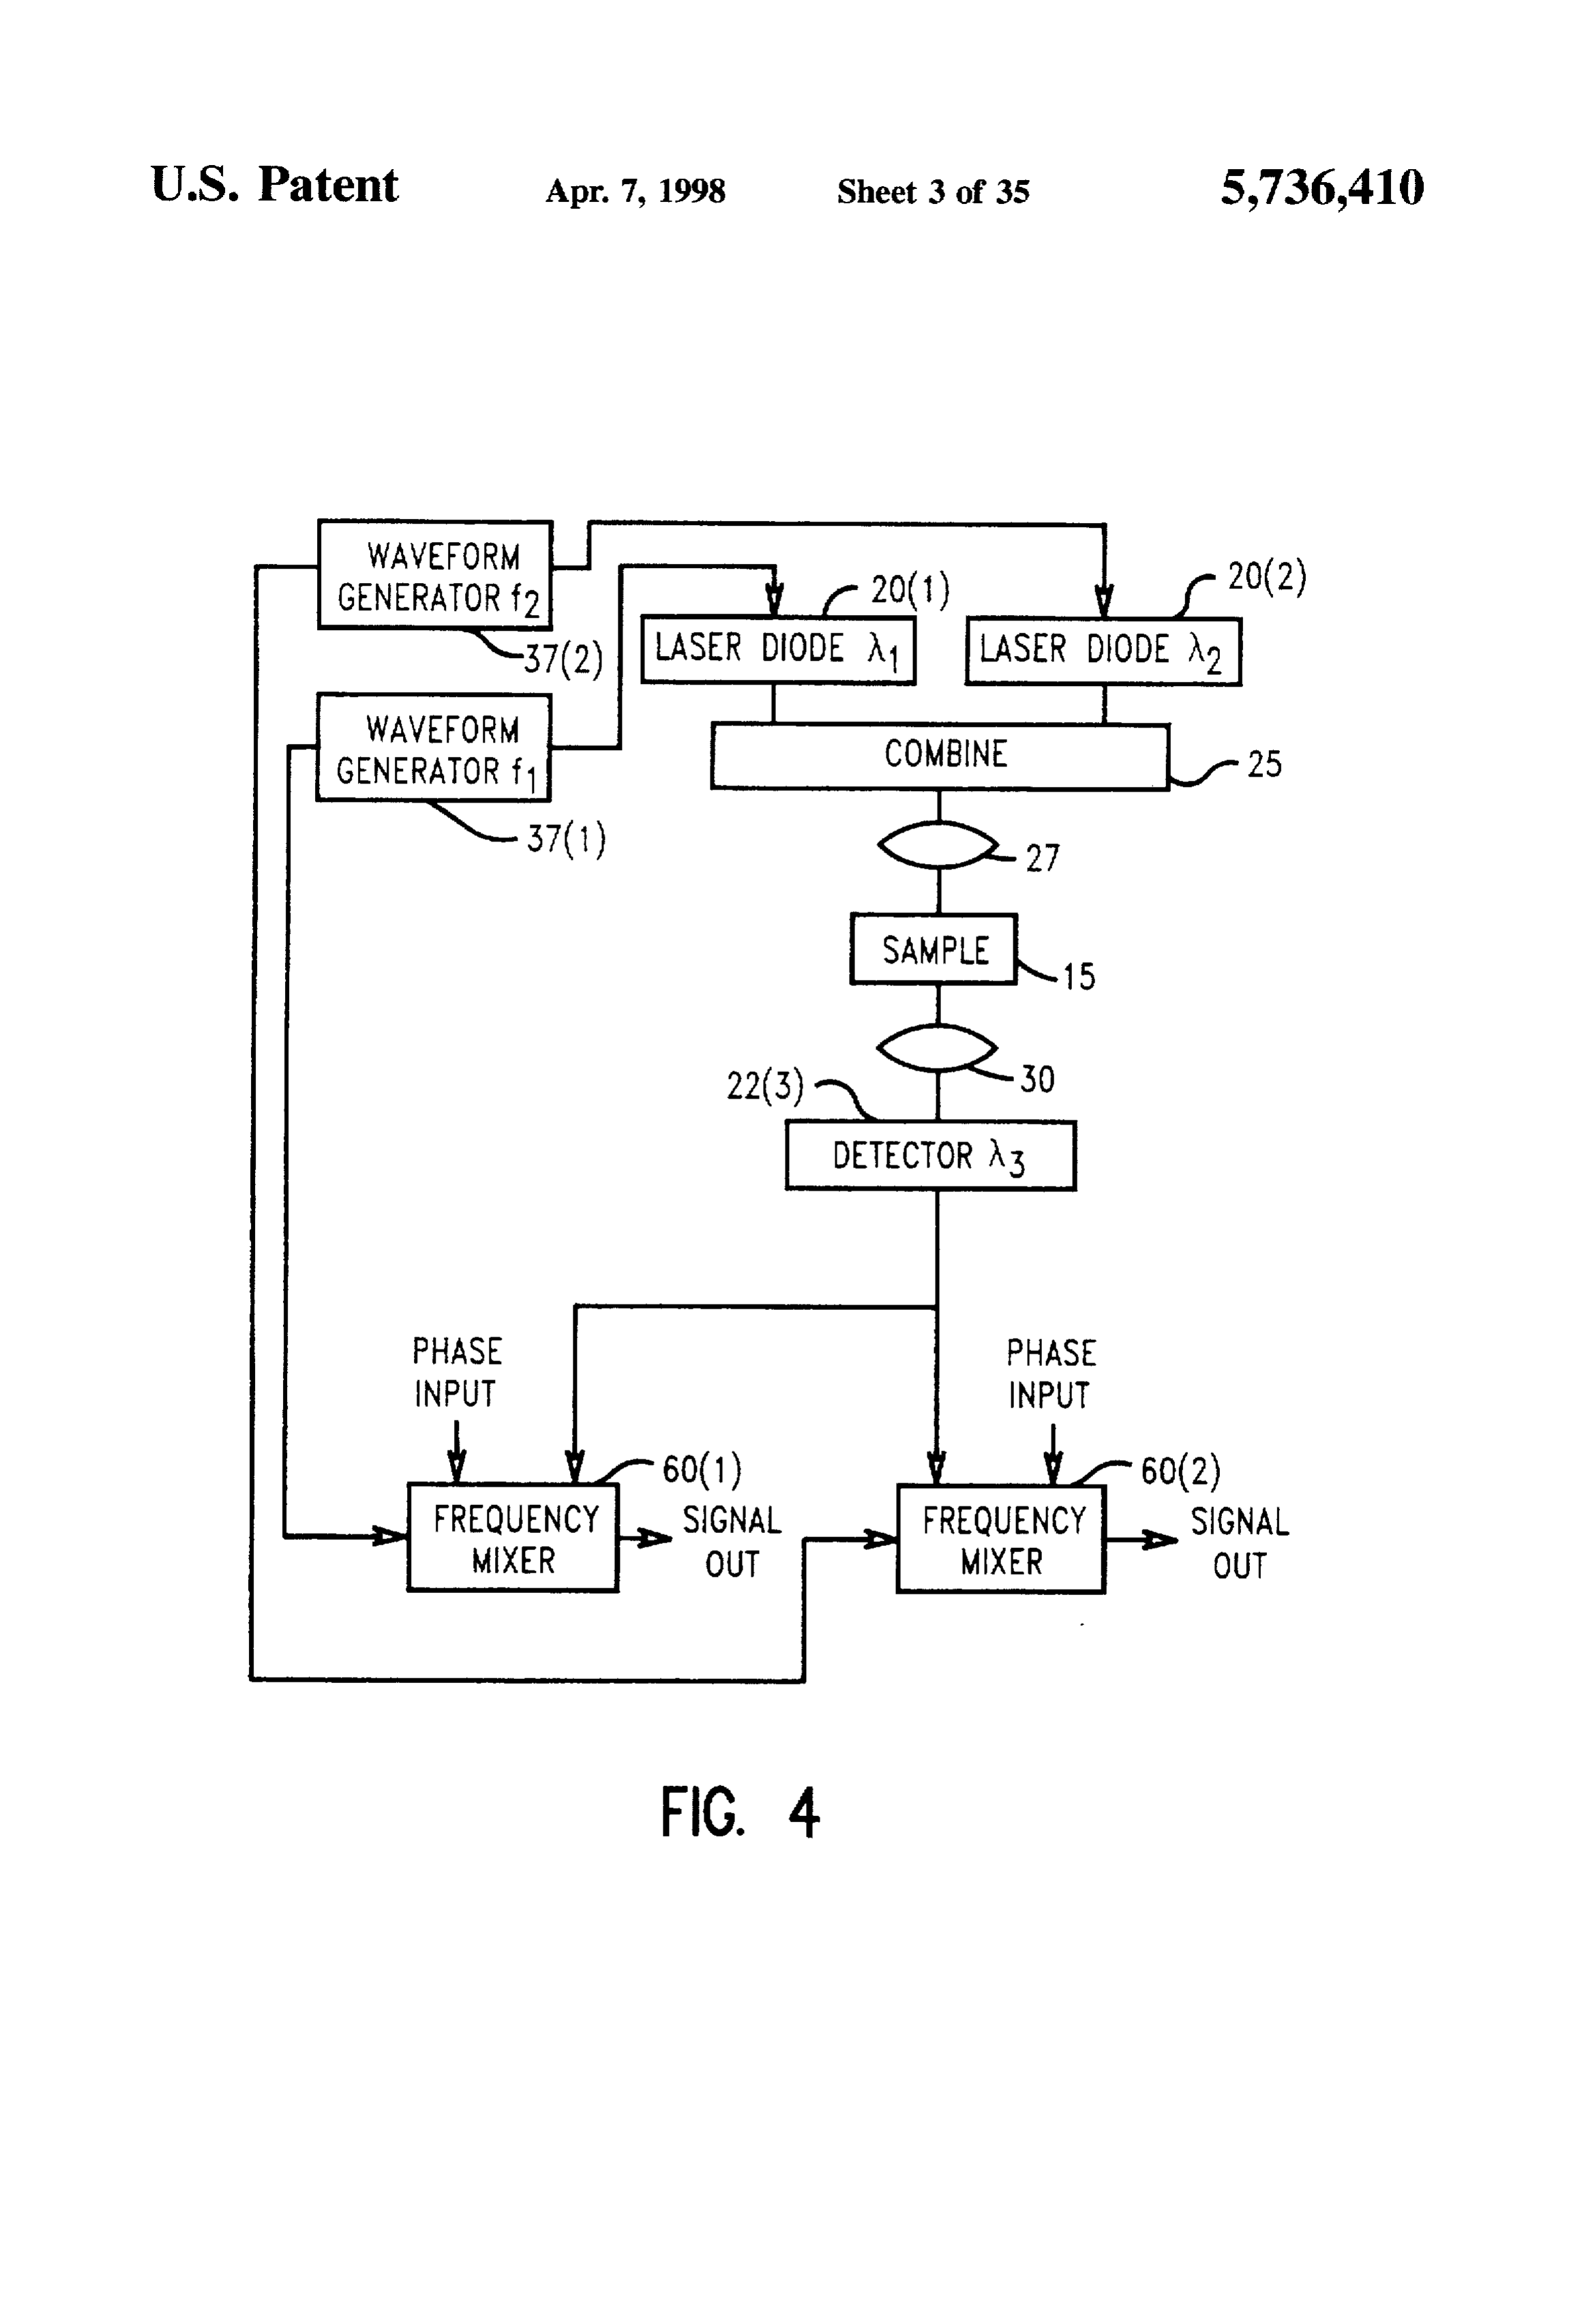
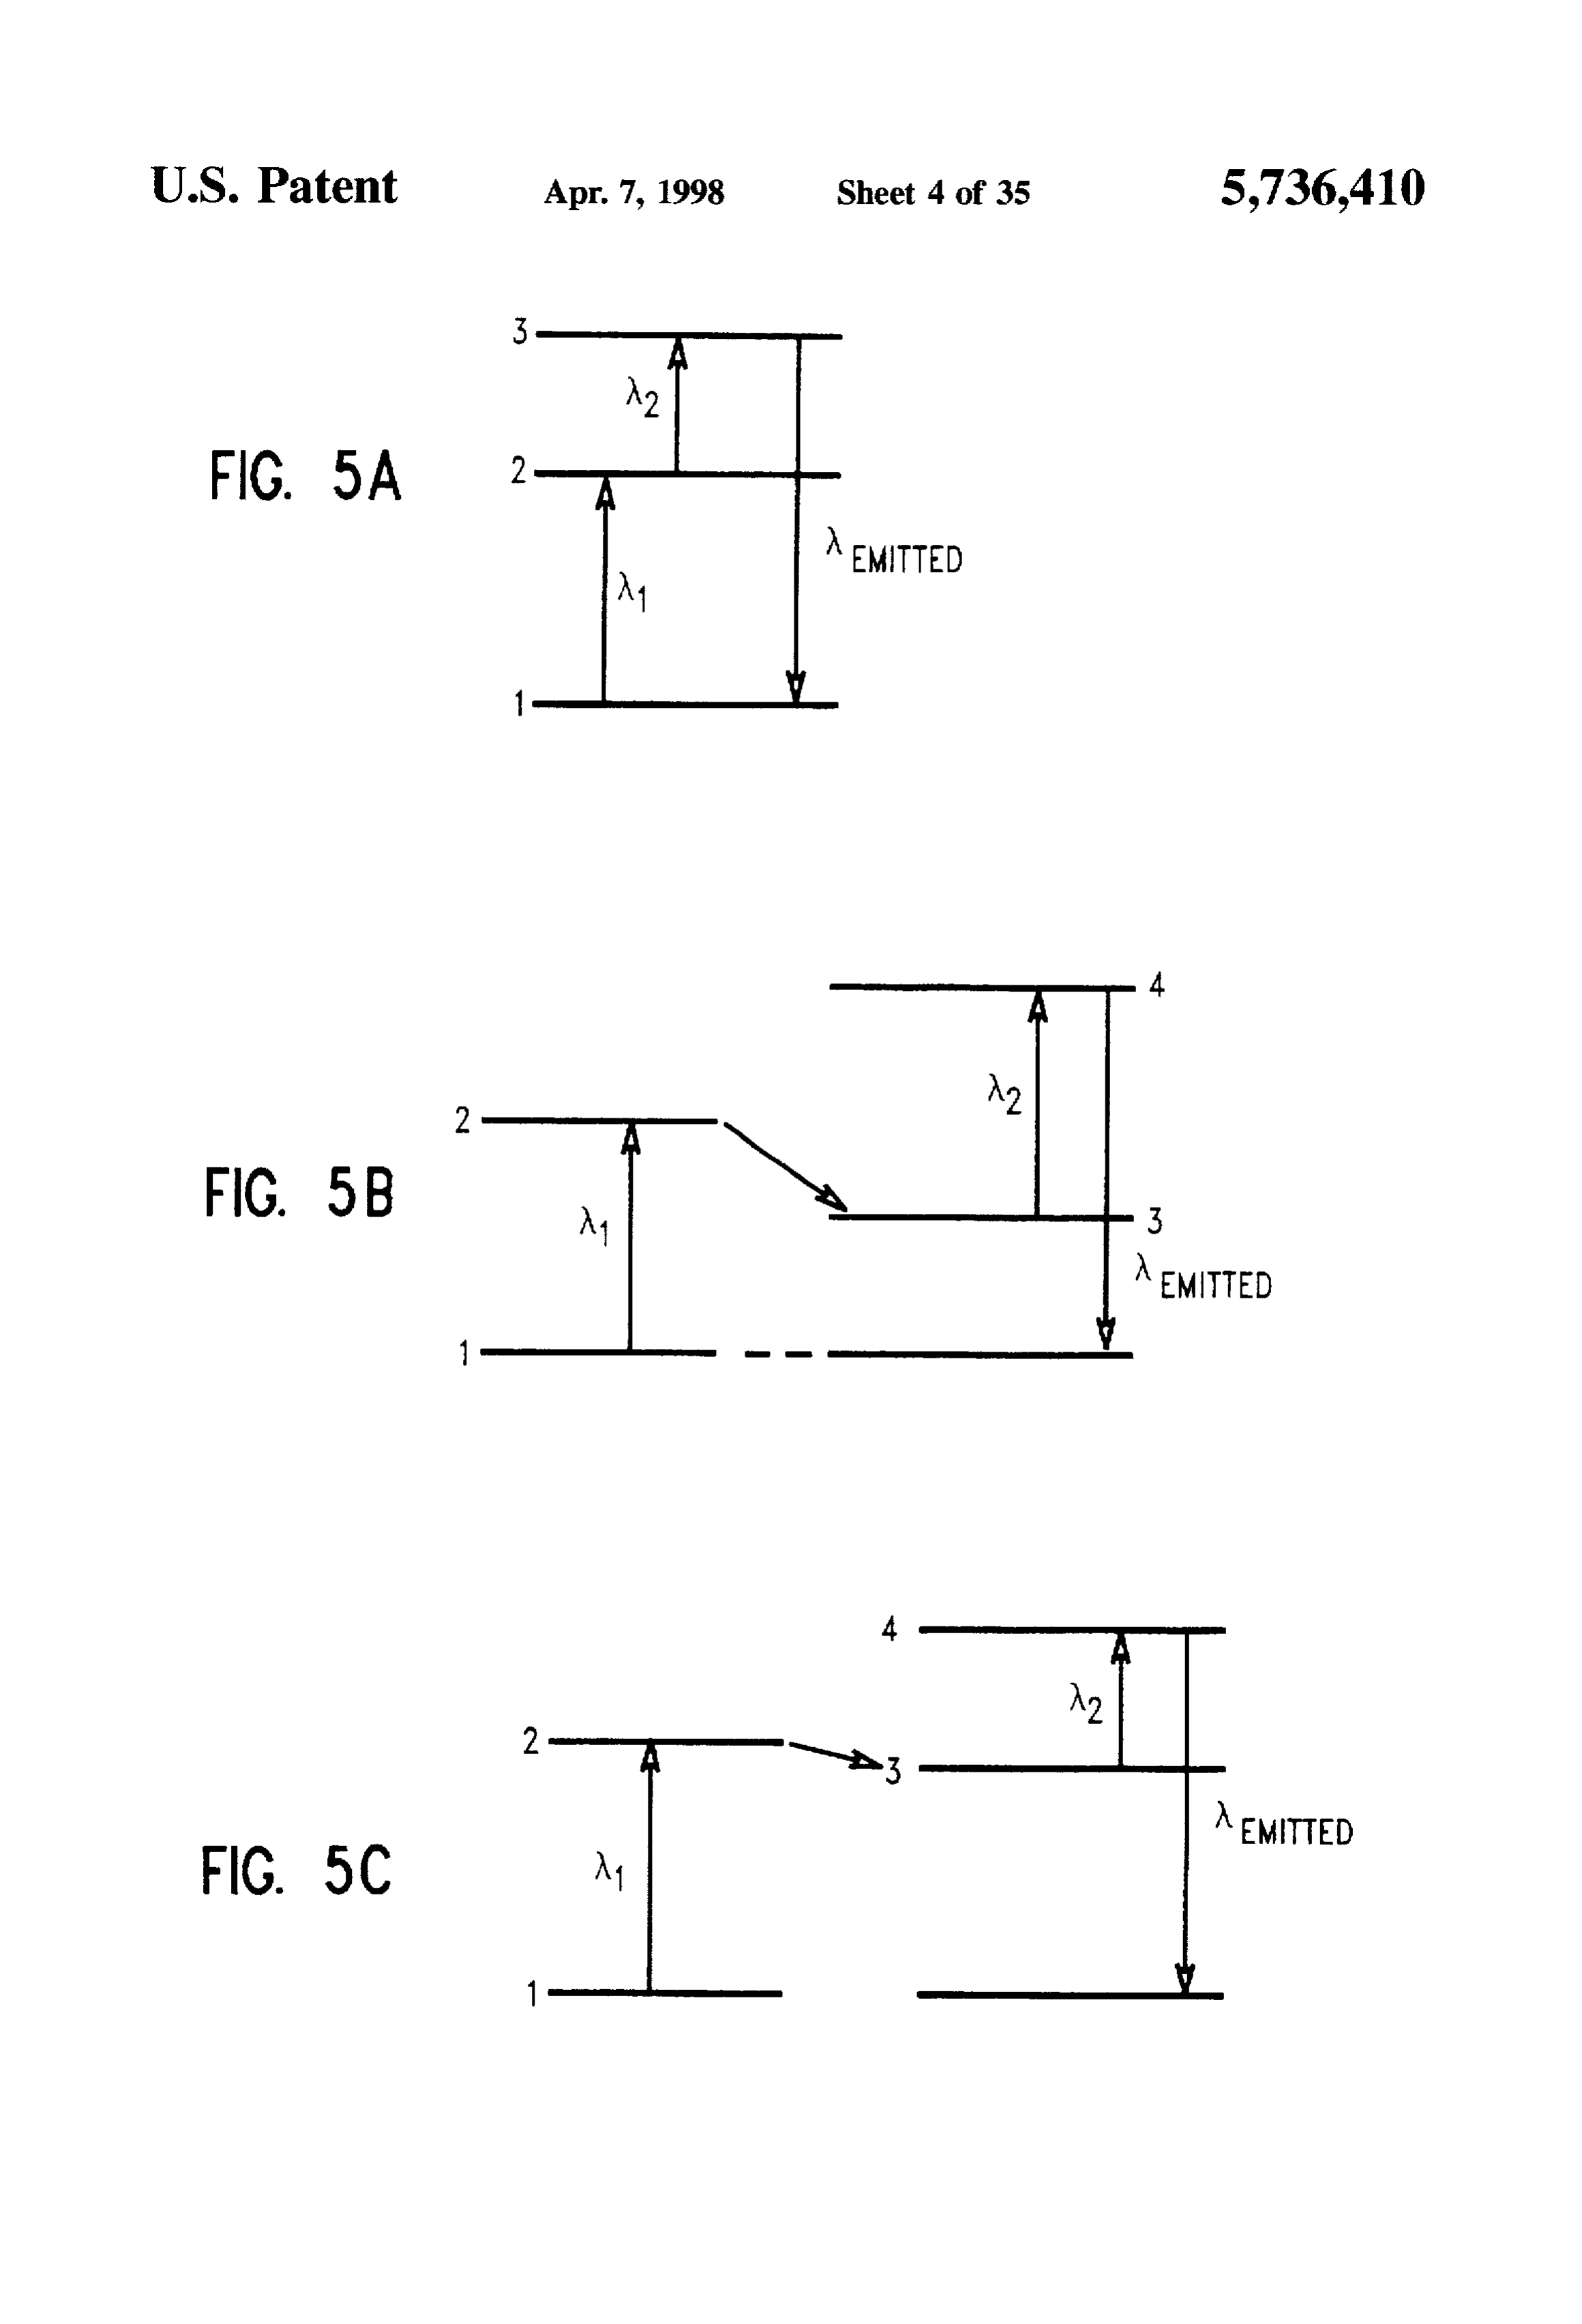
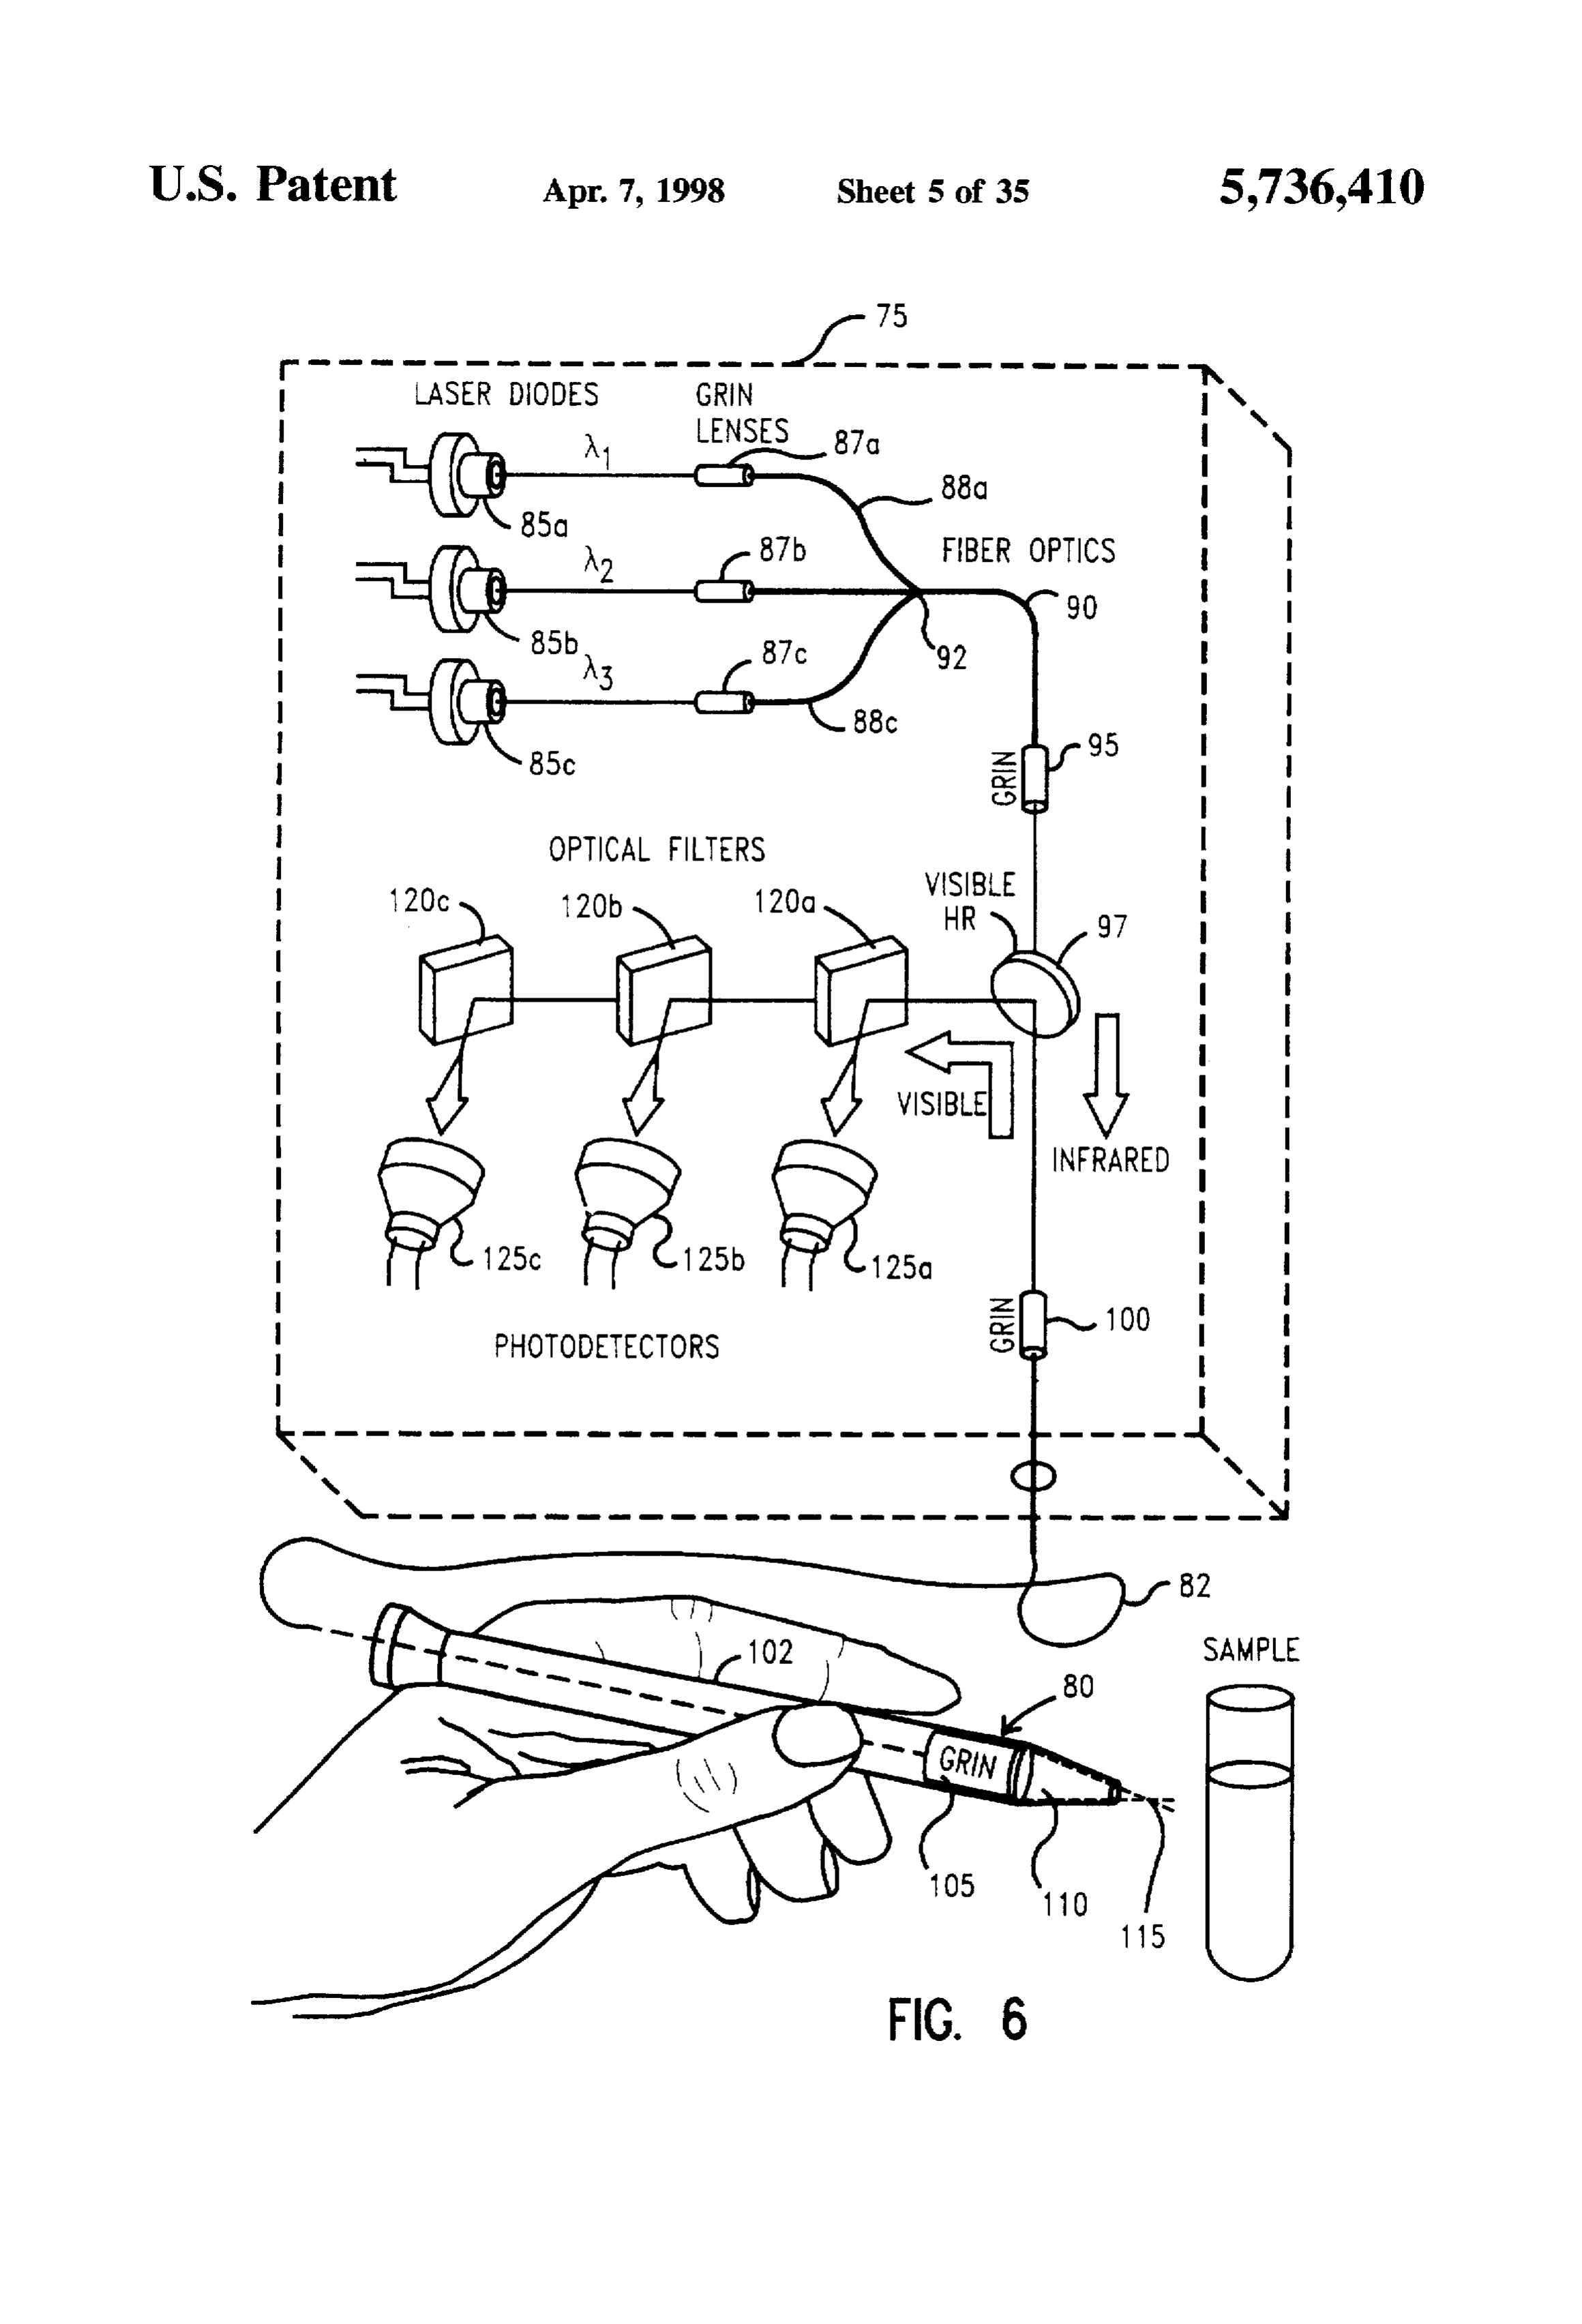
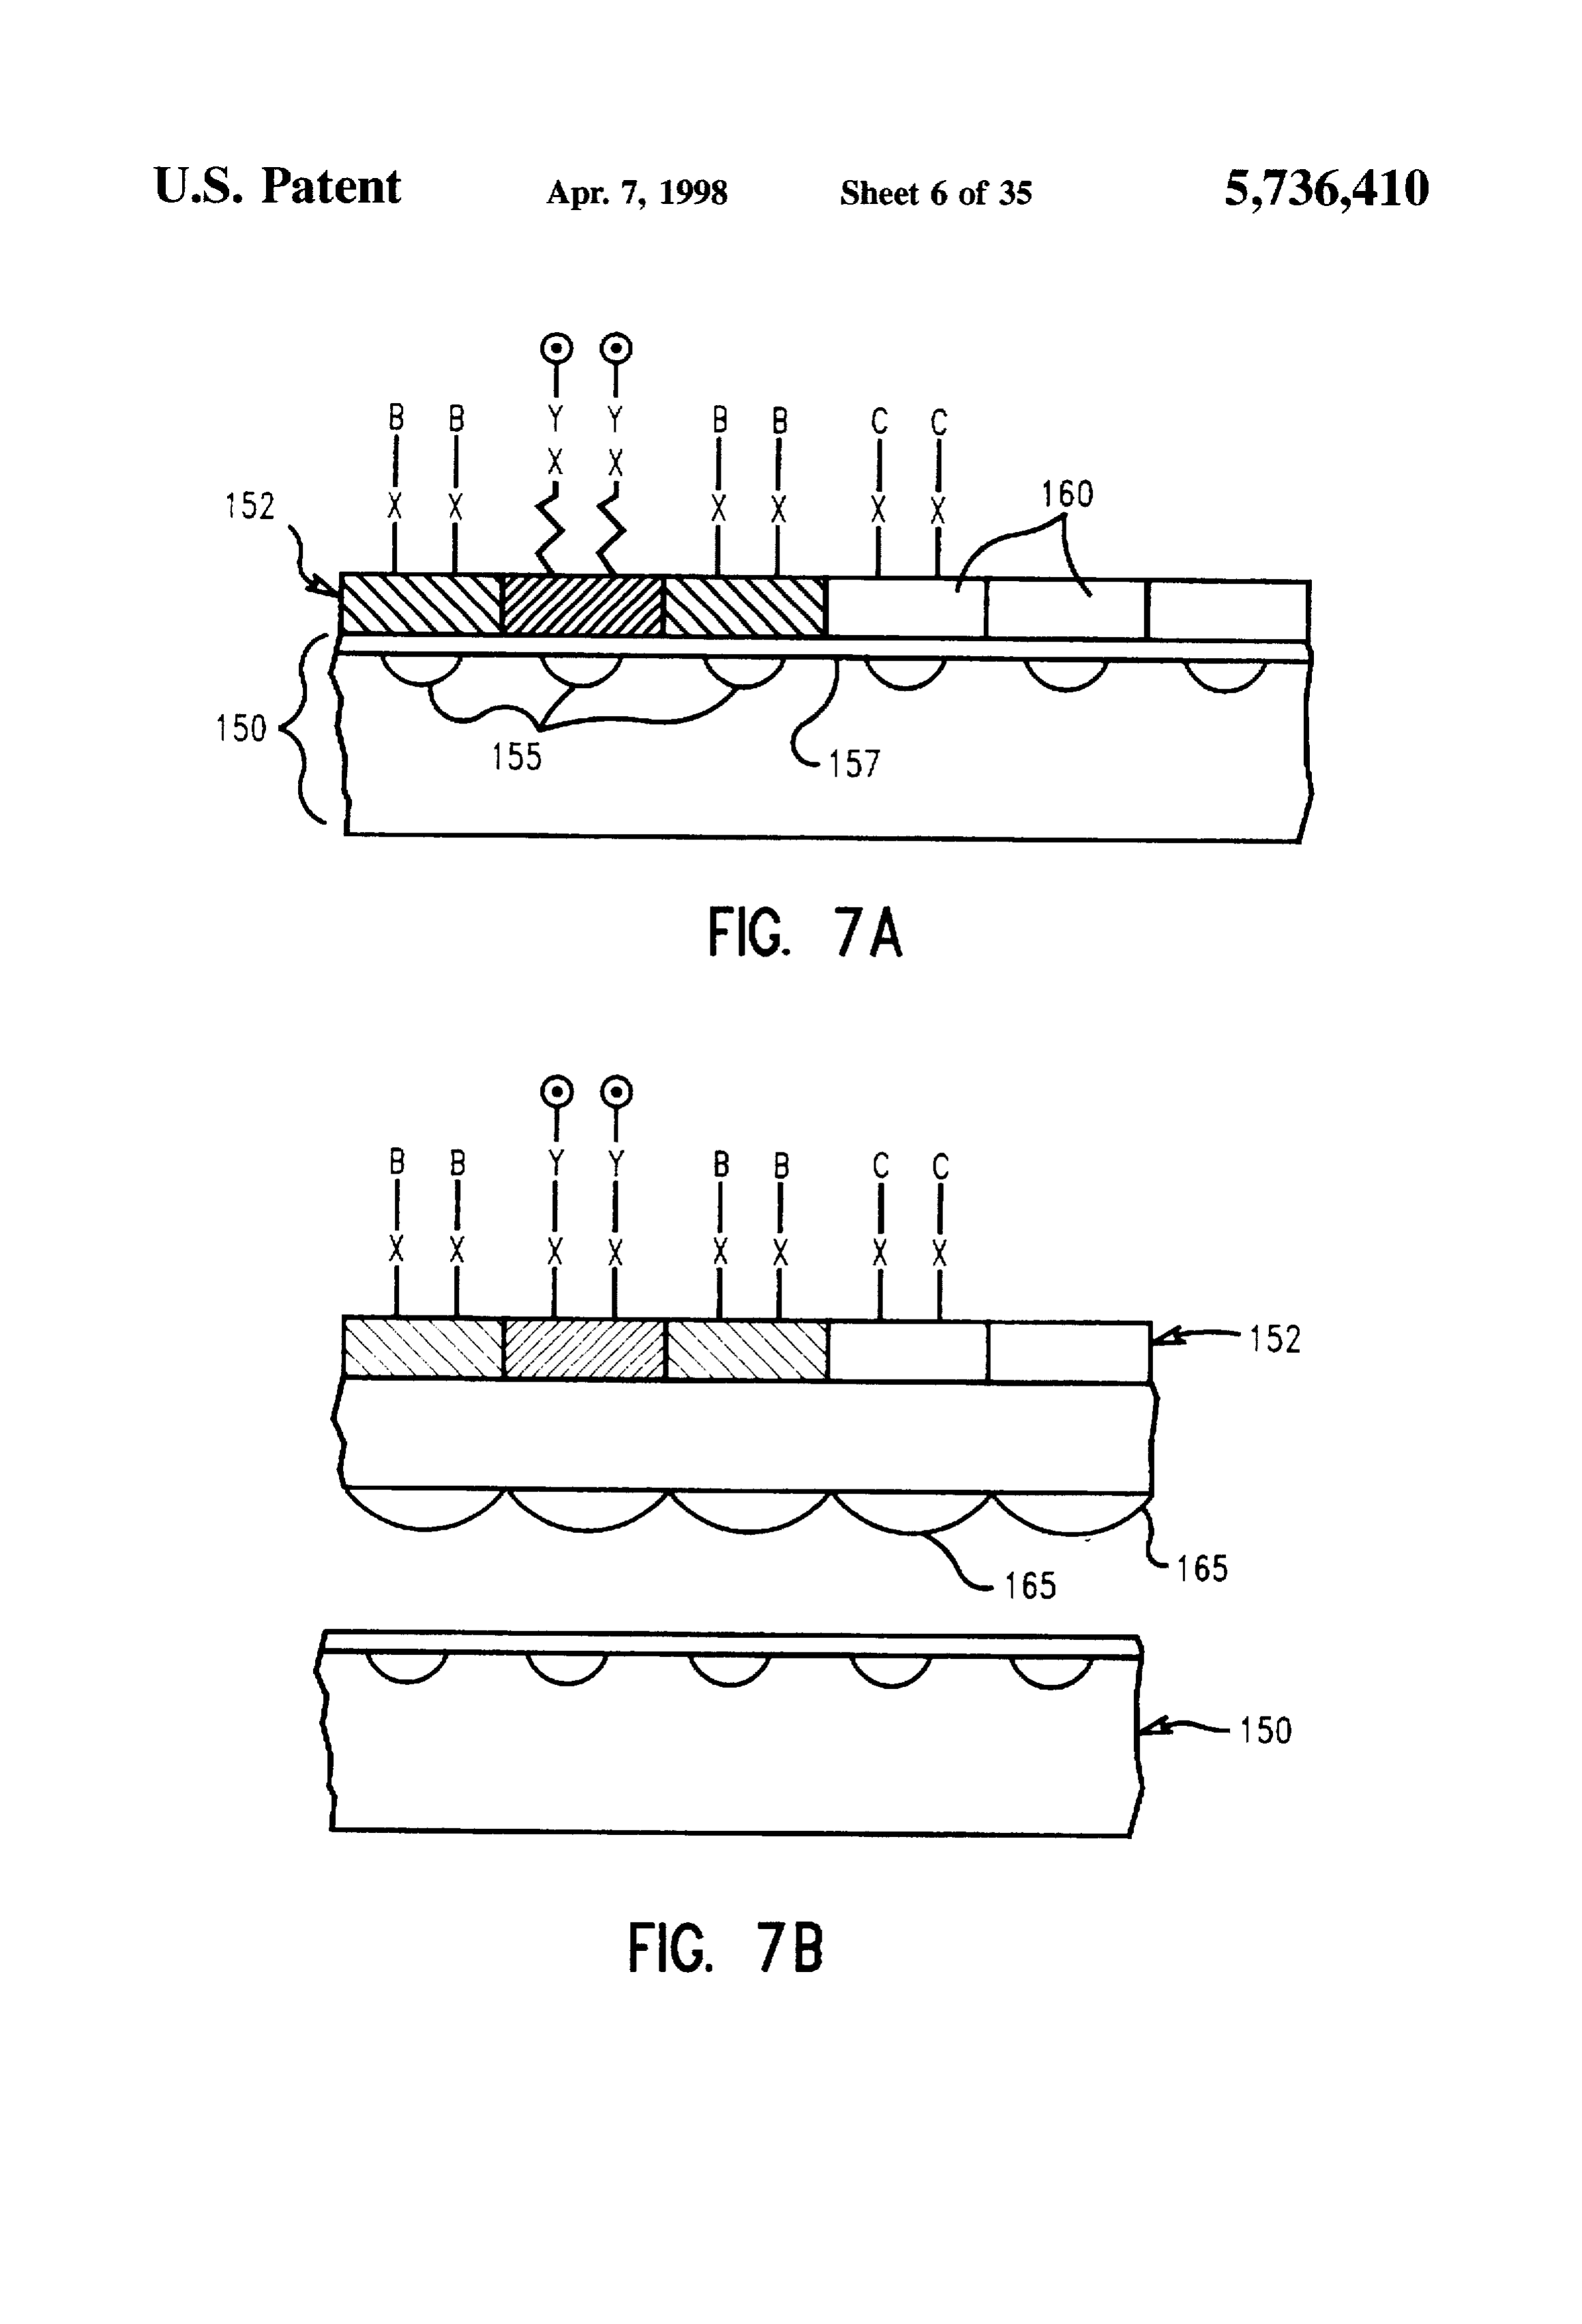
The invention also provides biochemical assay methods FIG. 5A. 5B, 5C show schematically energy state transi for determining the presence and concentration of one or tions in multi-photon excitation schemes. more analytes, typically in solution. The assay methods FIG. 6 shows a miniaturized instrument using a hand-held employ compositions of probes labeled with up-converting probe;
phosphors and/or up-converting dyes and apparatus for FIG. 7A shows the use of a charge-coupled device (CCD) magnetically and/or optically trapping particles that com array used to detect emissions from a large plurality of prise the analyte and the labeled probe. In one embodiment. 45 binding sites;
a sandwich assay is performed, wherein an immobilized FIG.7B shows the CCD array used in conjunction with a probe, immobilized on a particle, binds to a predetermined lens array;
analyte, producing an immobilization of the bound analyte FIG. 8 shows an embodiment using optical trapping; on the particle; a second probe. labeled with an up-converting label can then bind to the bound analyte to 50 tionFIG. of 9 shows schematically dye coating and encapsula an up-converting phosphor particle:
produce a bound sandwich complex containing an up-converting label bound to a particle. By combining ingFIG. 10 shows schematically an apparatus for determin particle velocity and hydrodynamic or aerodynamic different probe-label combinations, particles of various properties of a target;
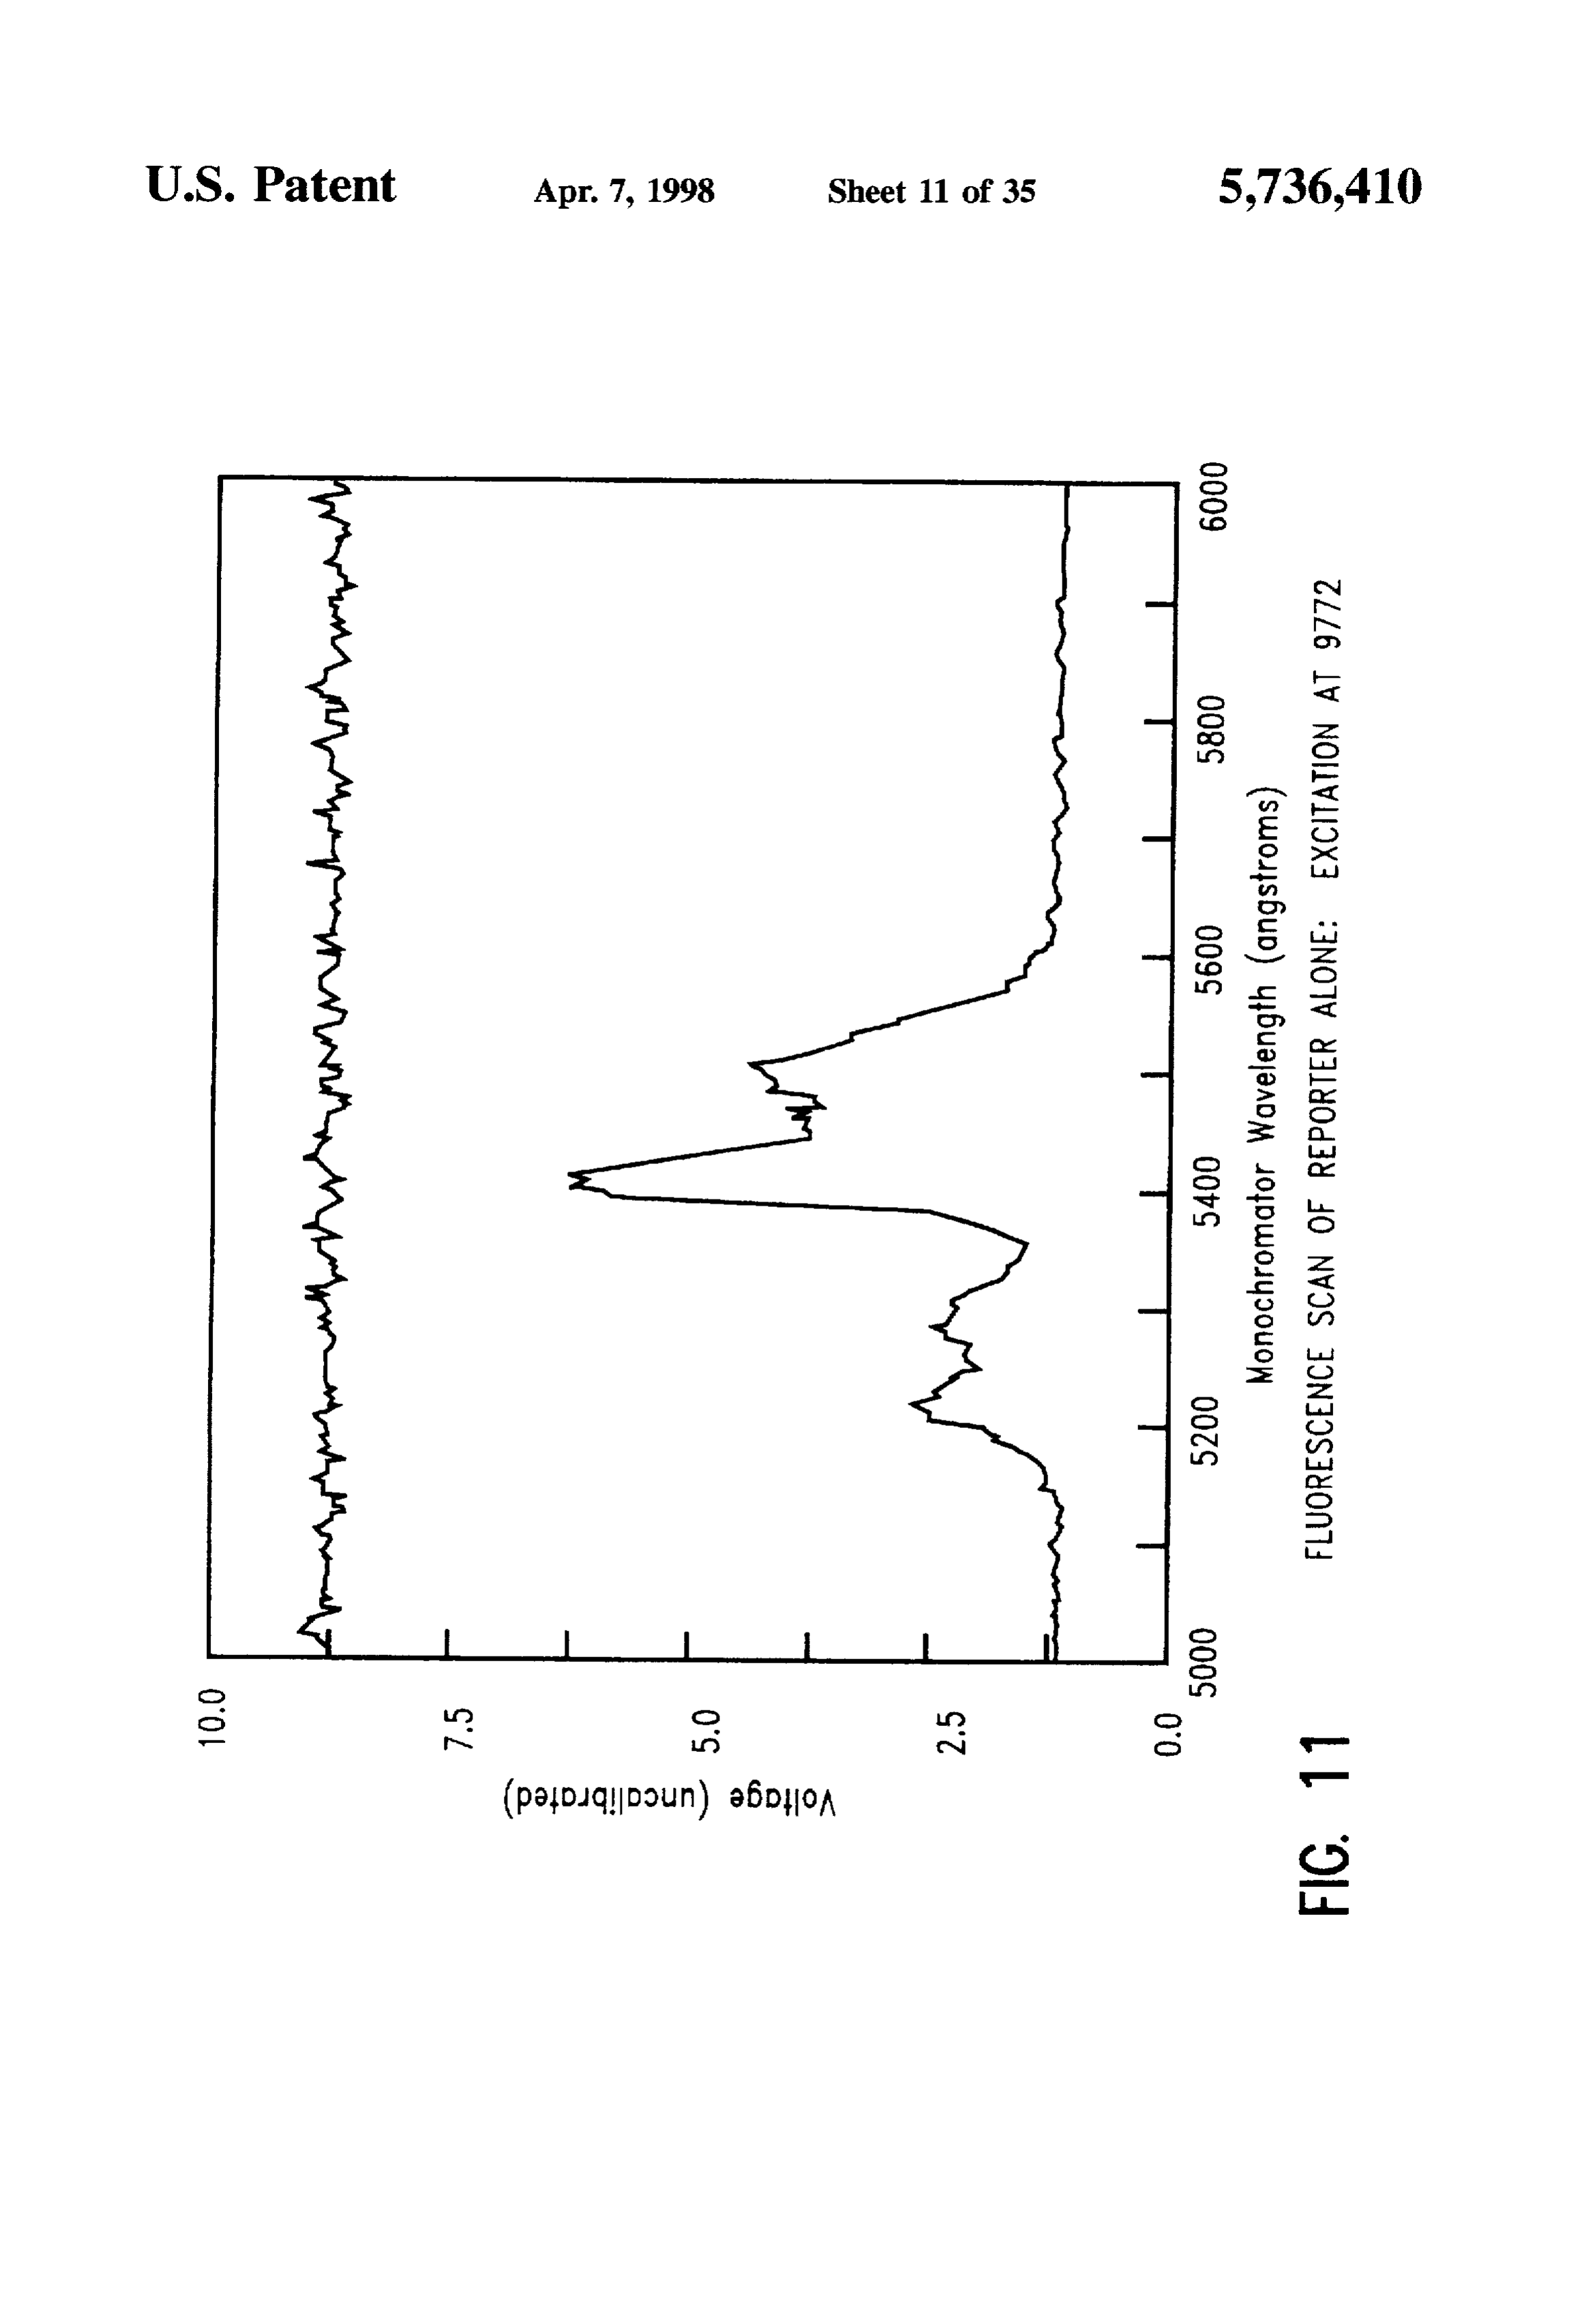
sizes, colors, and/or shapes with distinct immobilized probe (s), and/or various excitation wavelengths, it is possible to 55 FIG. 11 is a phosphor emission spectrum of sodium perform multiple assays essentially simultaneously or con yttrium fluoride-ytterbium/erbium up-converting phosphor temporaneously. This multiplex advantage affords detection with an excitation laser source at a wavelength max. of 977.2 and quantitation of multiple analyte species in a single nm; emission max. is about 541.0 nmi;
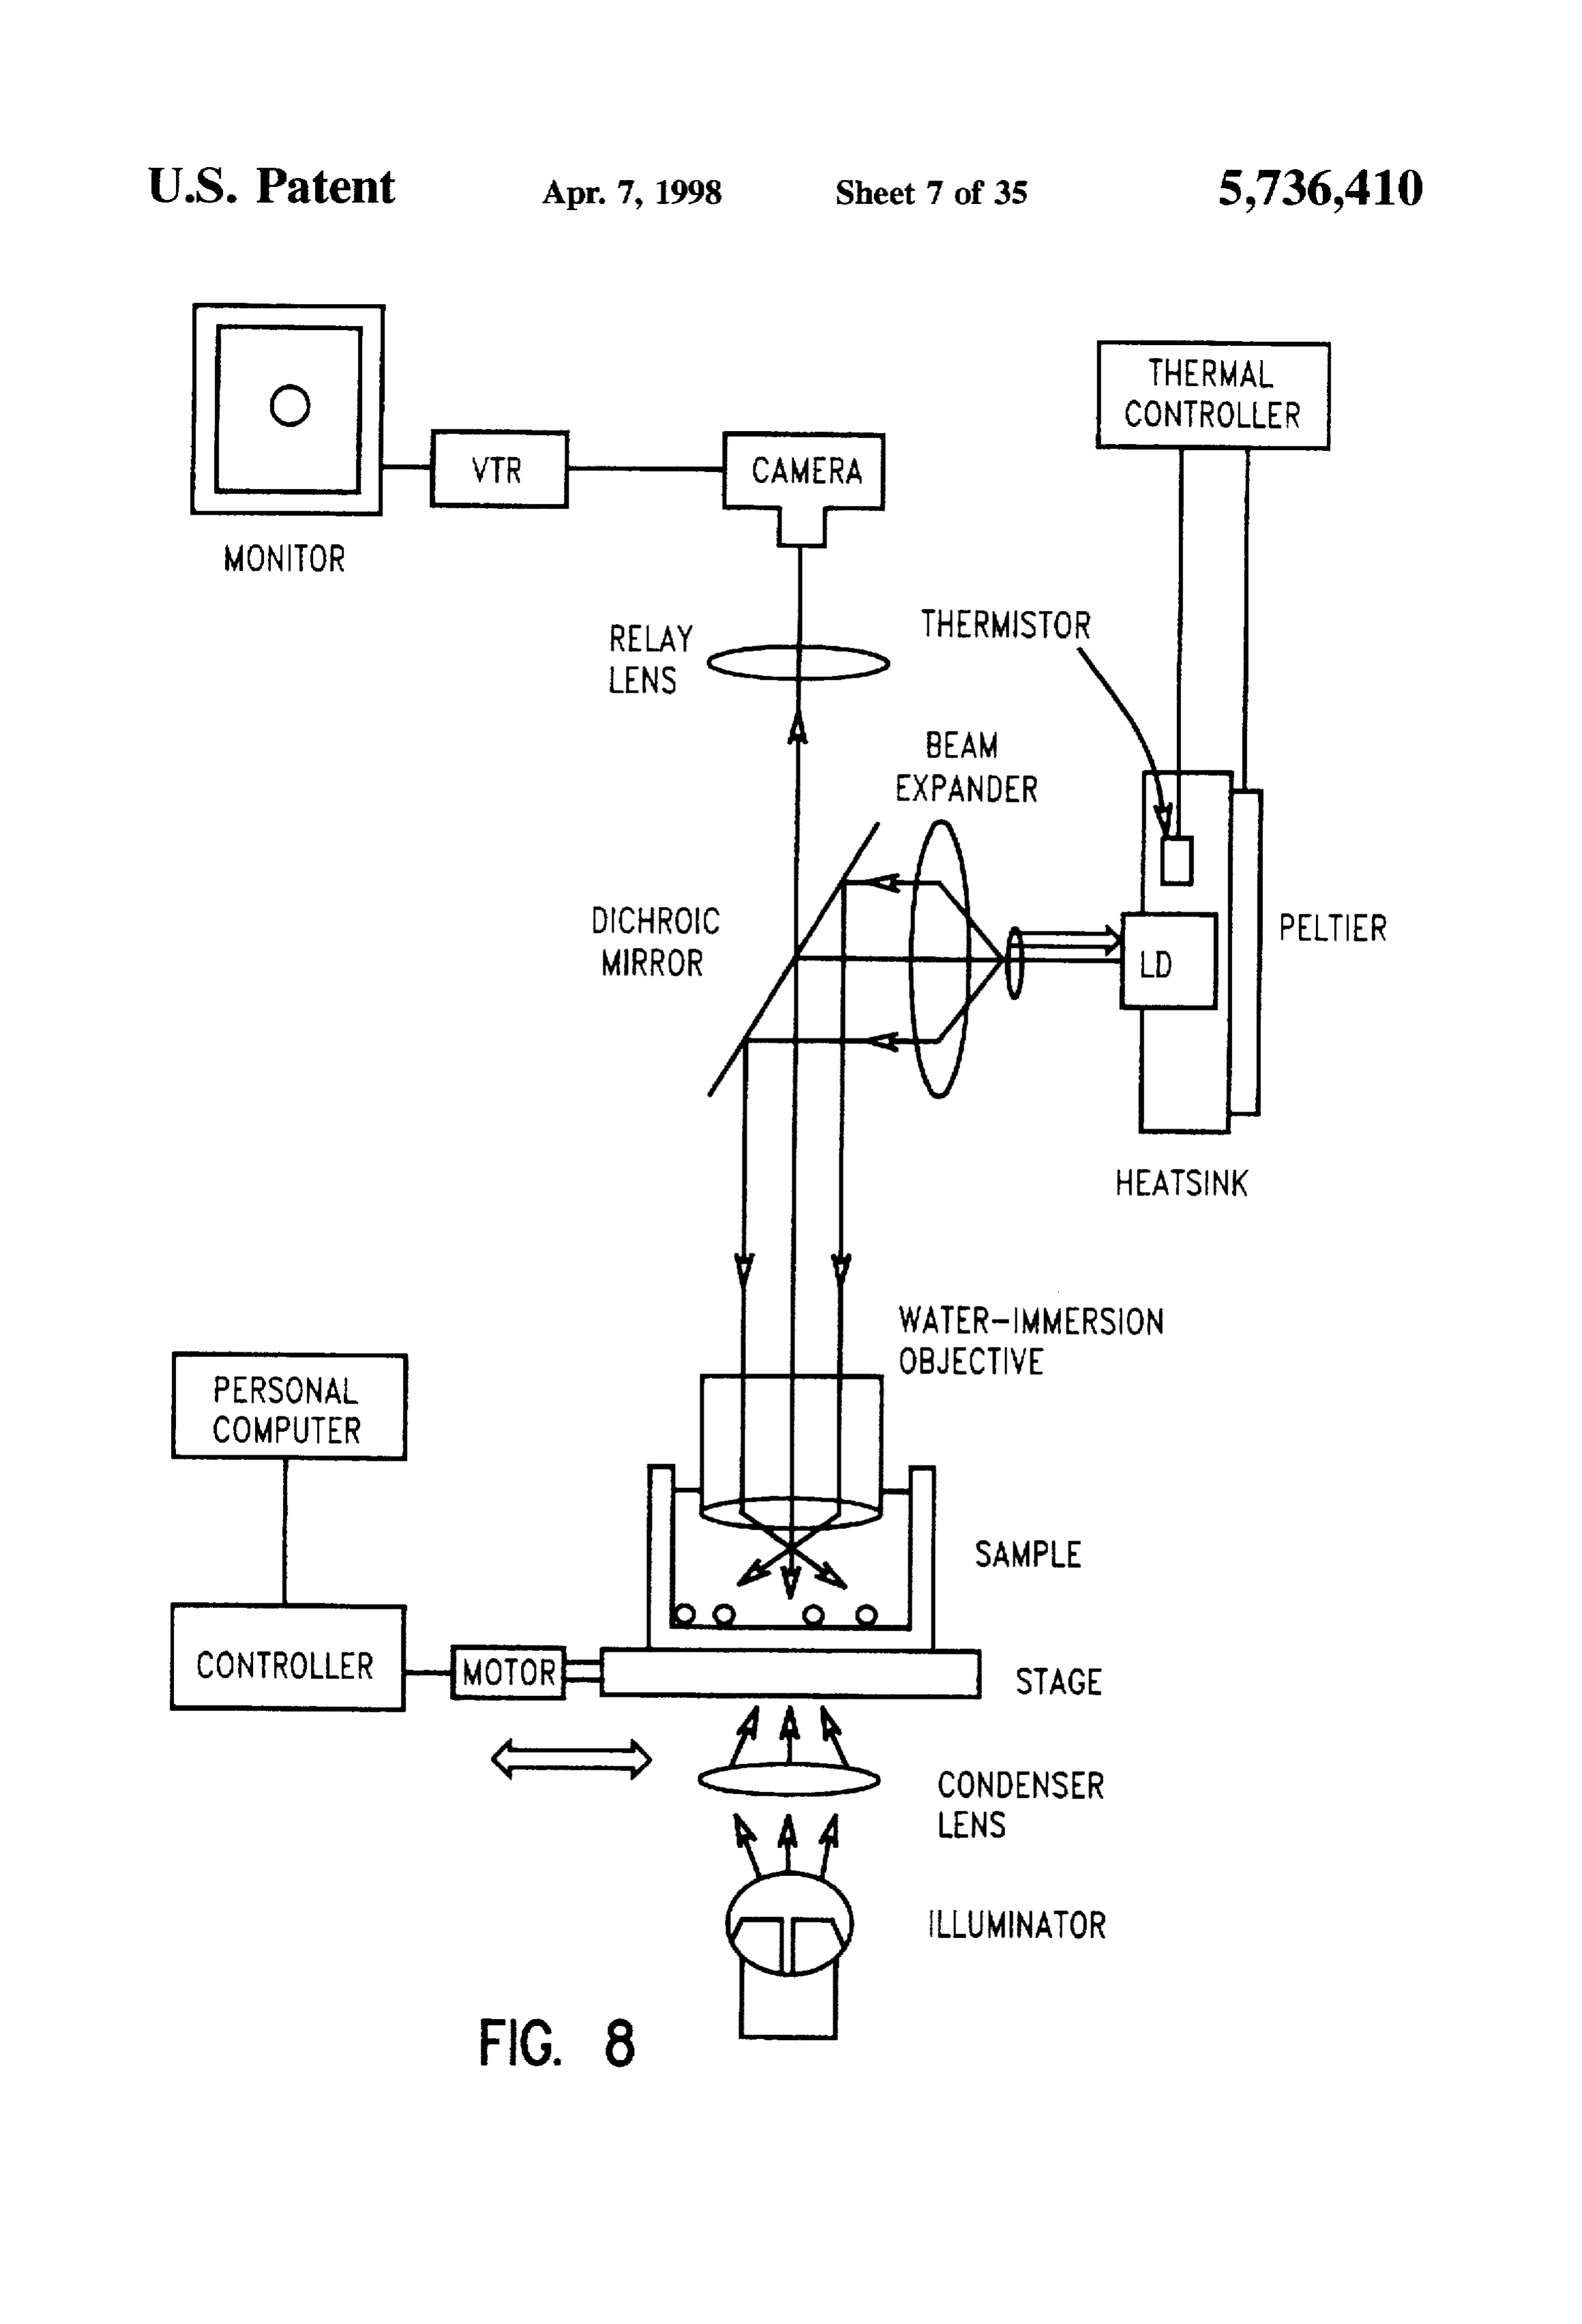
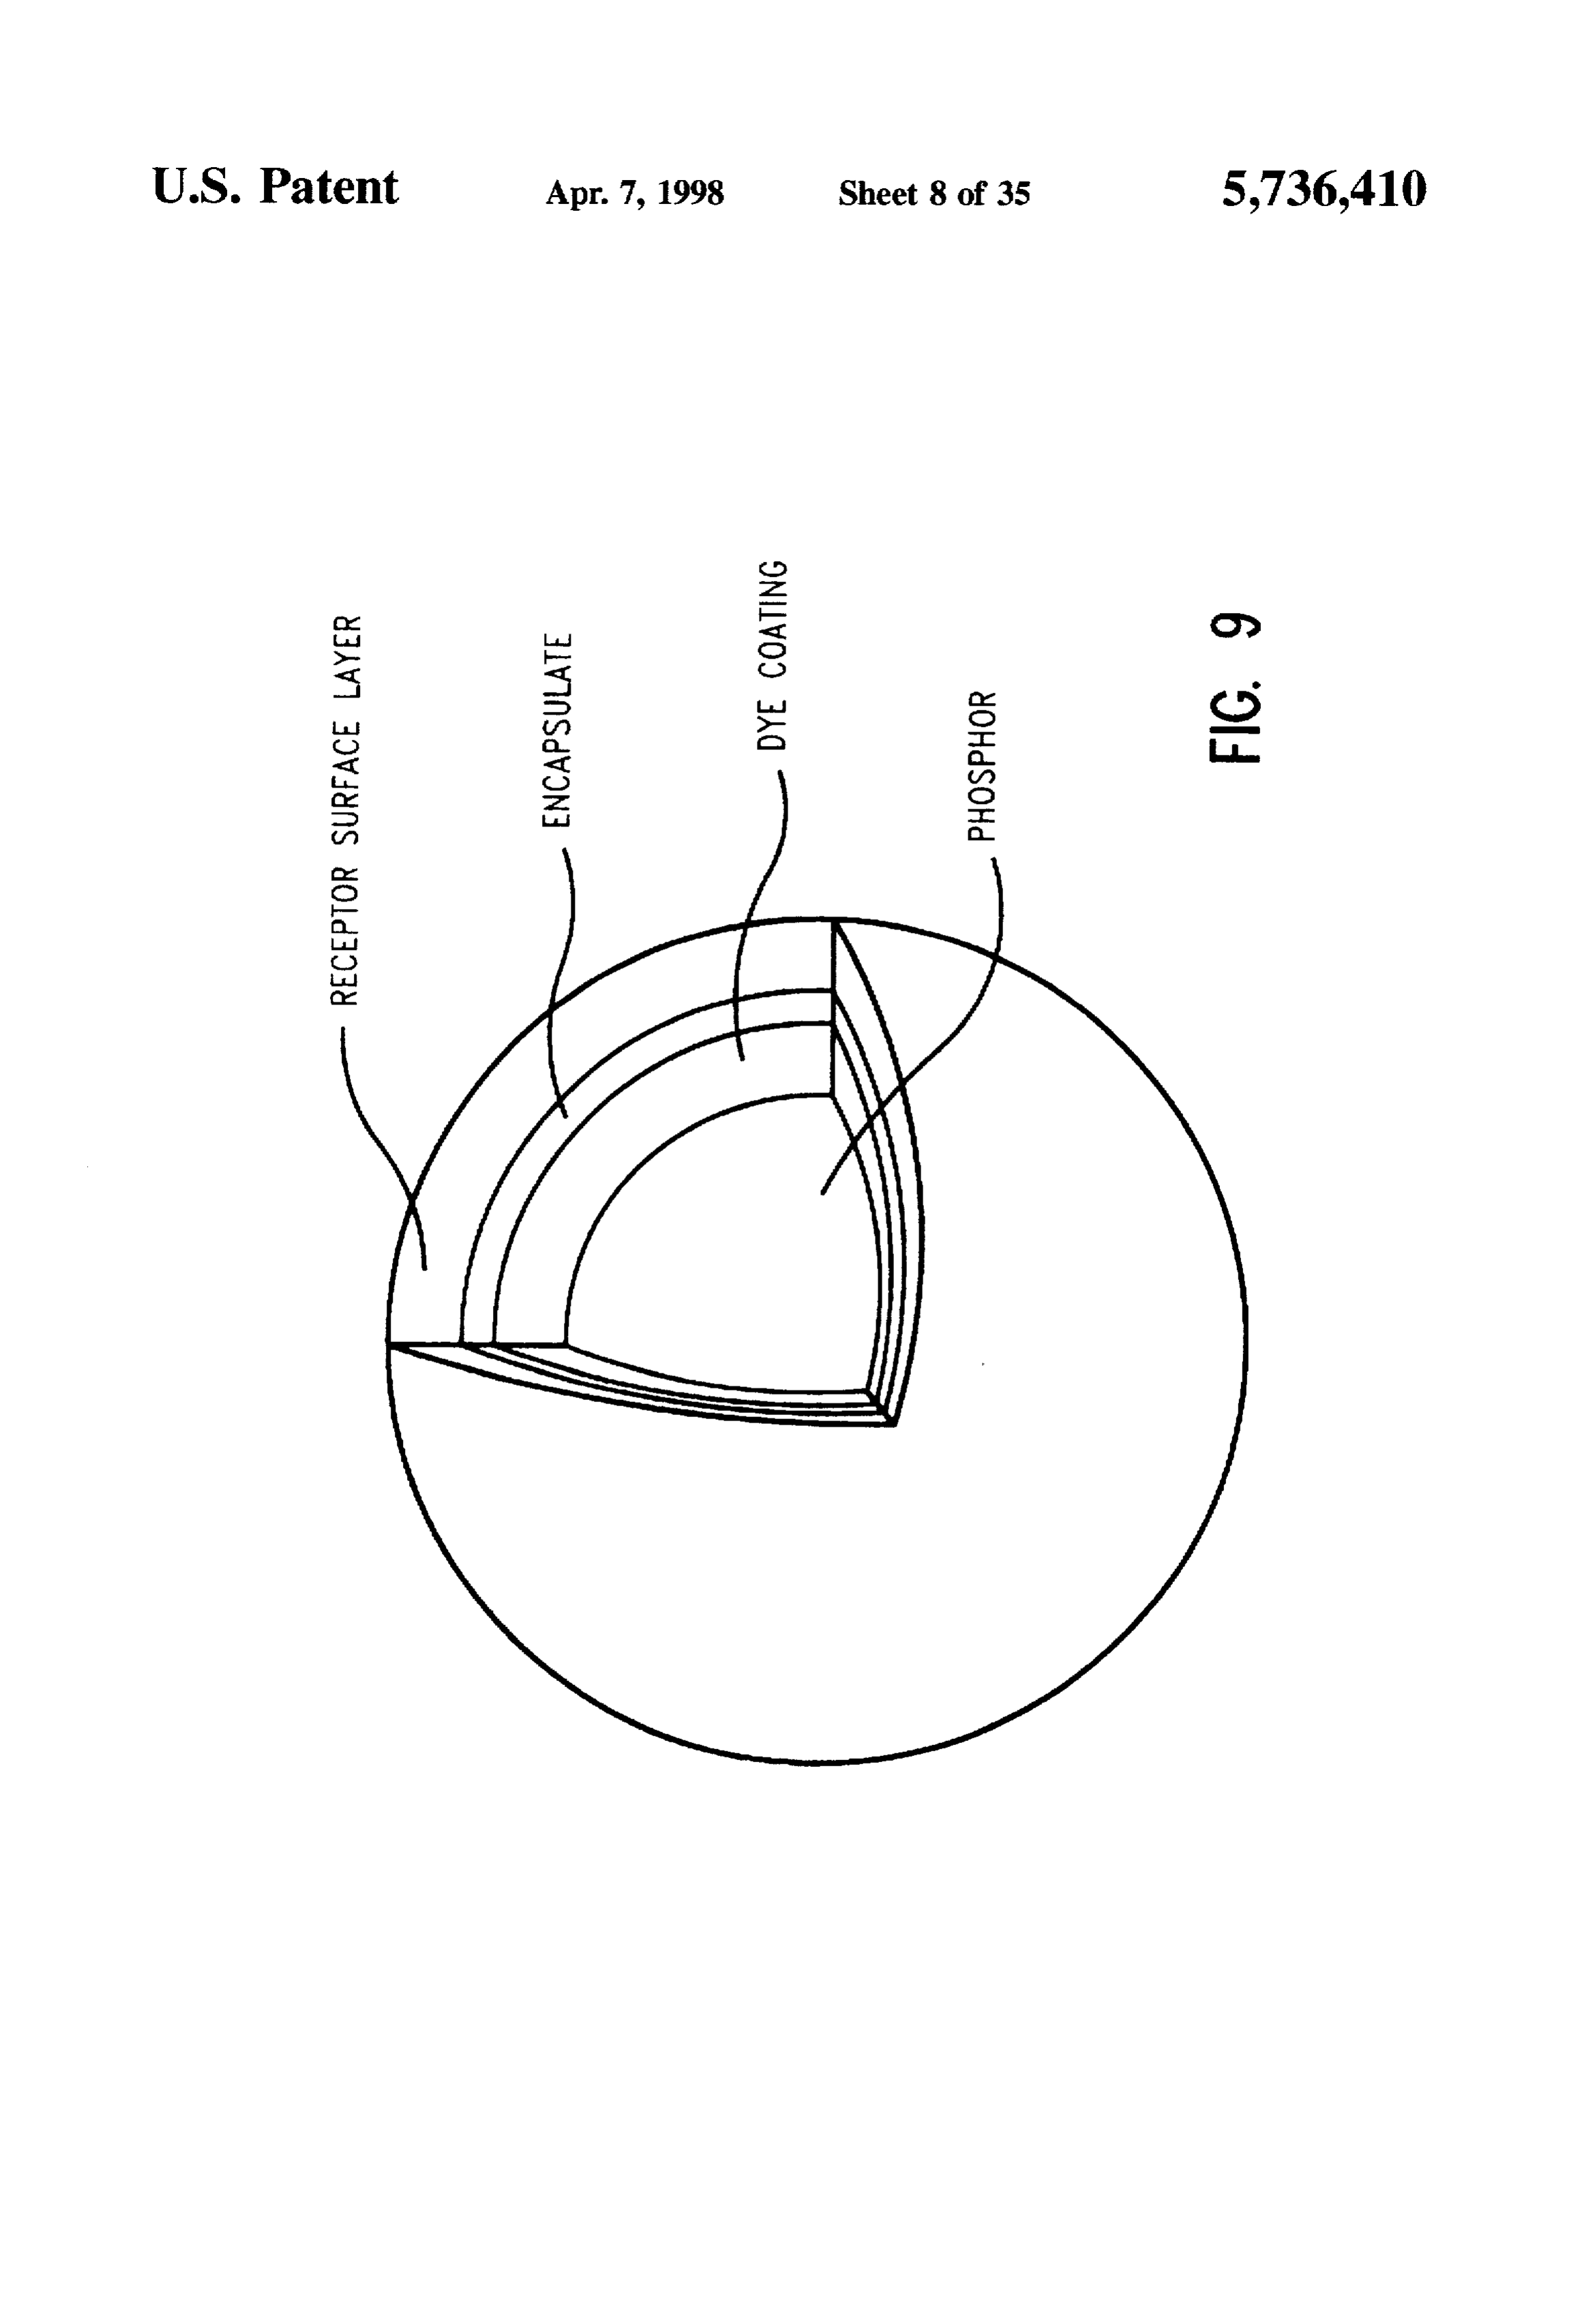
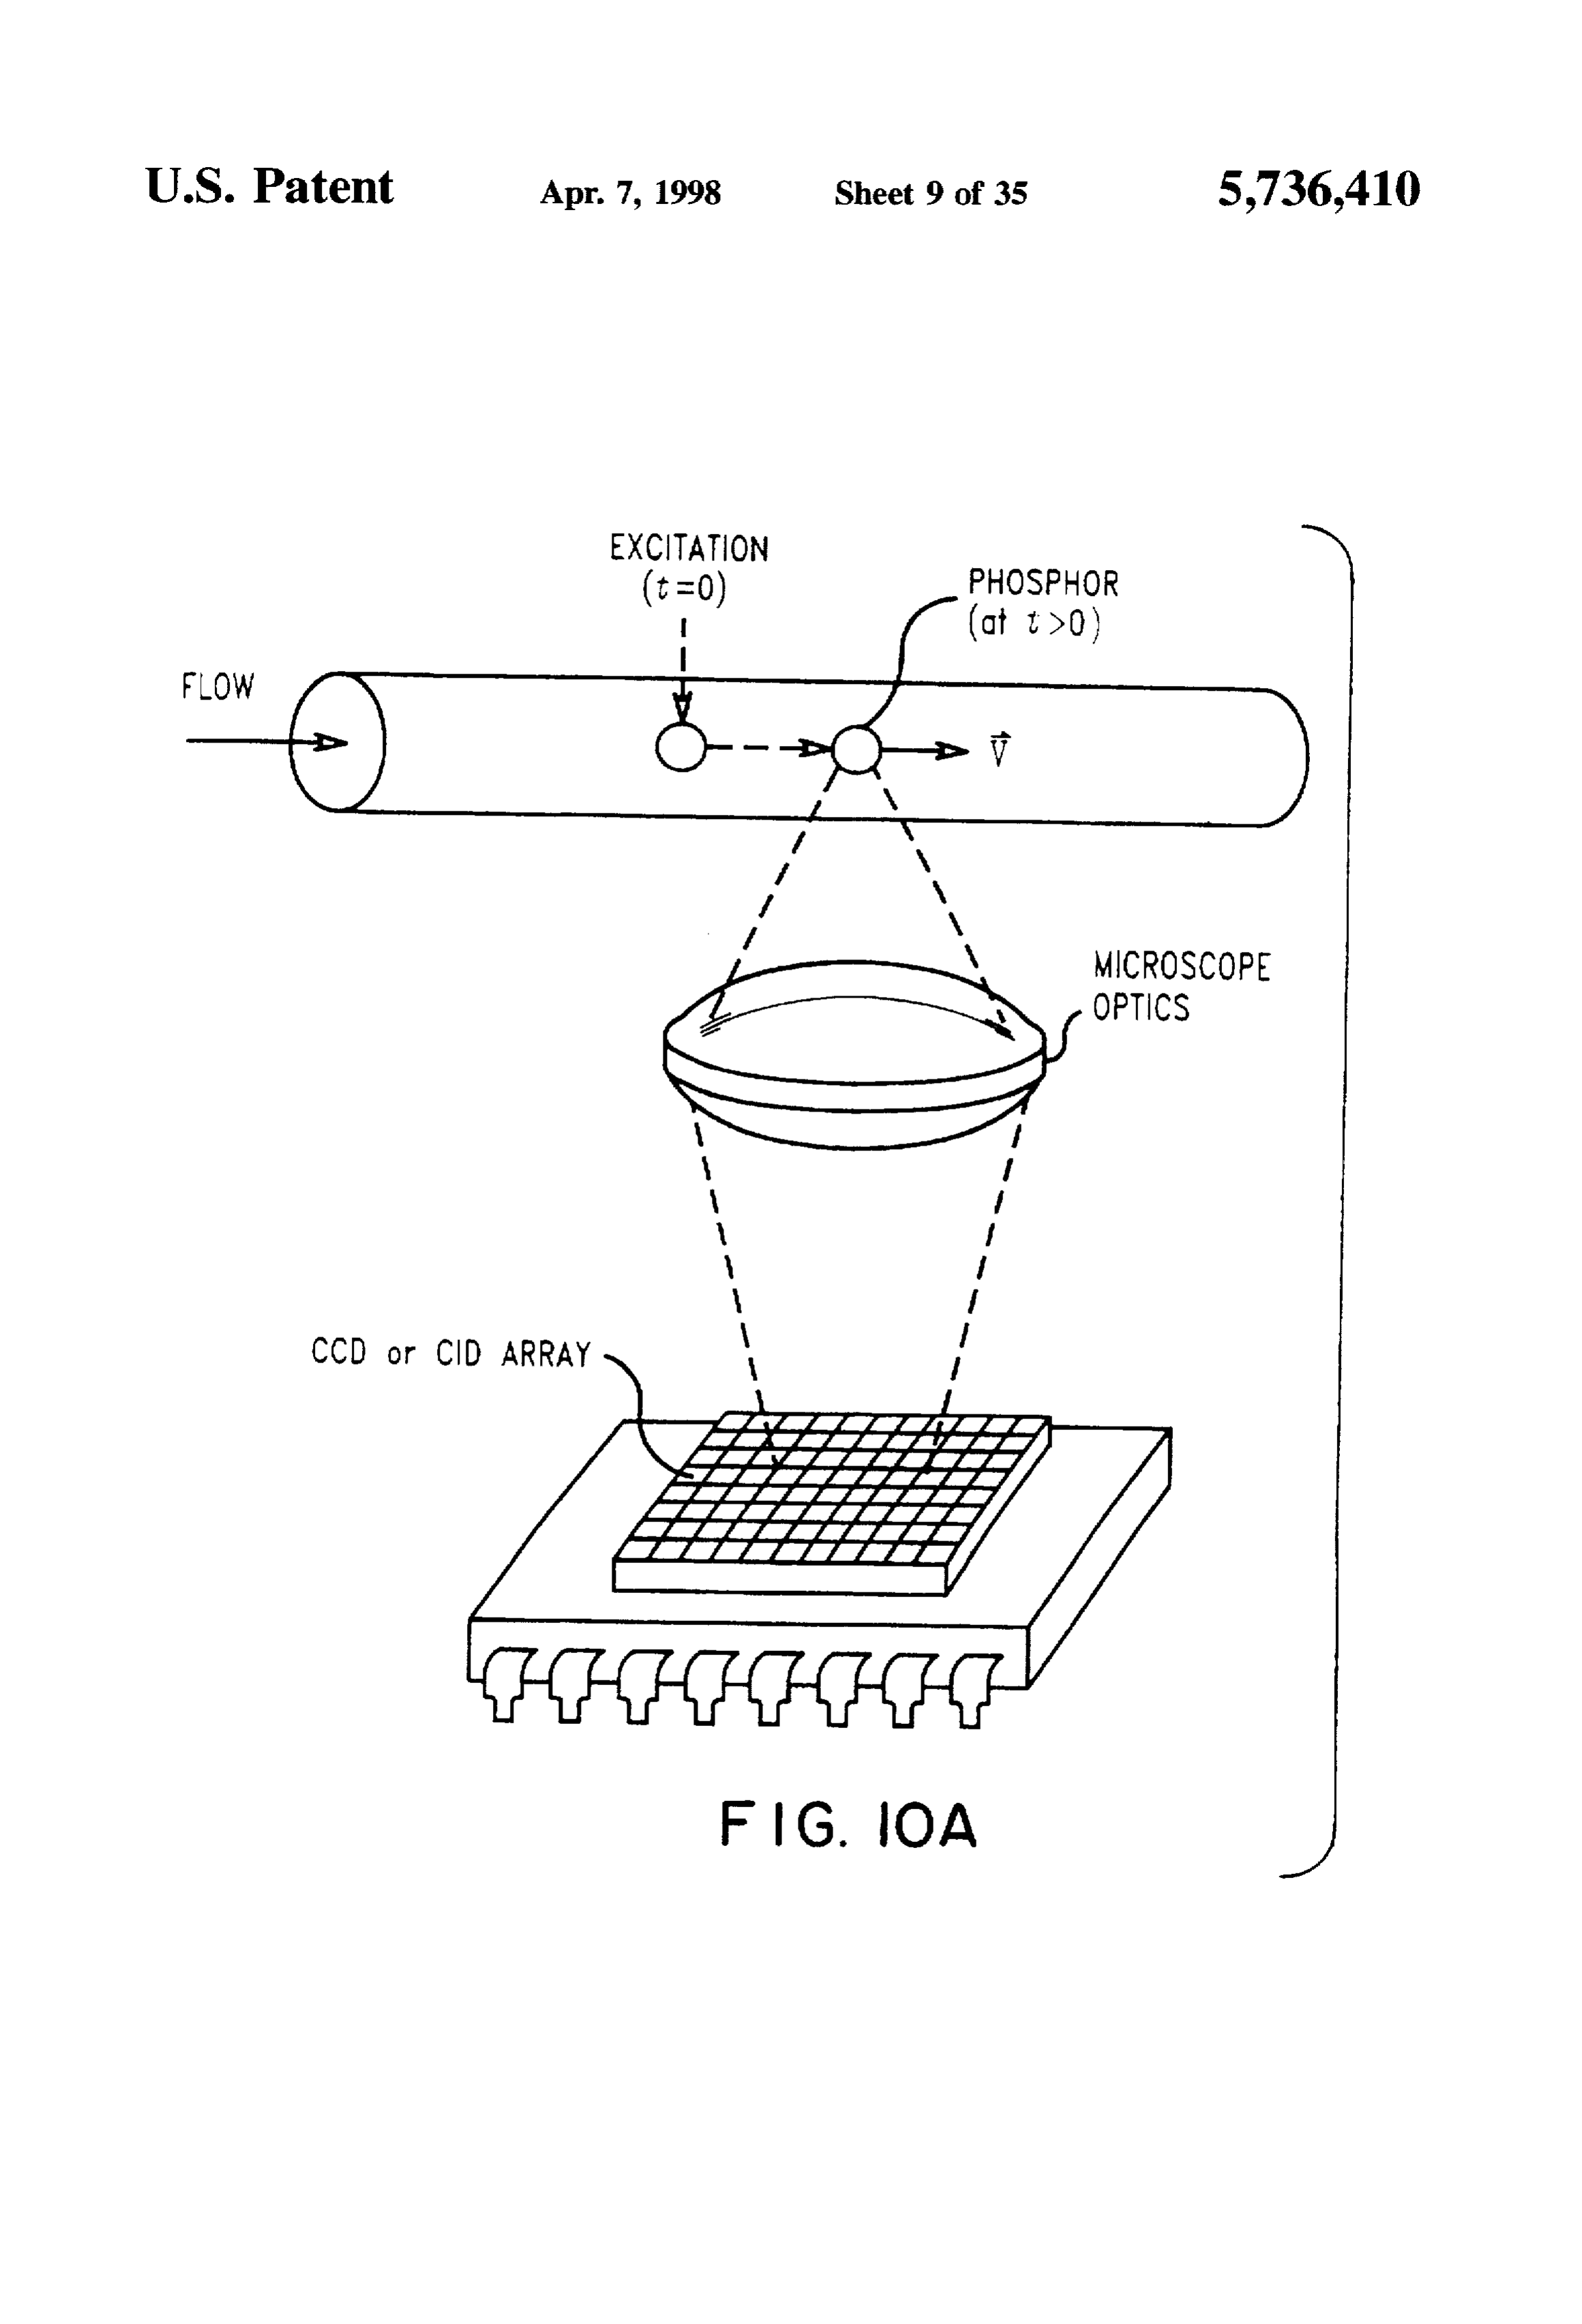
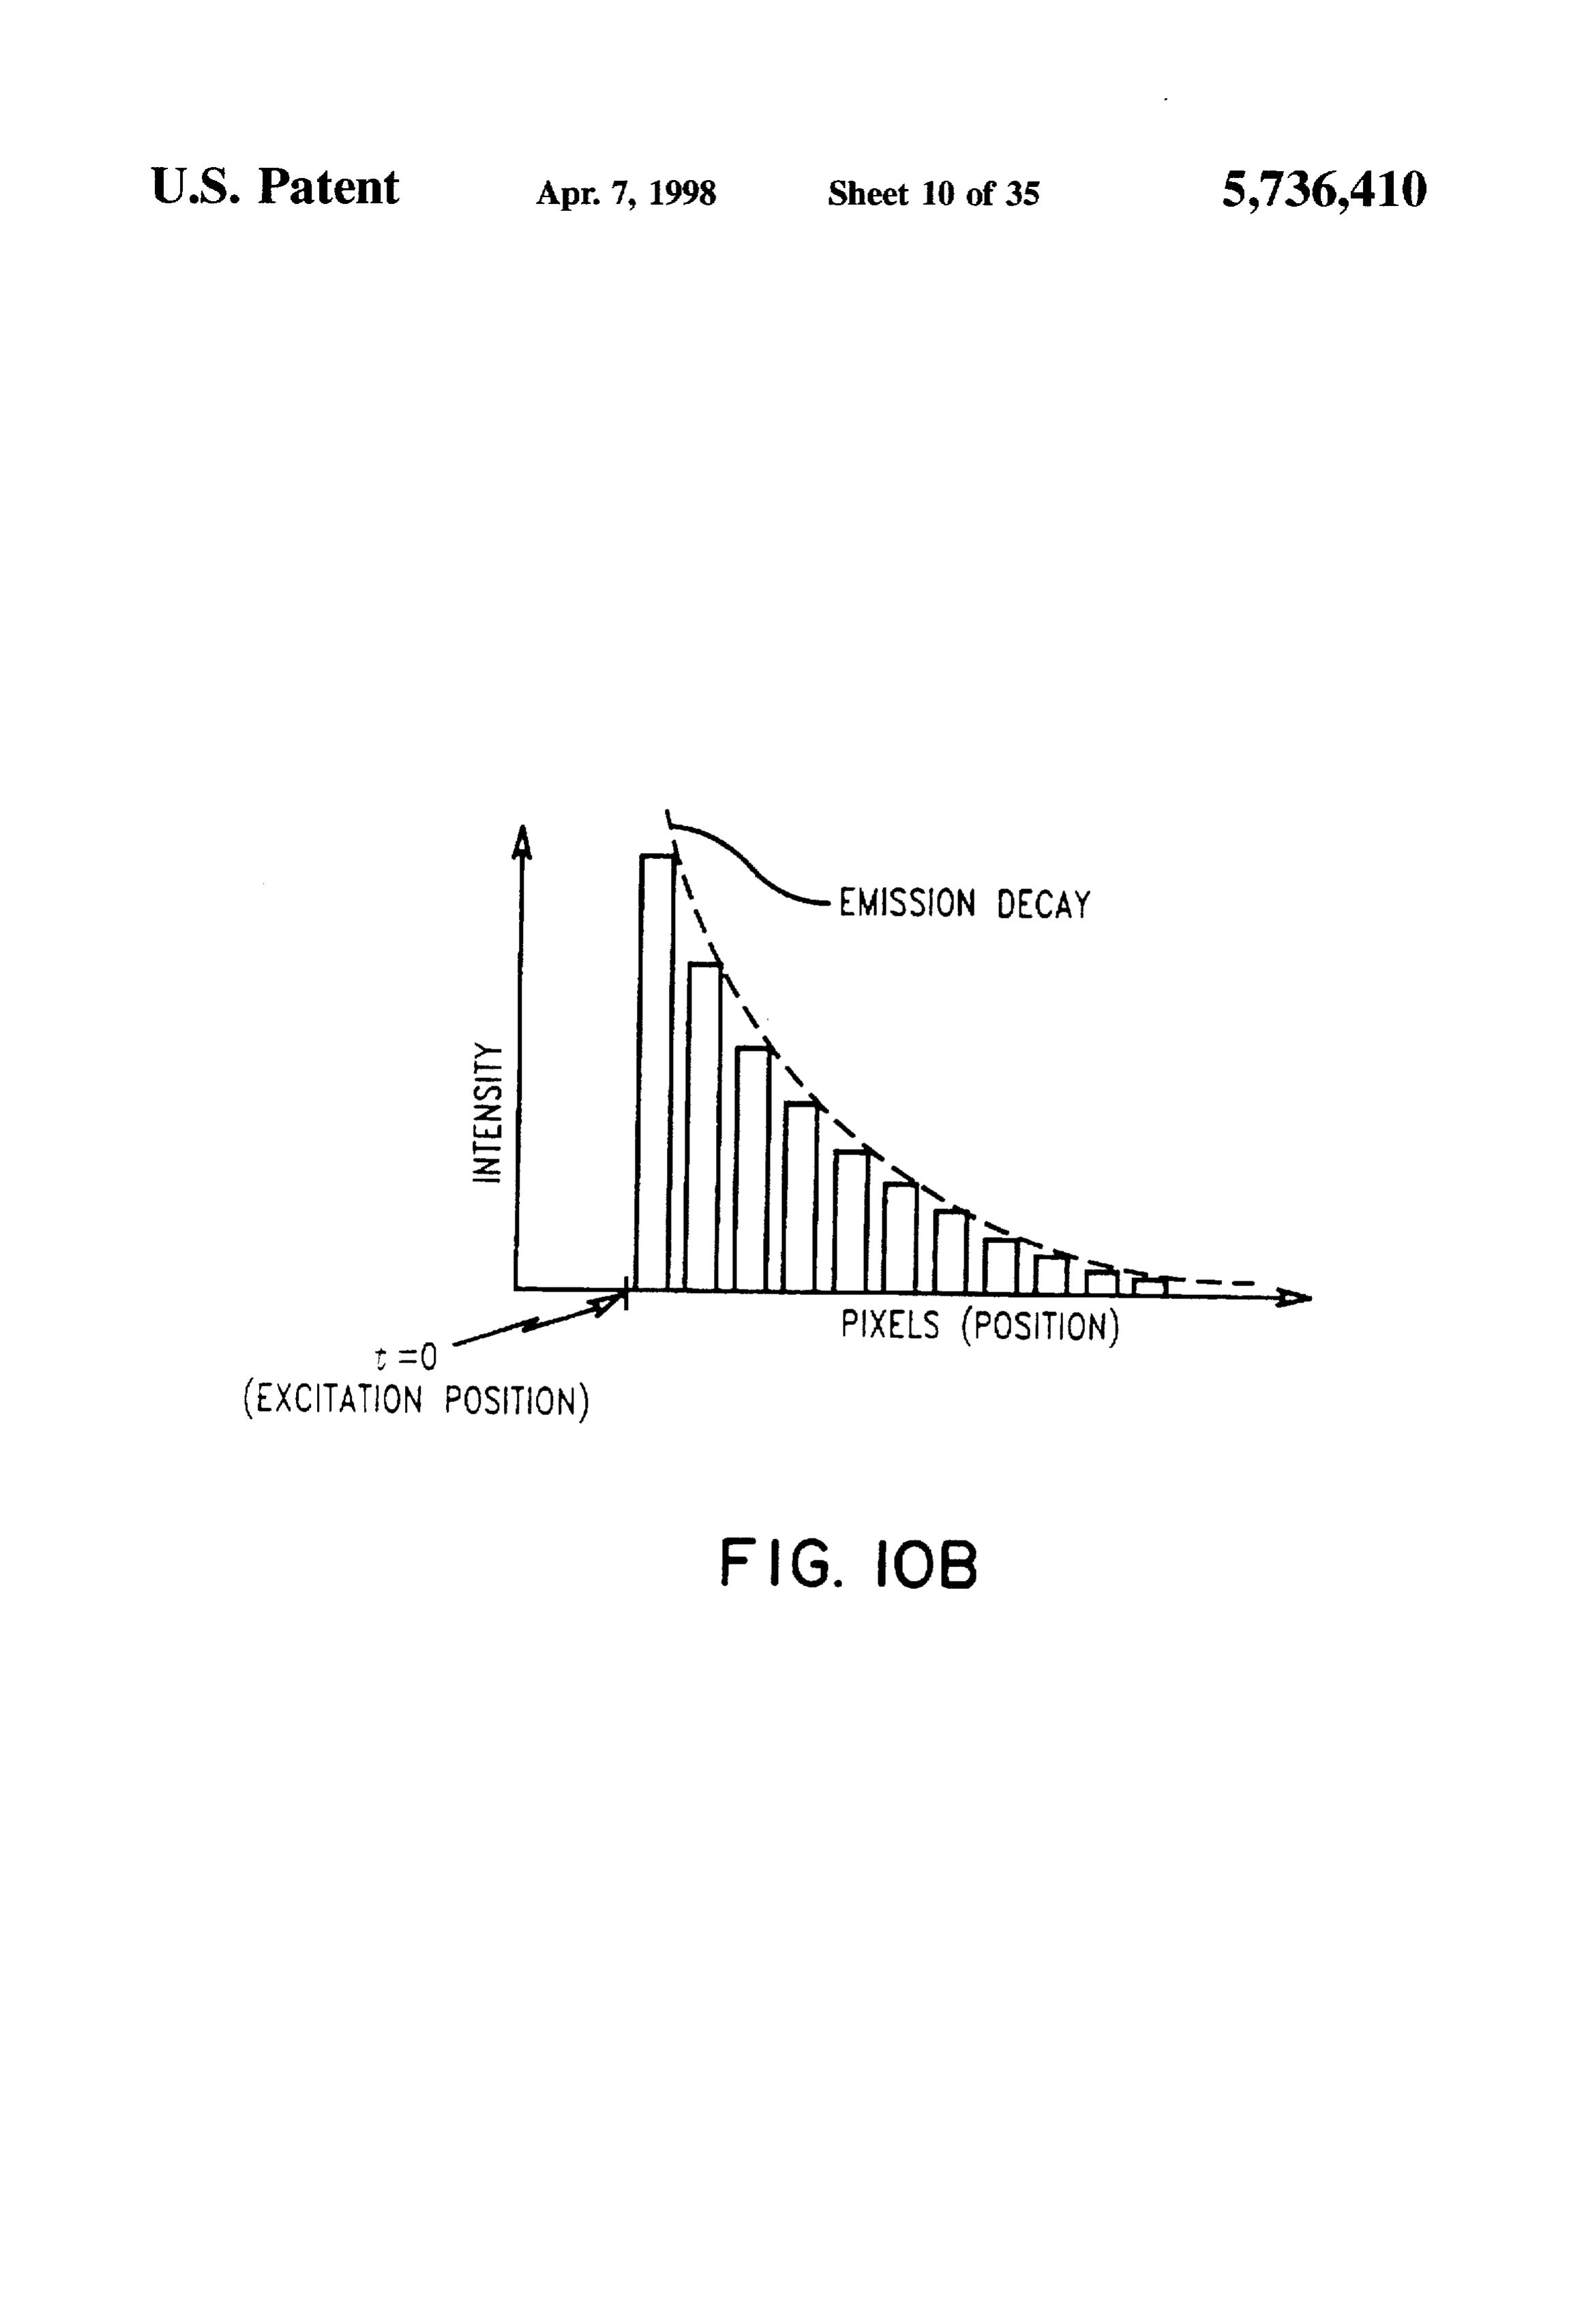
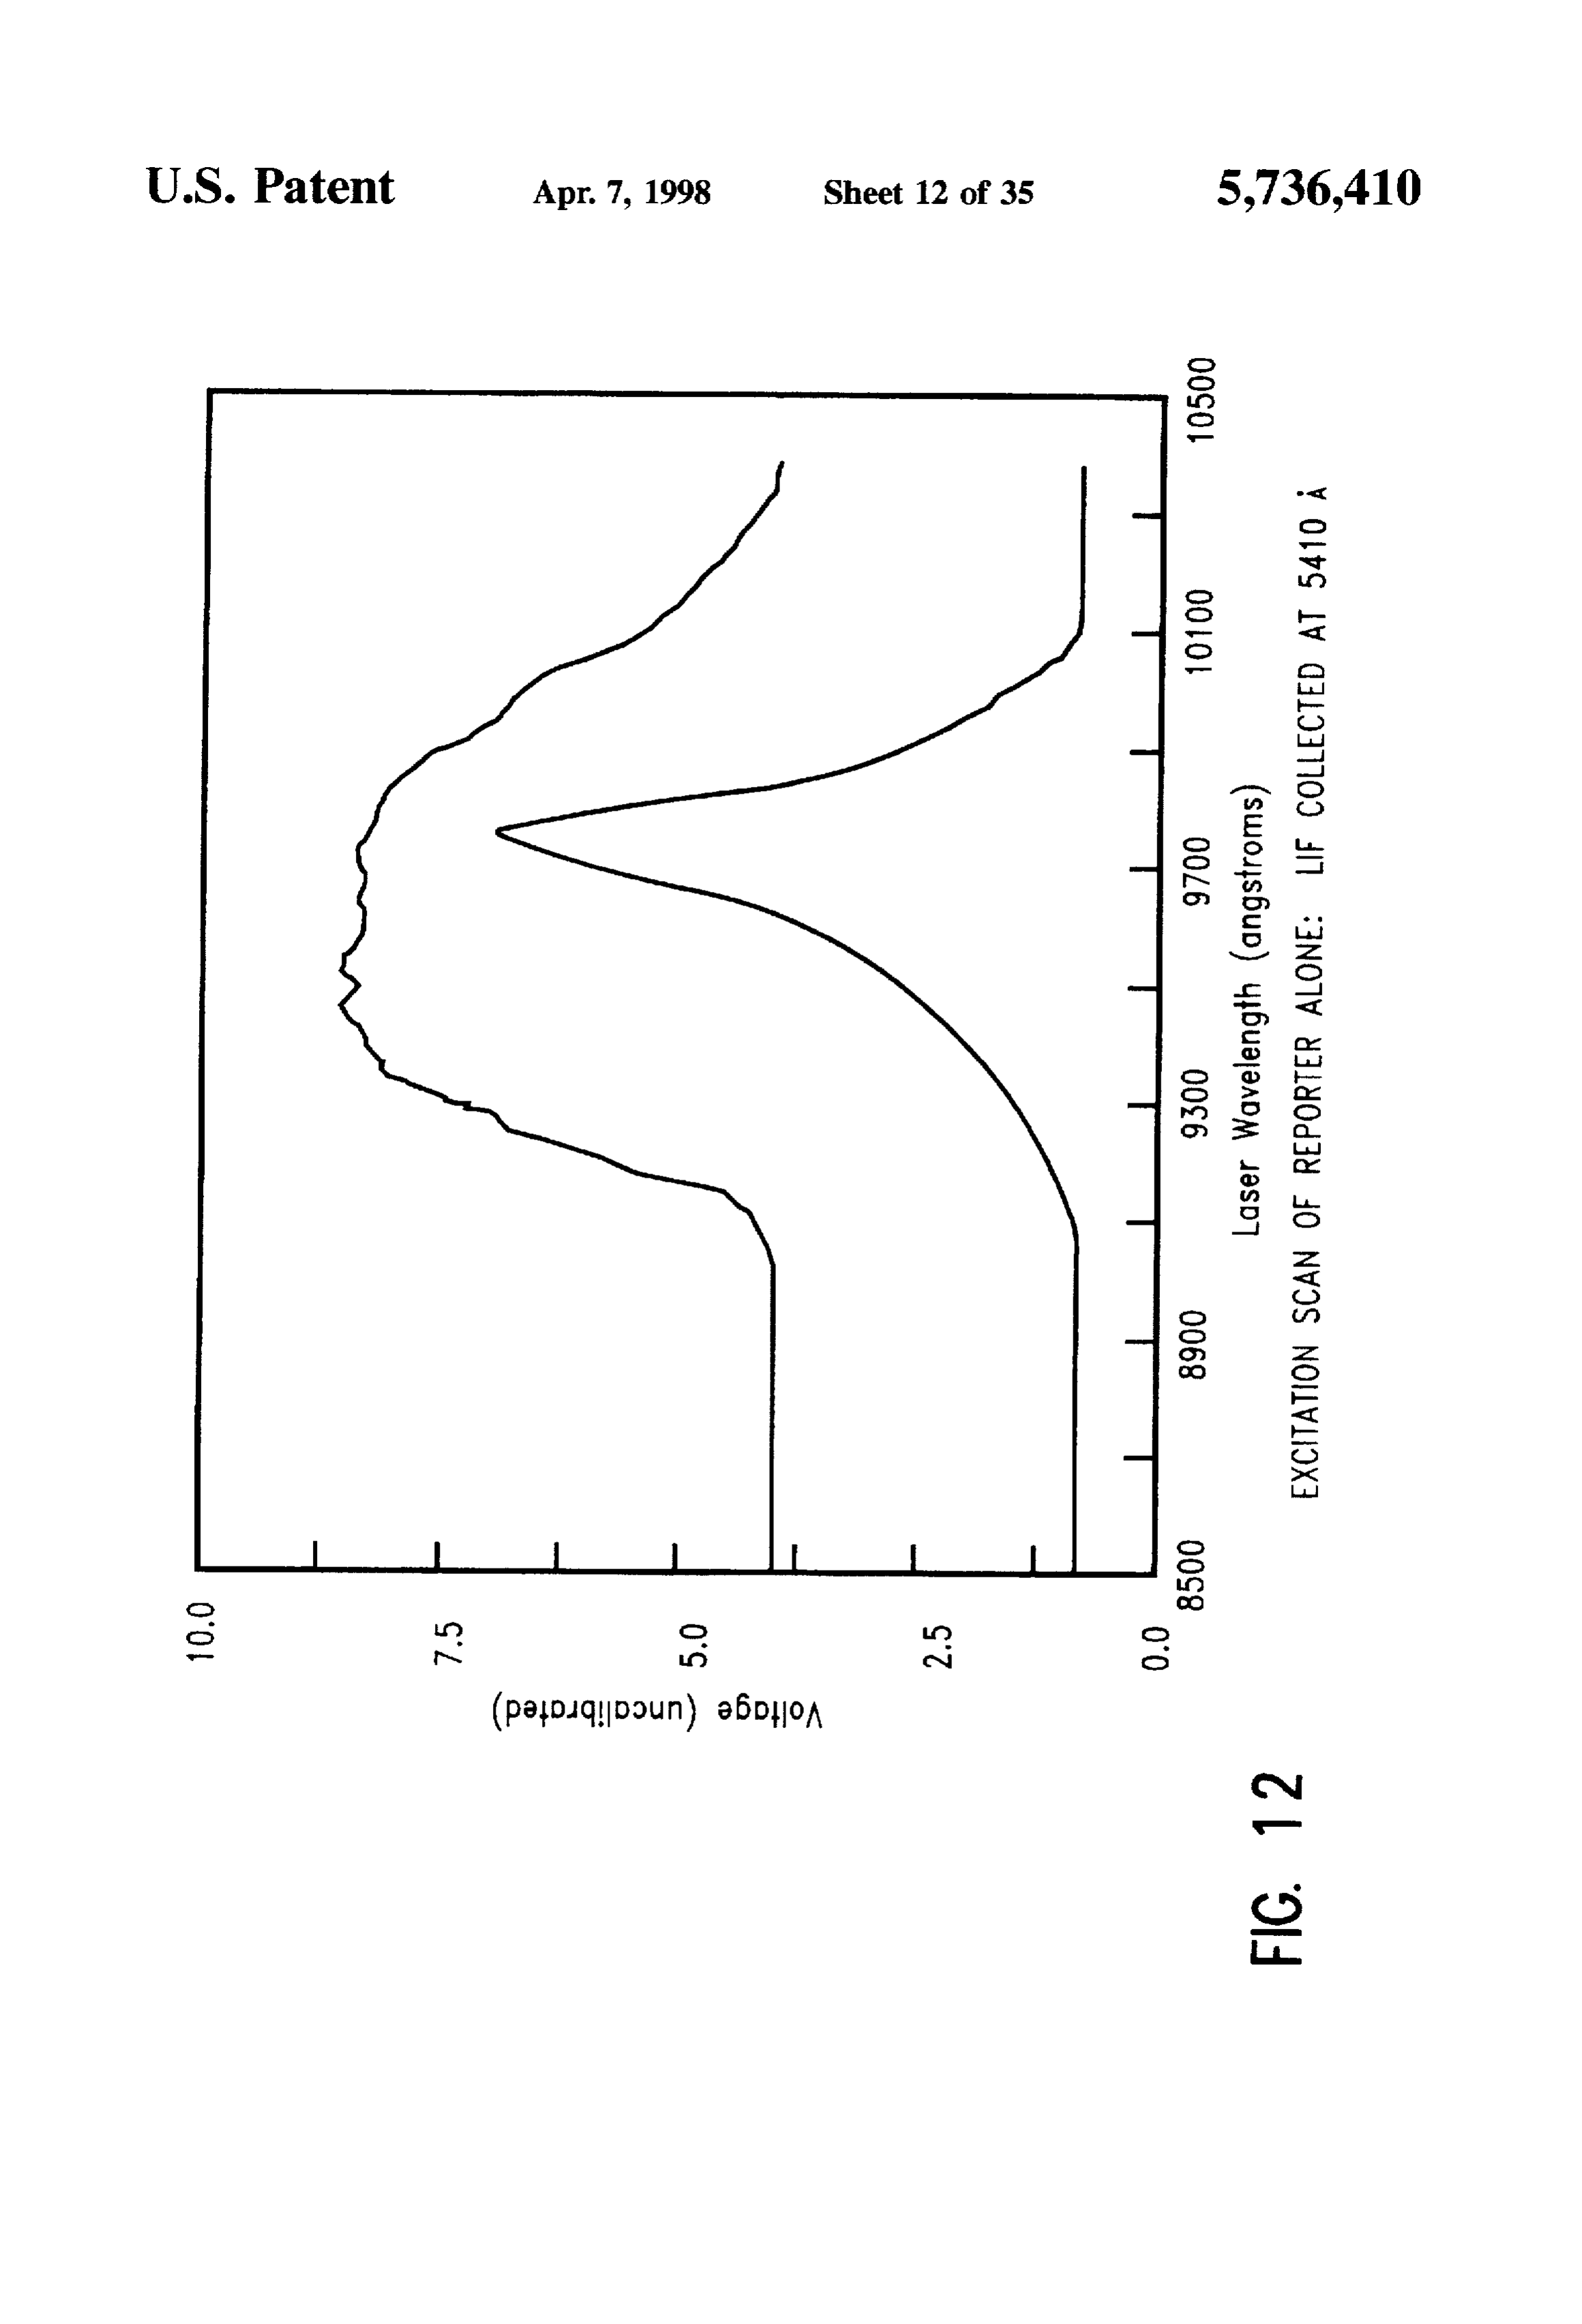
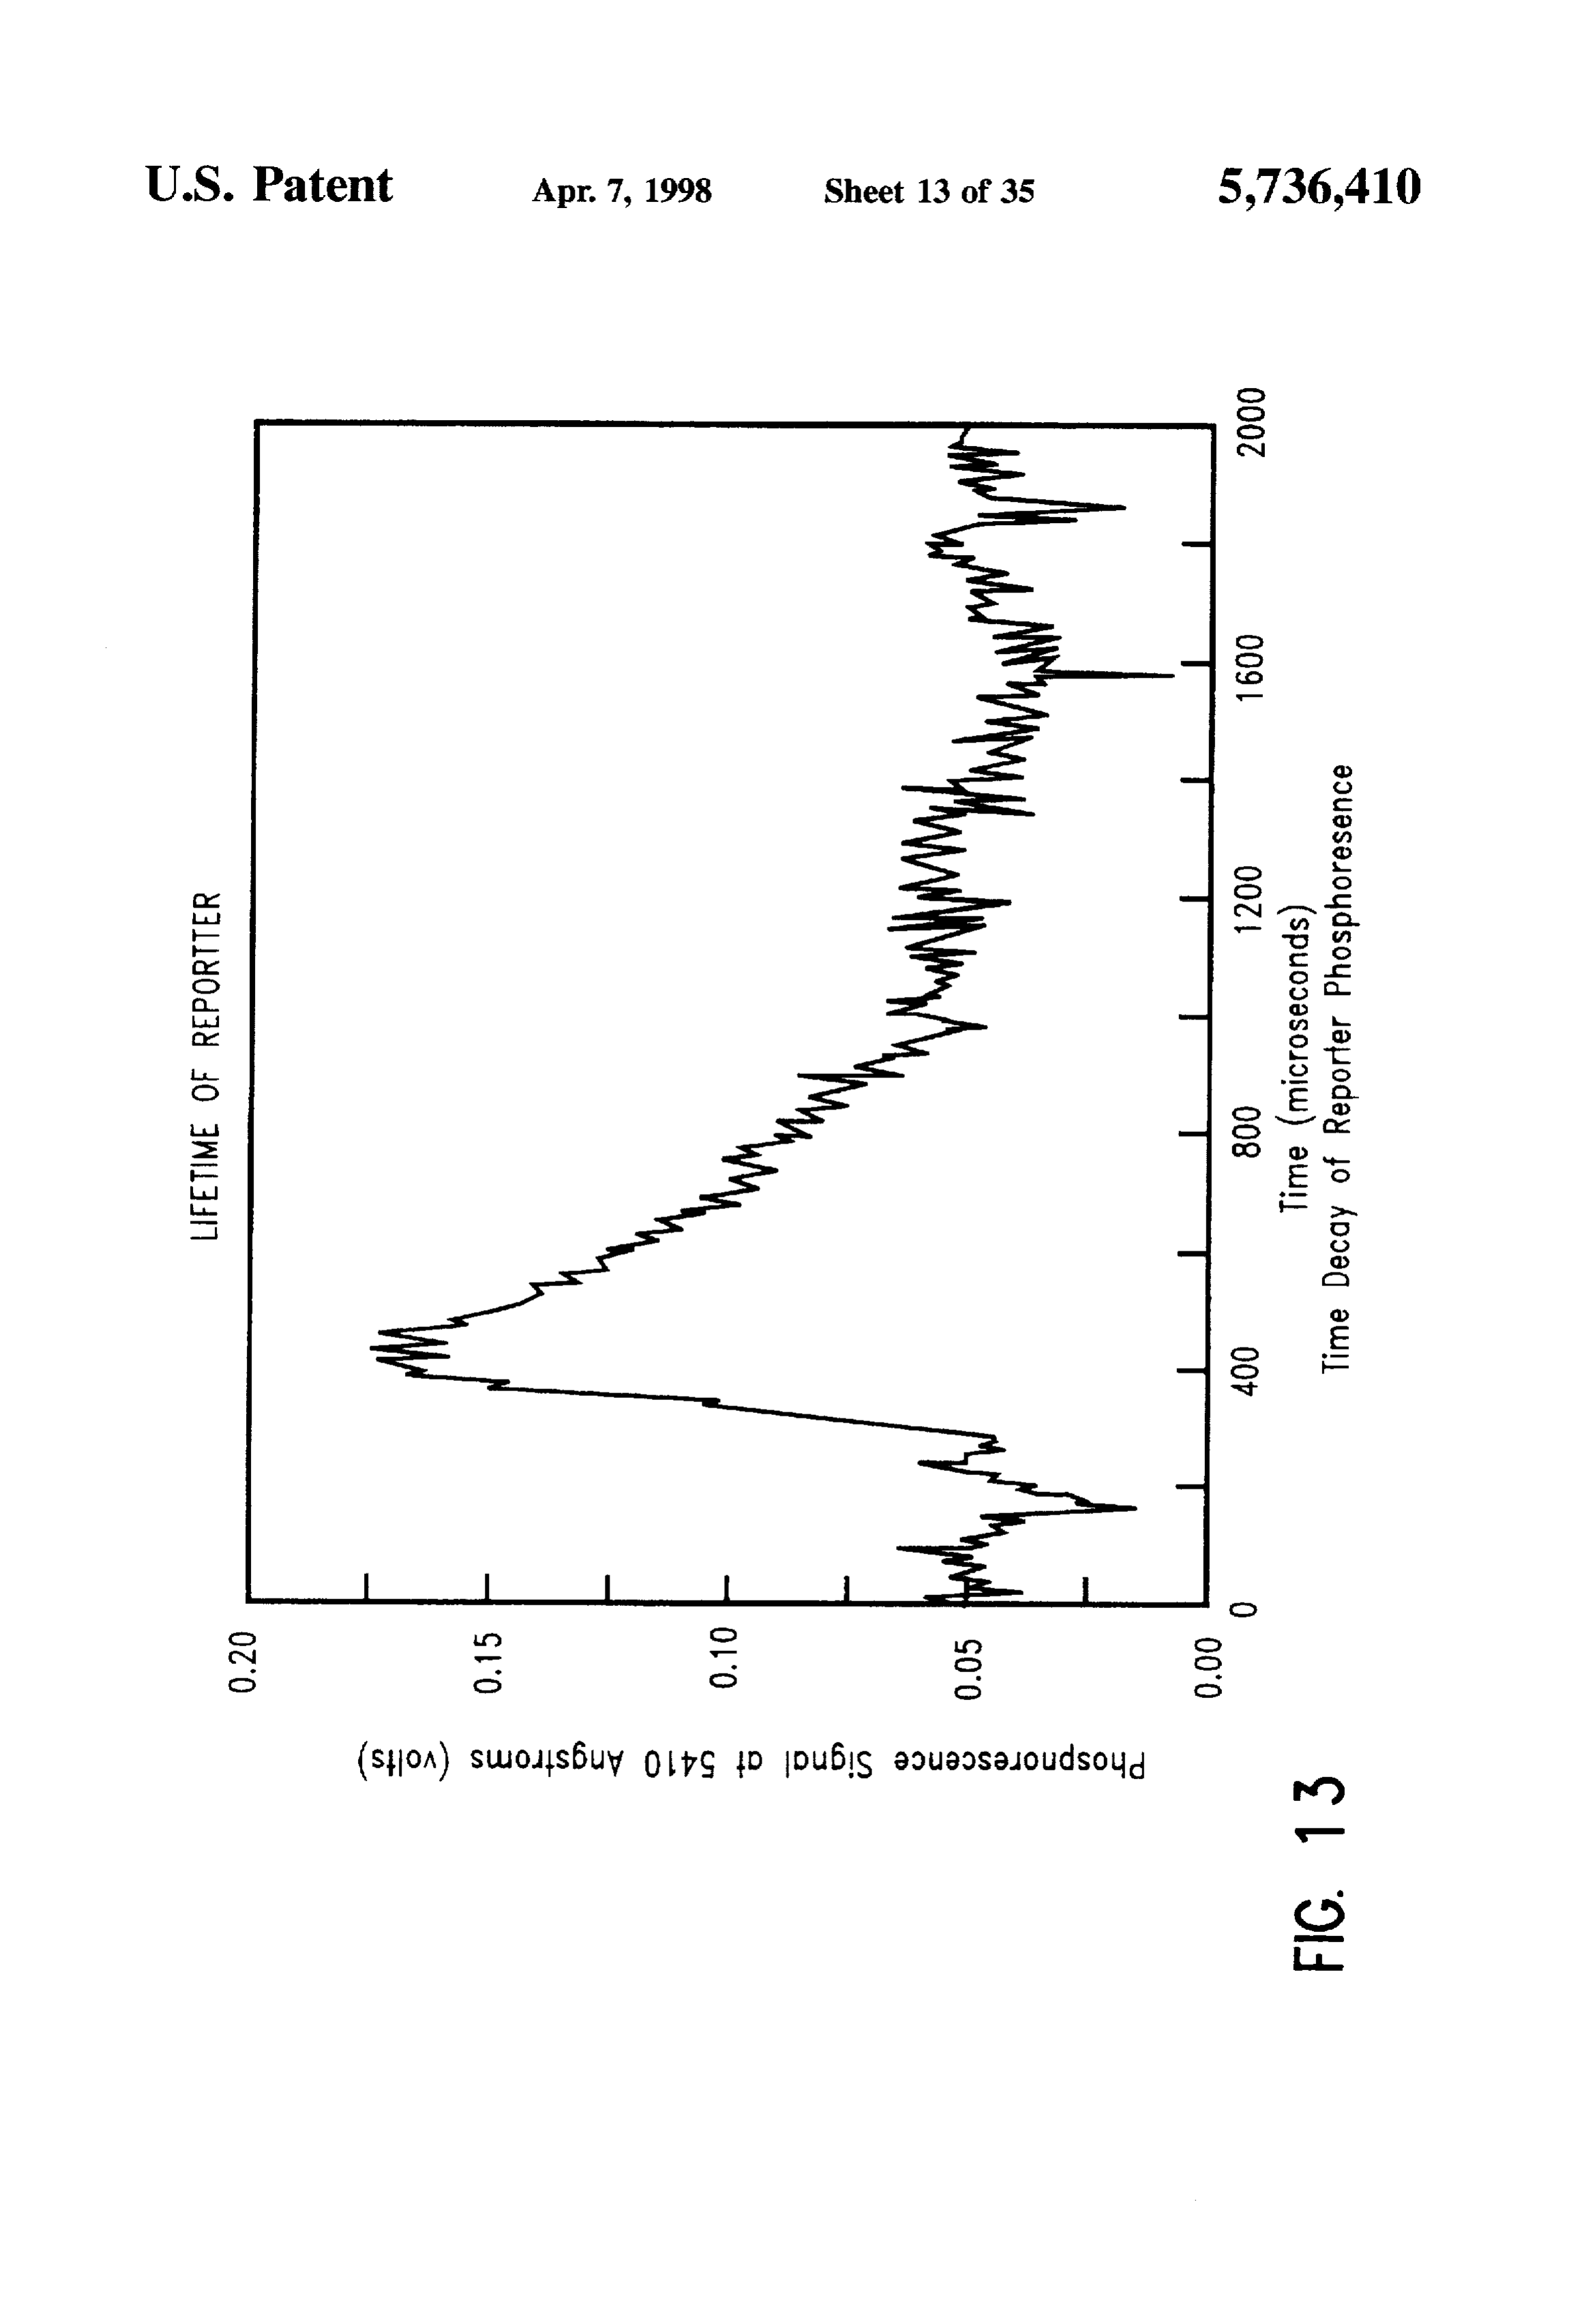
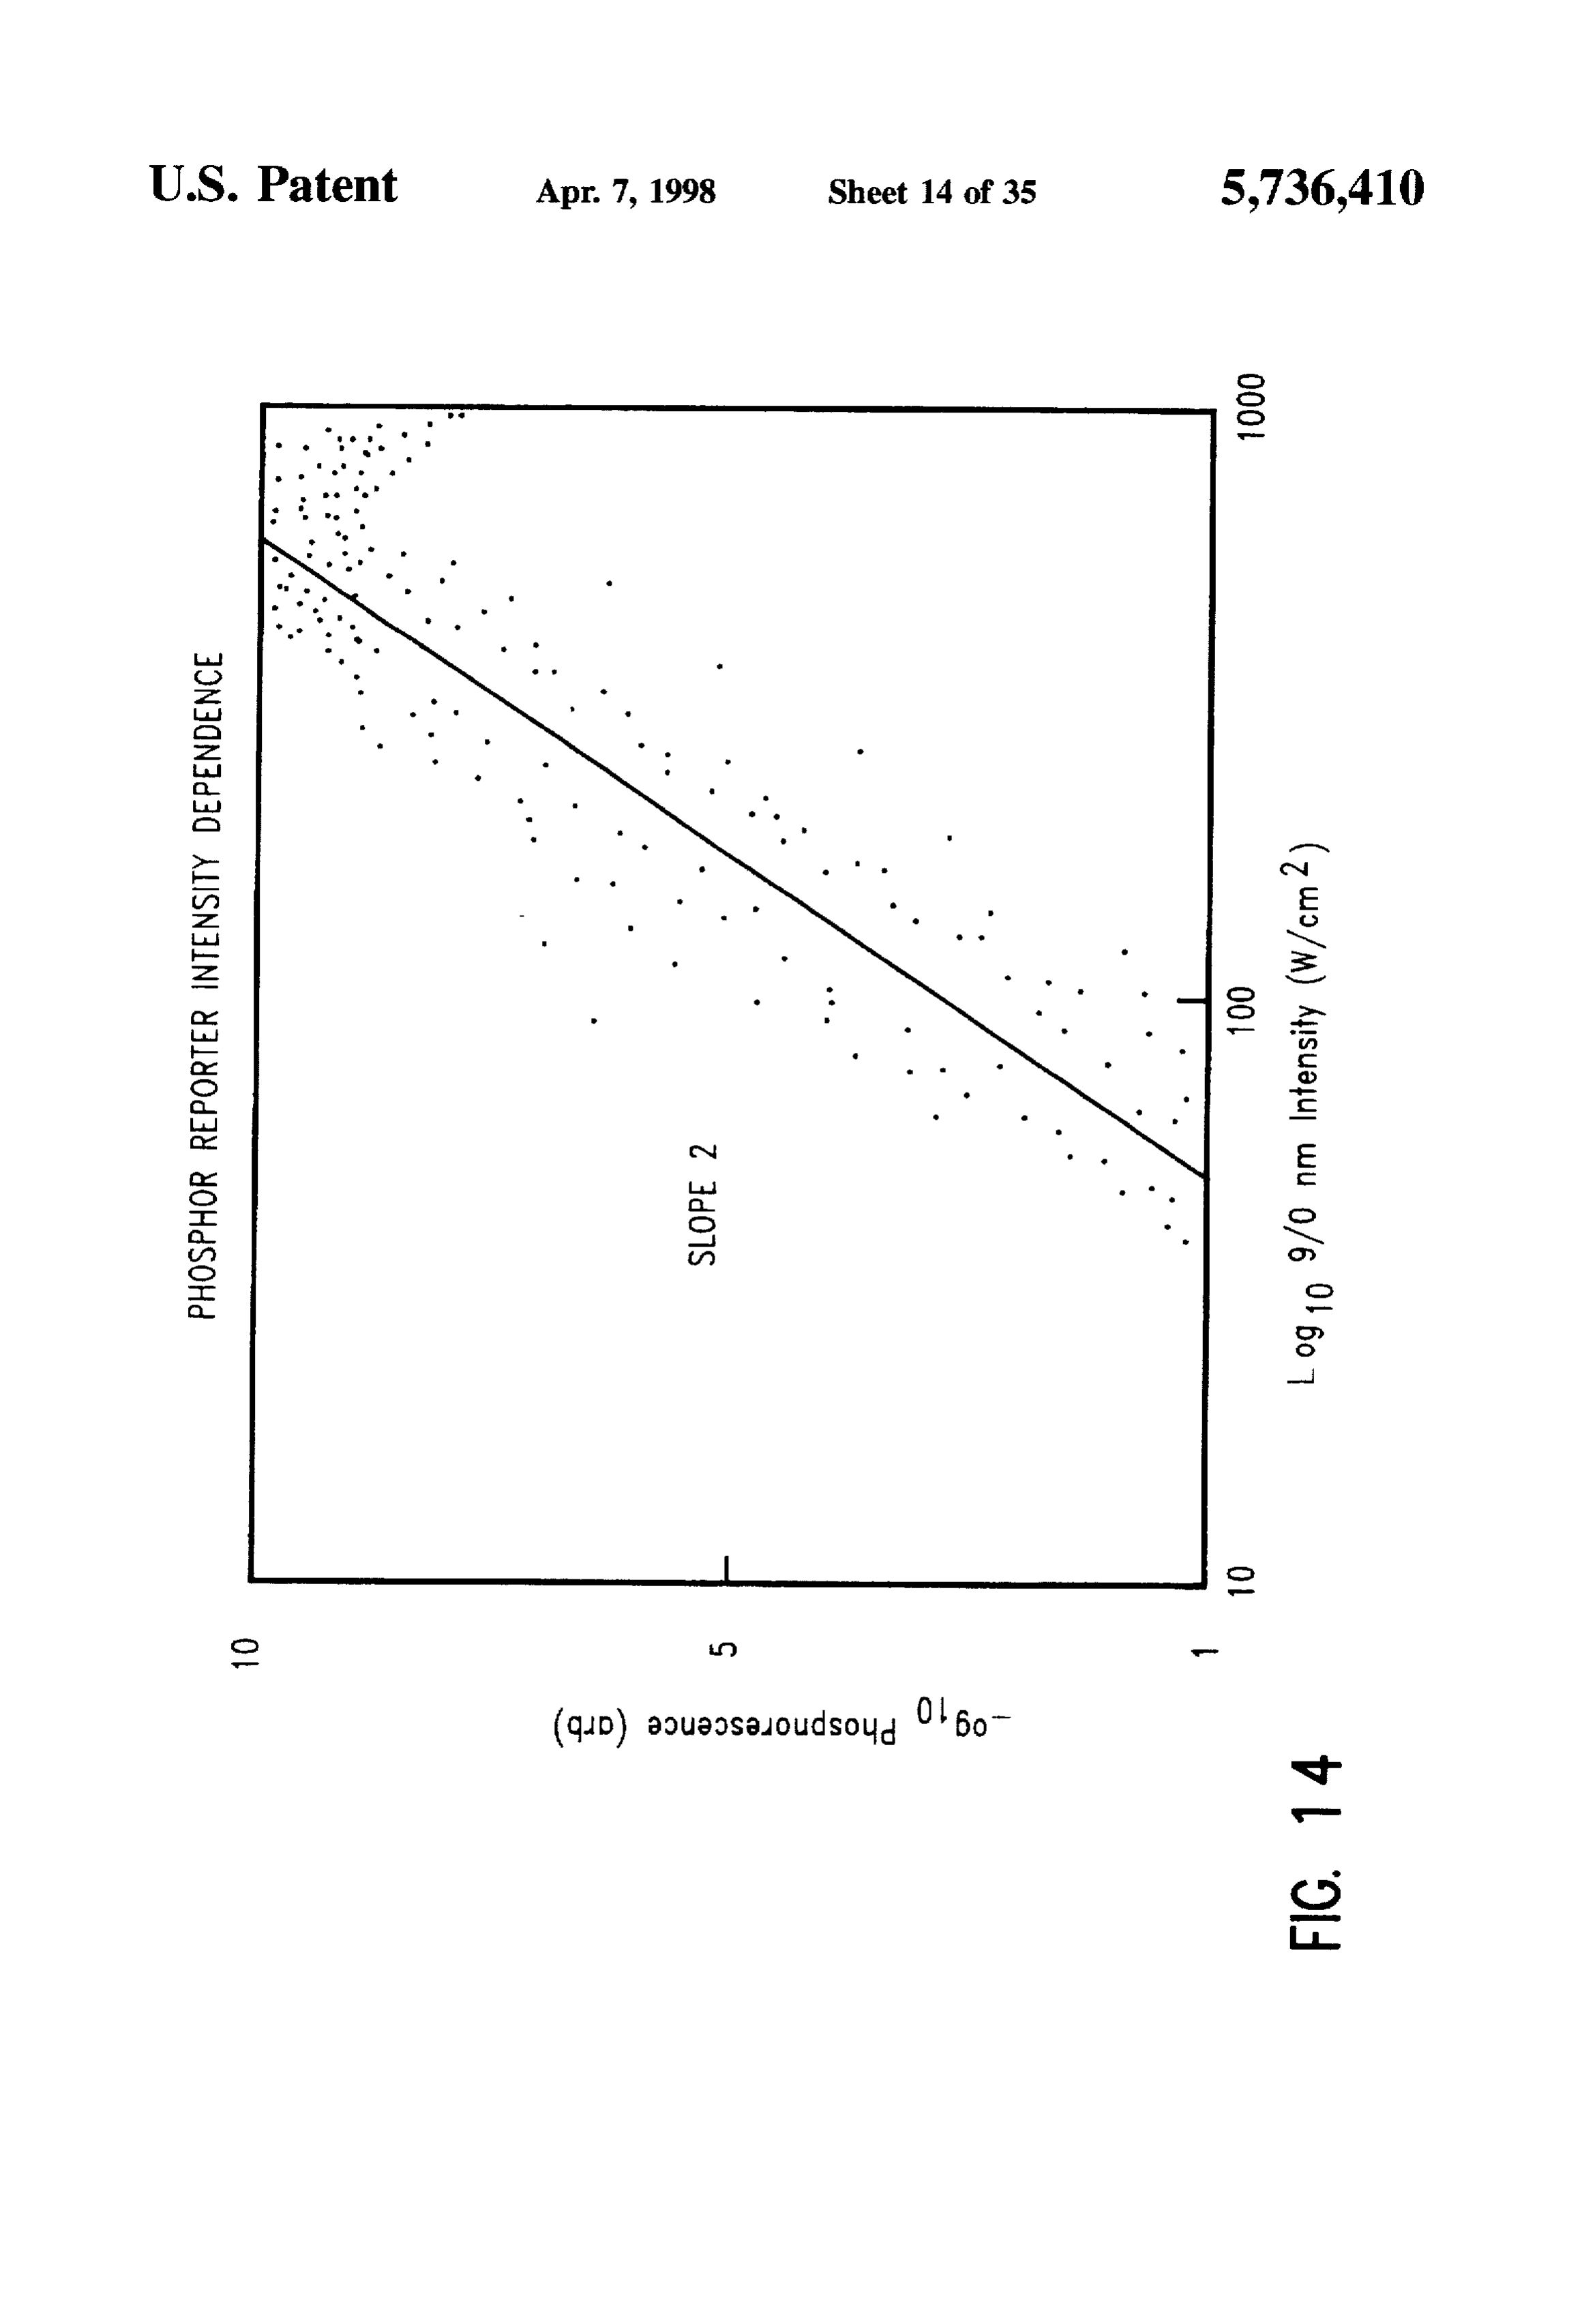
sample. The assay methods are also useful for monitoring FIG. 12 is an excitation scan of the sodium yttrium the progress of a reaction, such as a physical, chemical. fluoride-ytterbium/erbium phosphor excitation spectrum, biochemical. or immunological reaction, including binding with emission collection window set at 541.0 nmi; reactions. For example, the invention may be used to moni FIG. 13 is a time-decay measurement of the phosphor tor the progress of ligand-binding reactions, polynucleotide luminescence at 541 nm after termination of excitation hybridization reactions, including hybridization kinetics and illumination for sodium yttrium fluoride-ytterbium/erbium; thermodynamic stability of hybridized polynucleotides. 65 FIG. 14 shows the phosphor emission intensity as a The invention also provides methods, up-converting function of excitation illumination intensity for a sodium labels. and compositions of labeled binding reagents for yttrium fluoride-ytterbium/erbium phosphor;
Page 42
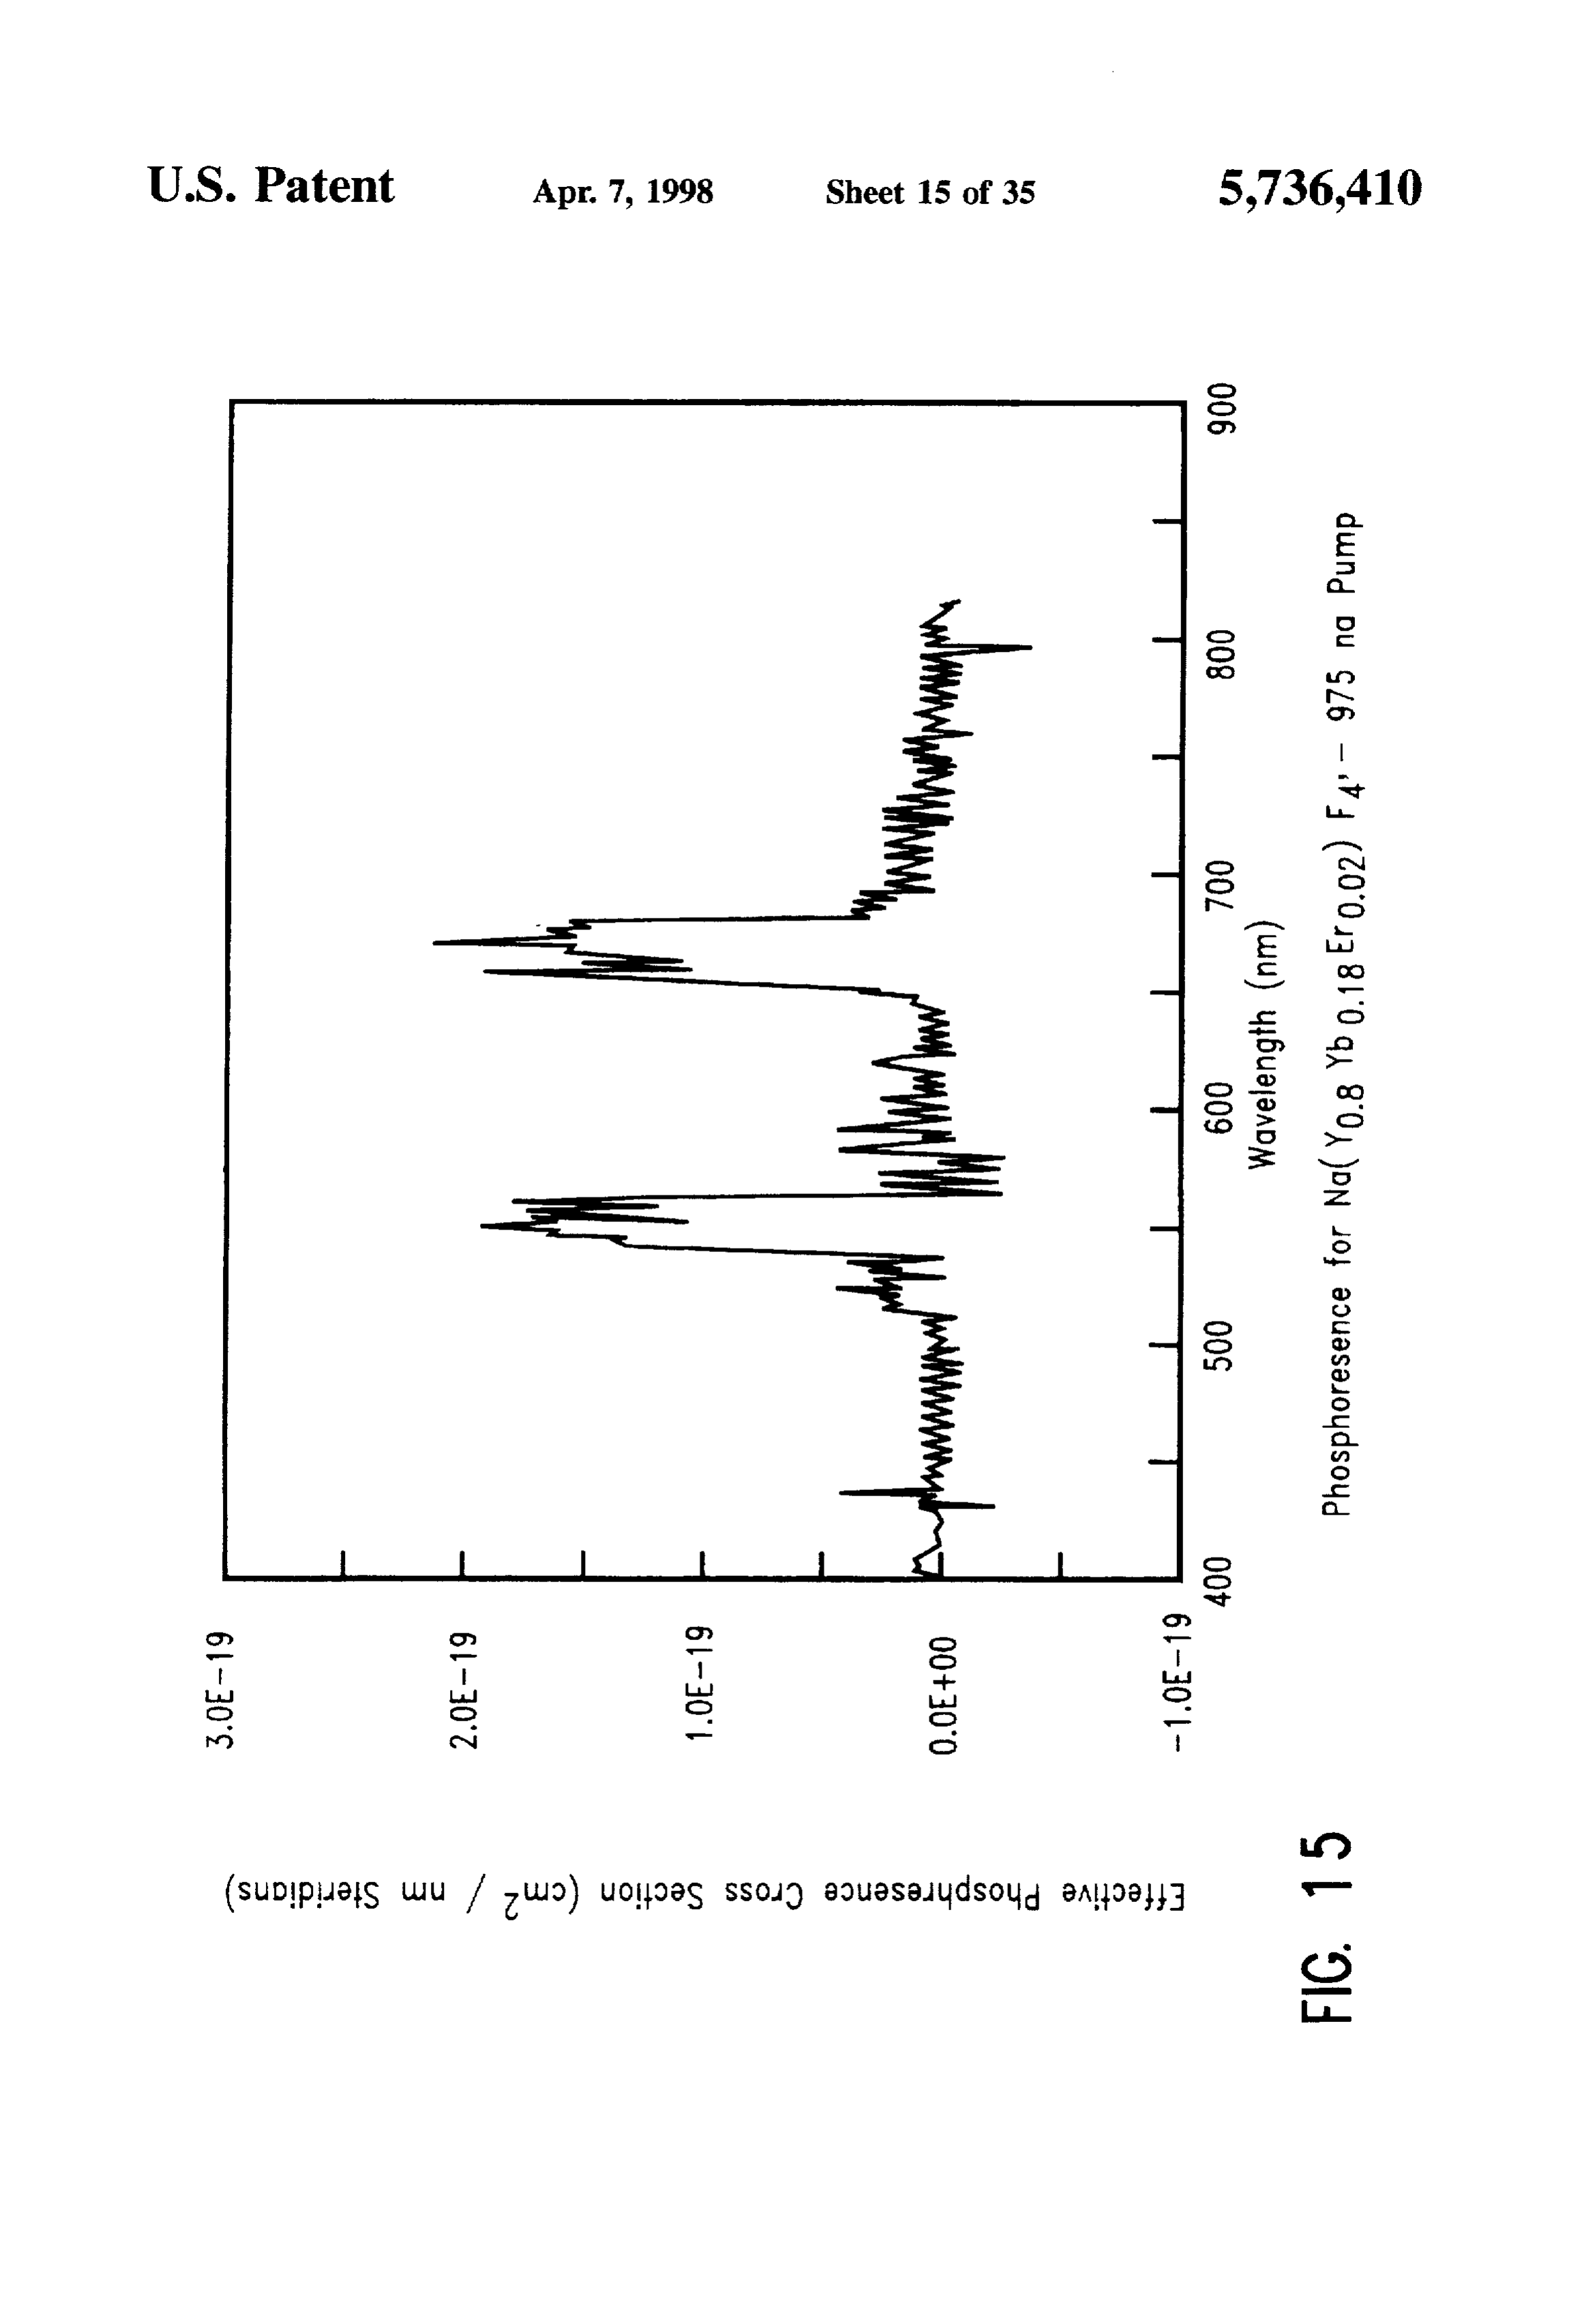
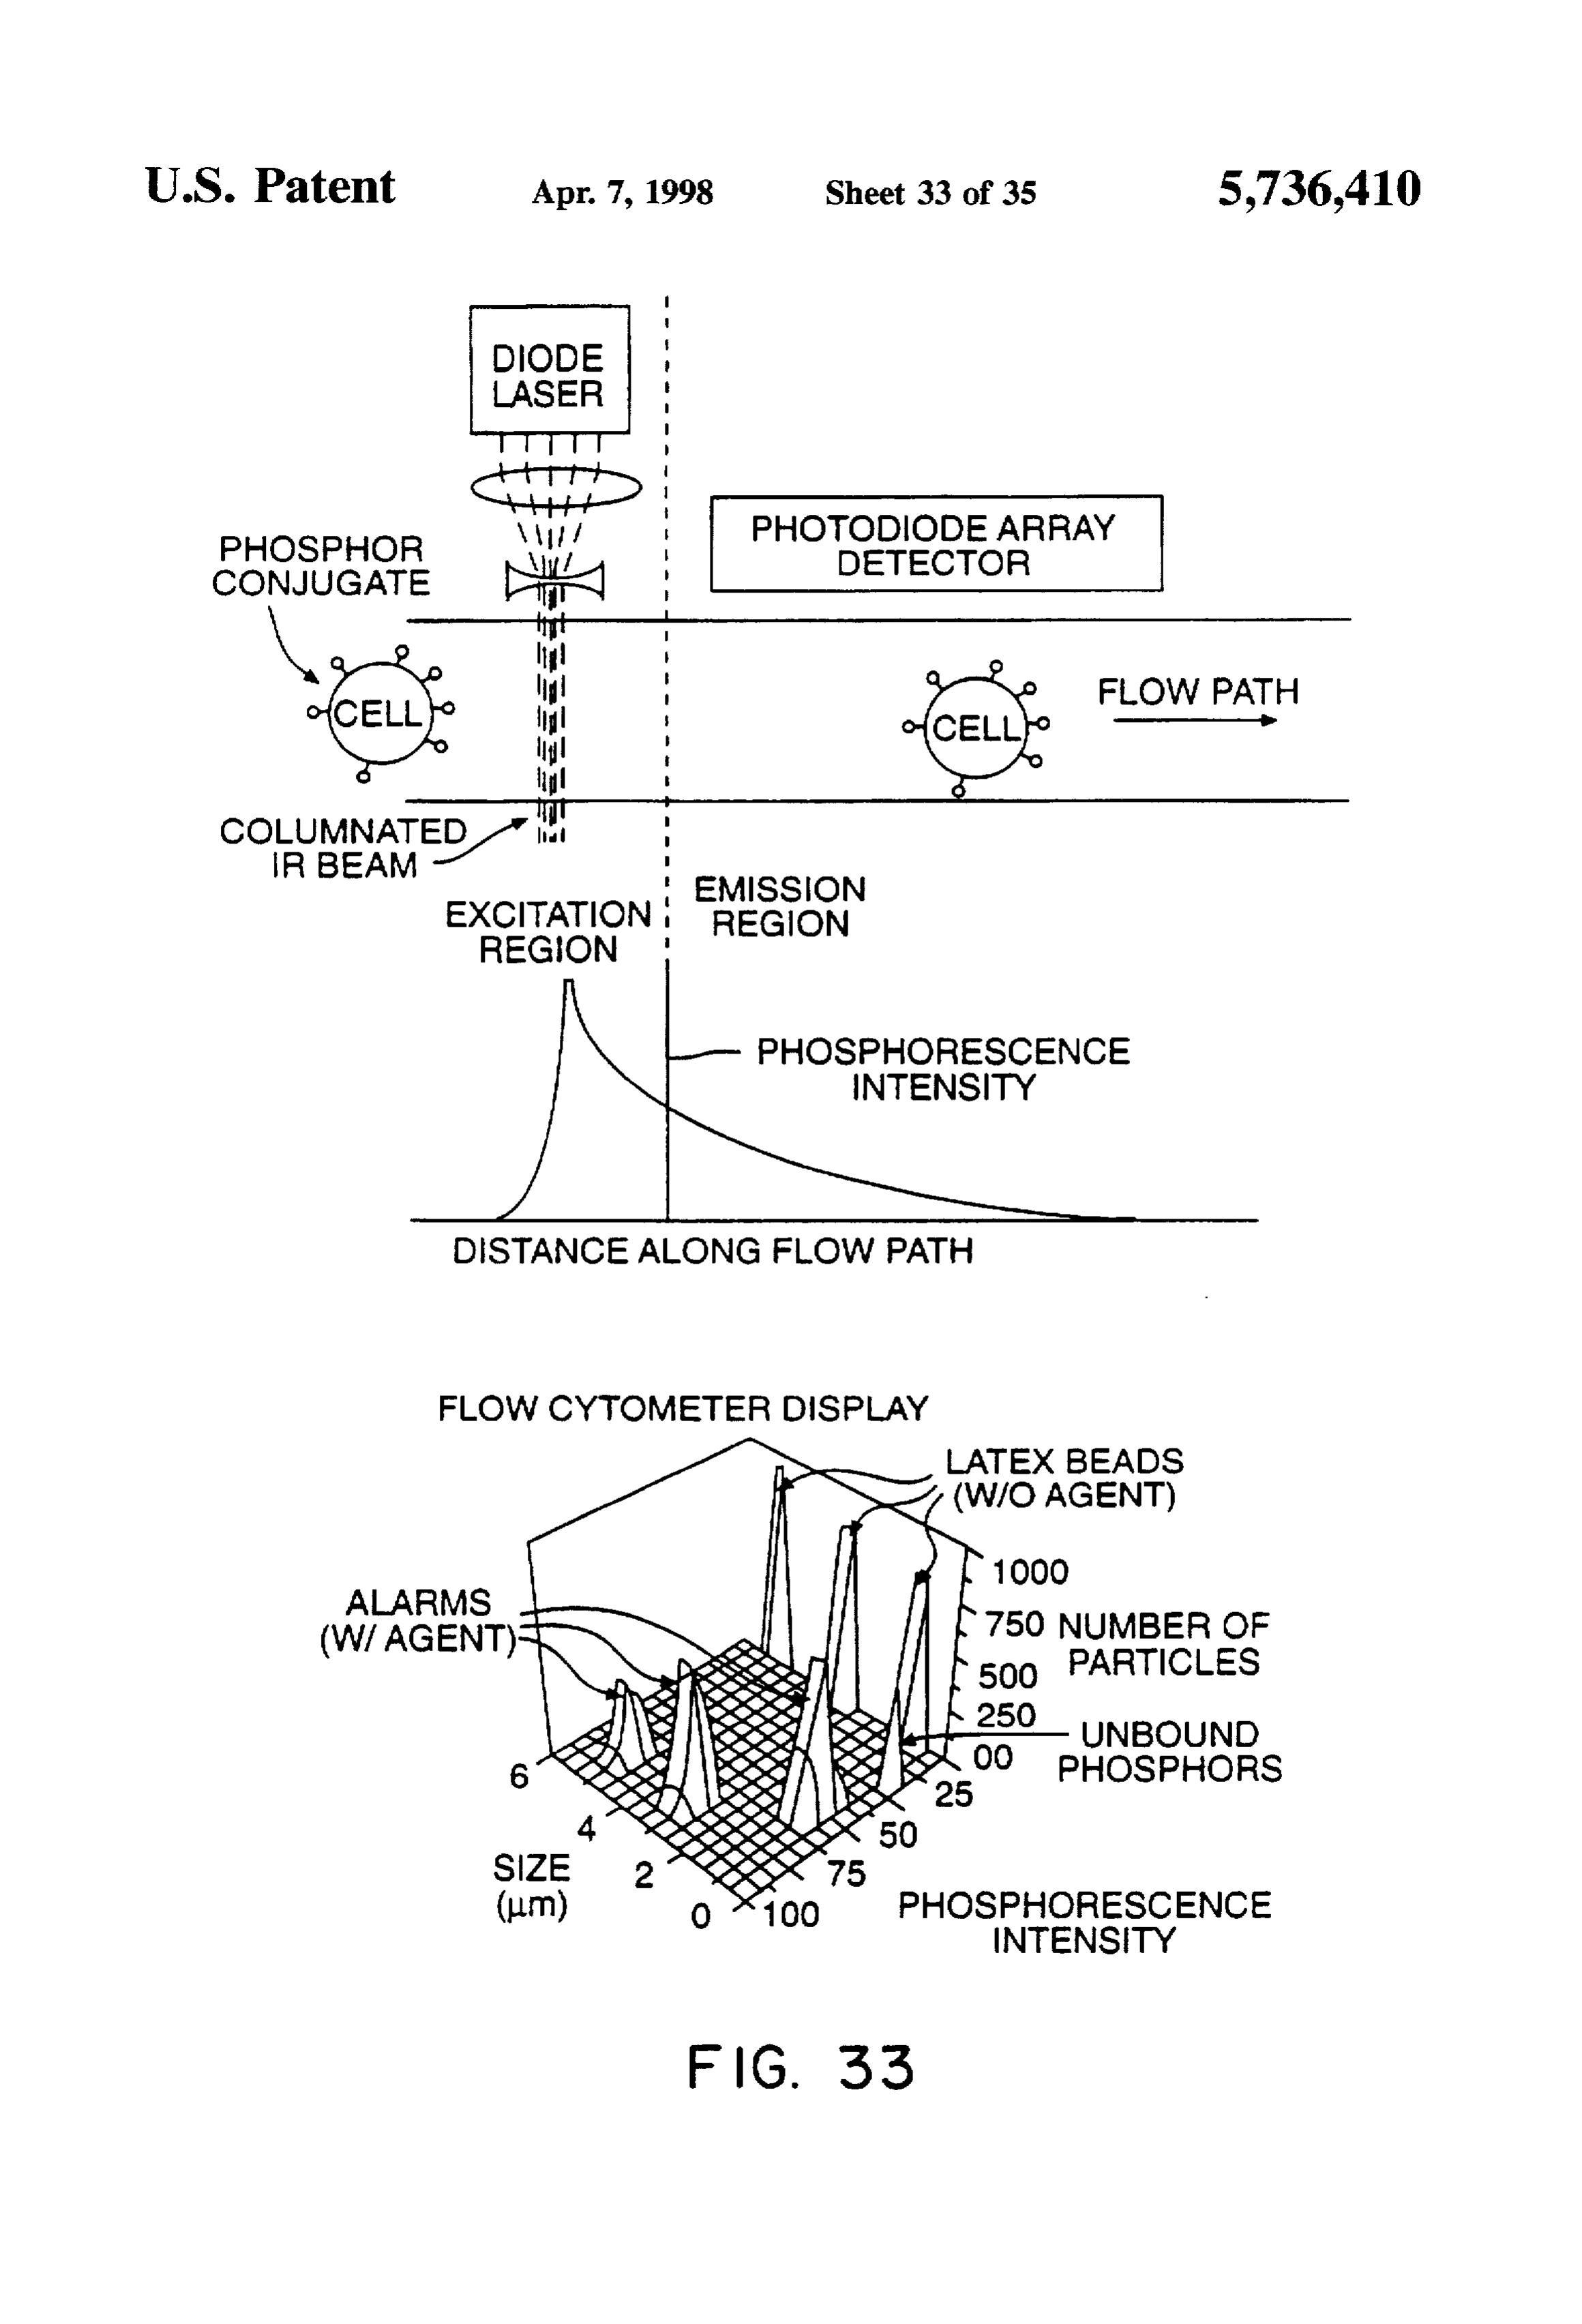
FIG. 15 shows effective single-photon phosphorescence FIG.33 shows a schematic example of a flow cytometry cross-section for 0.3 m particles of Na(YosYboEroos)F device.
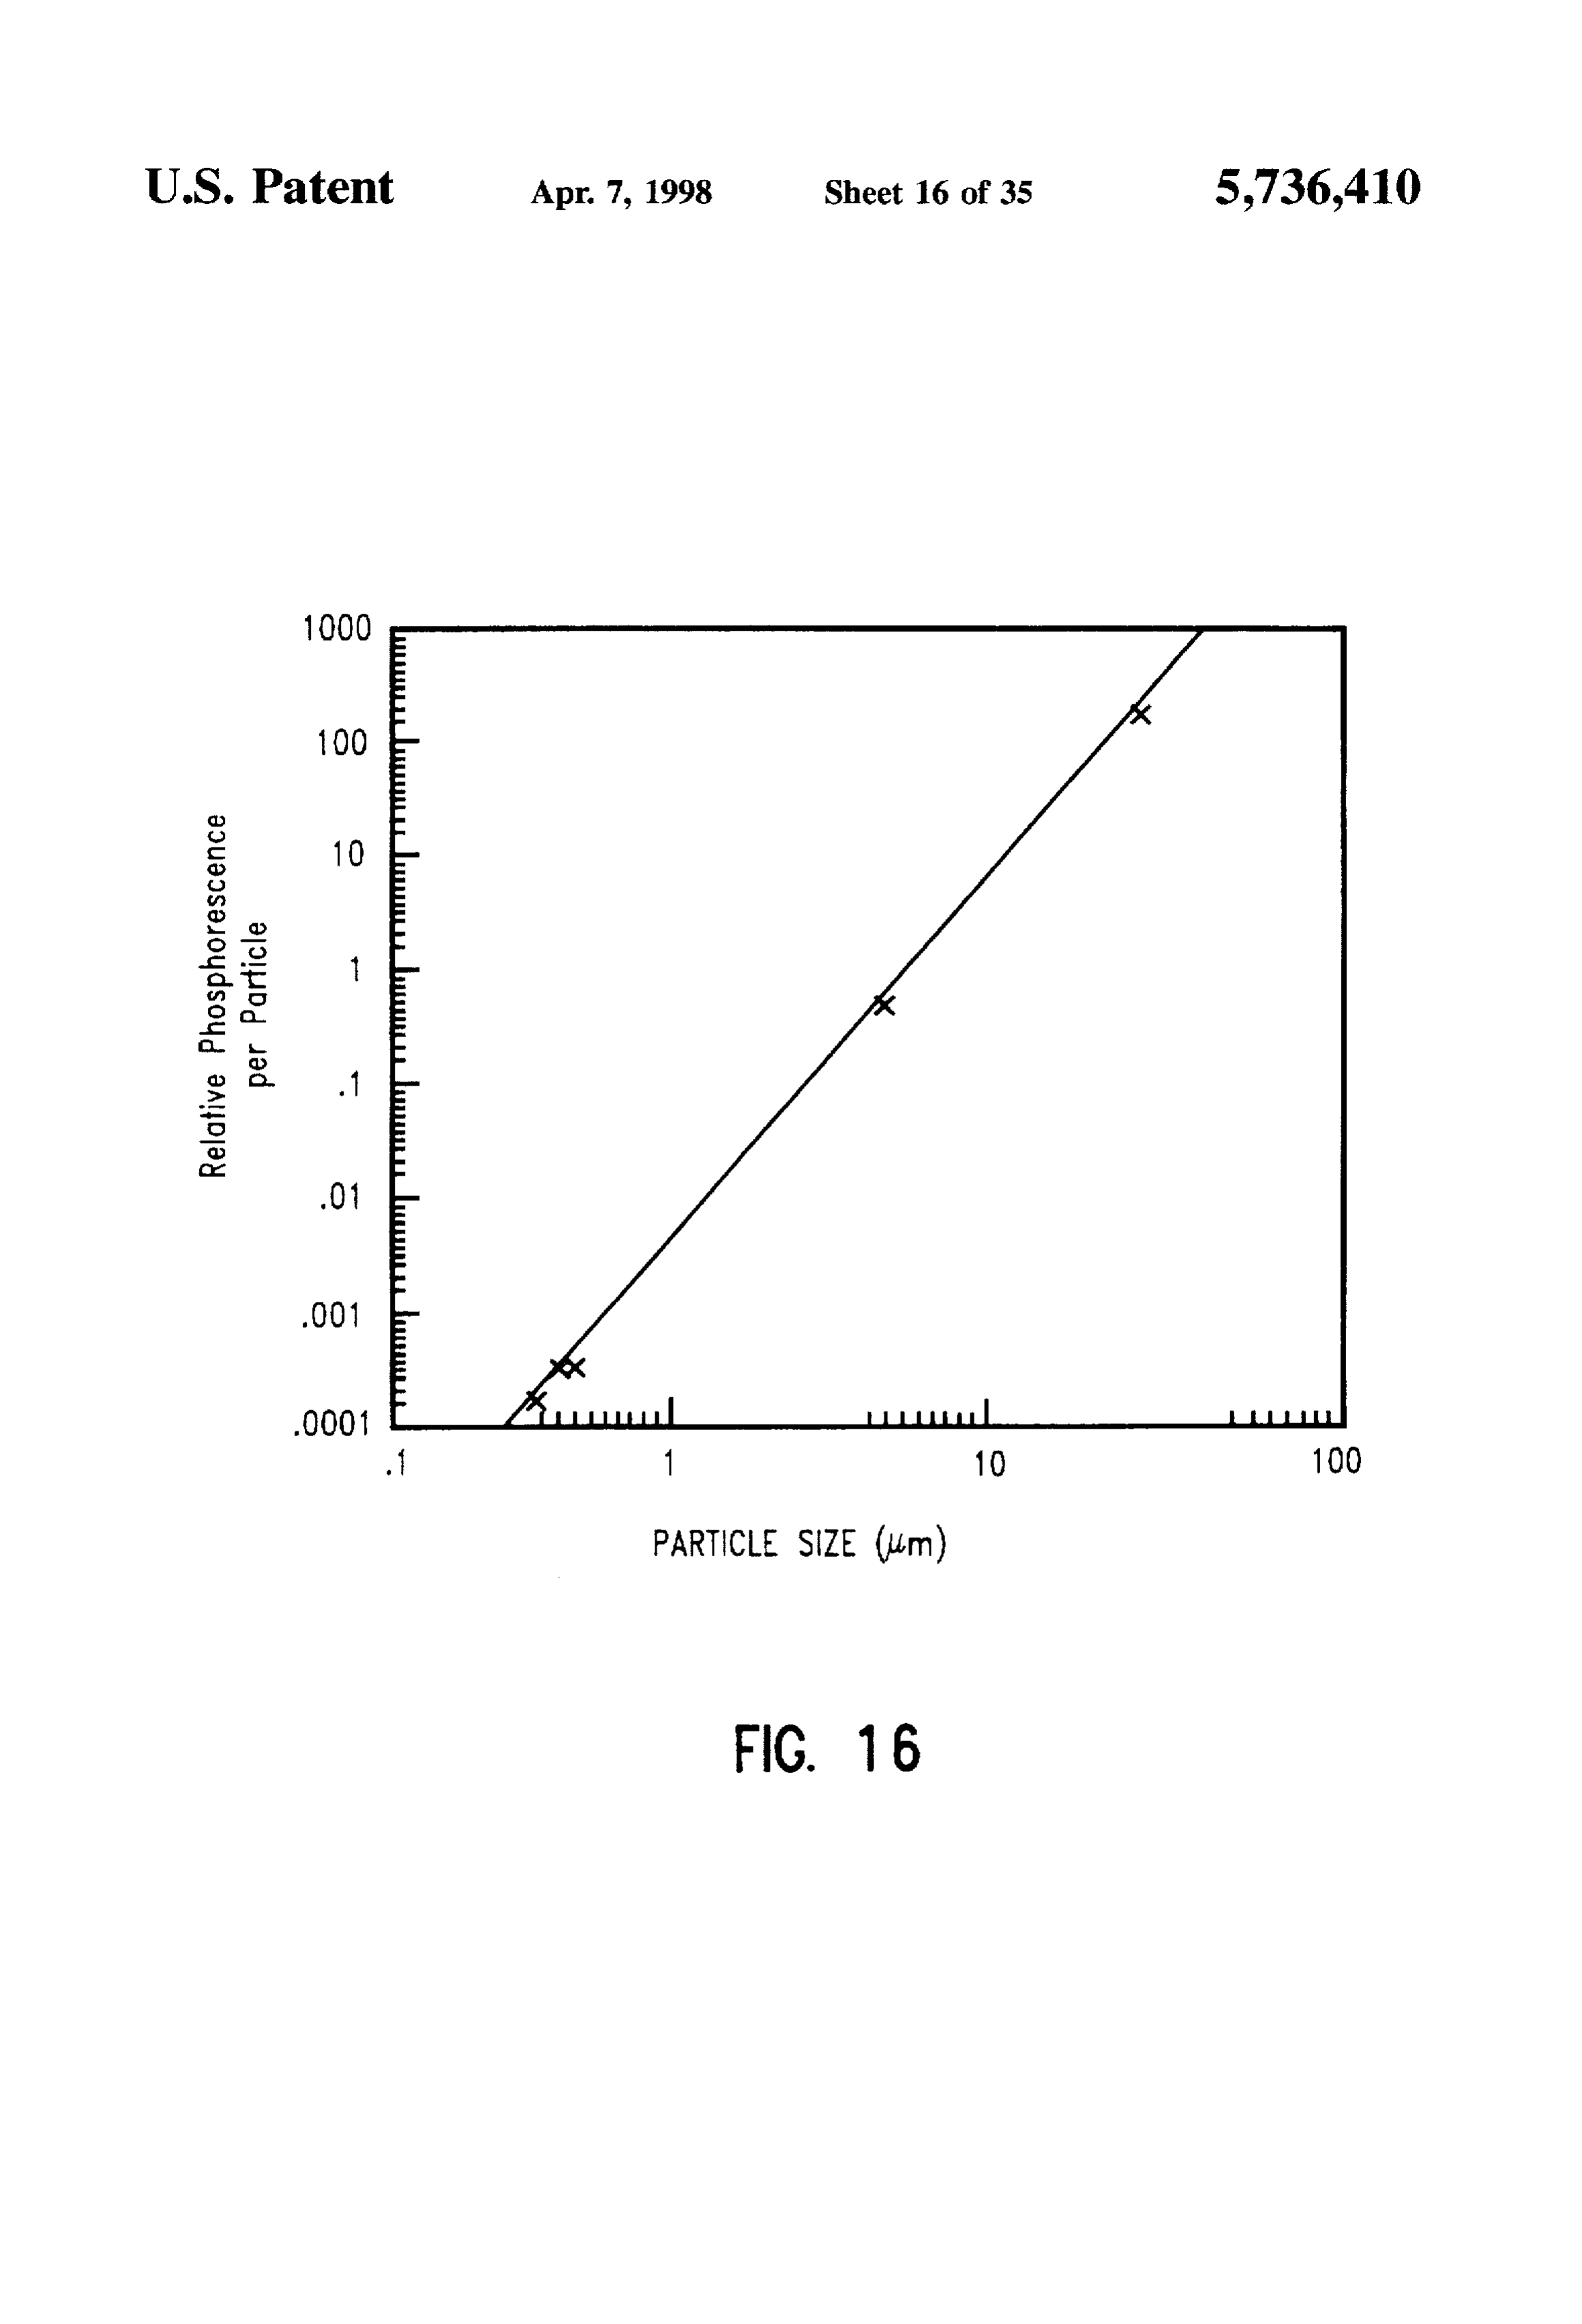
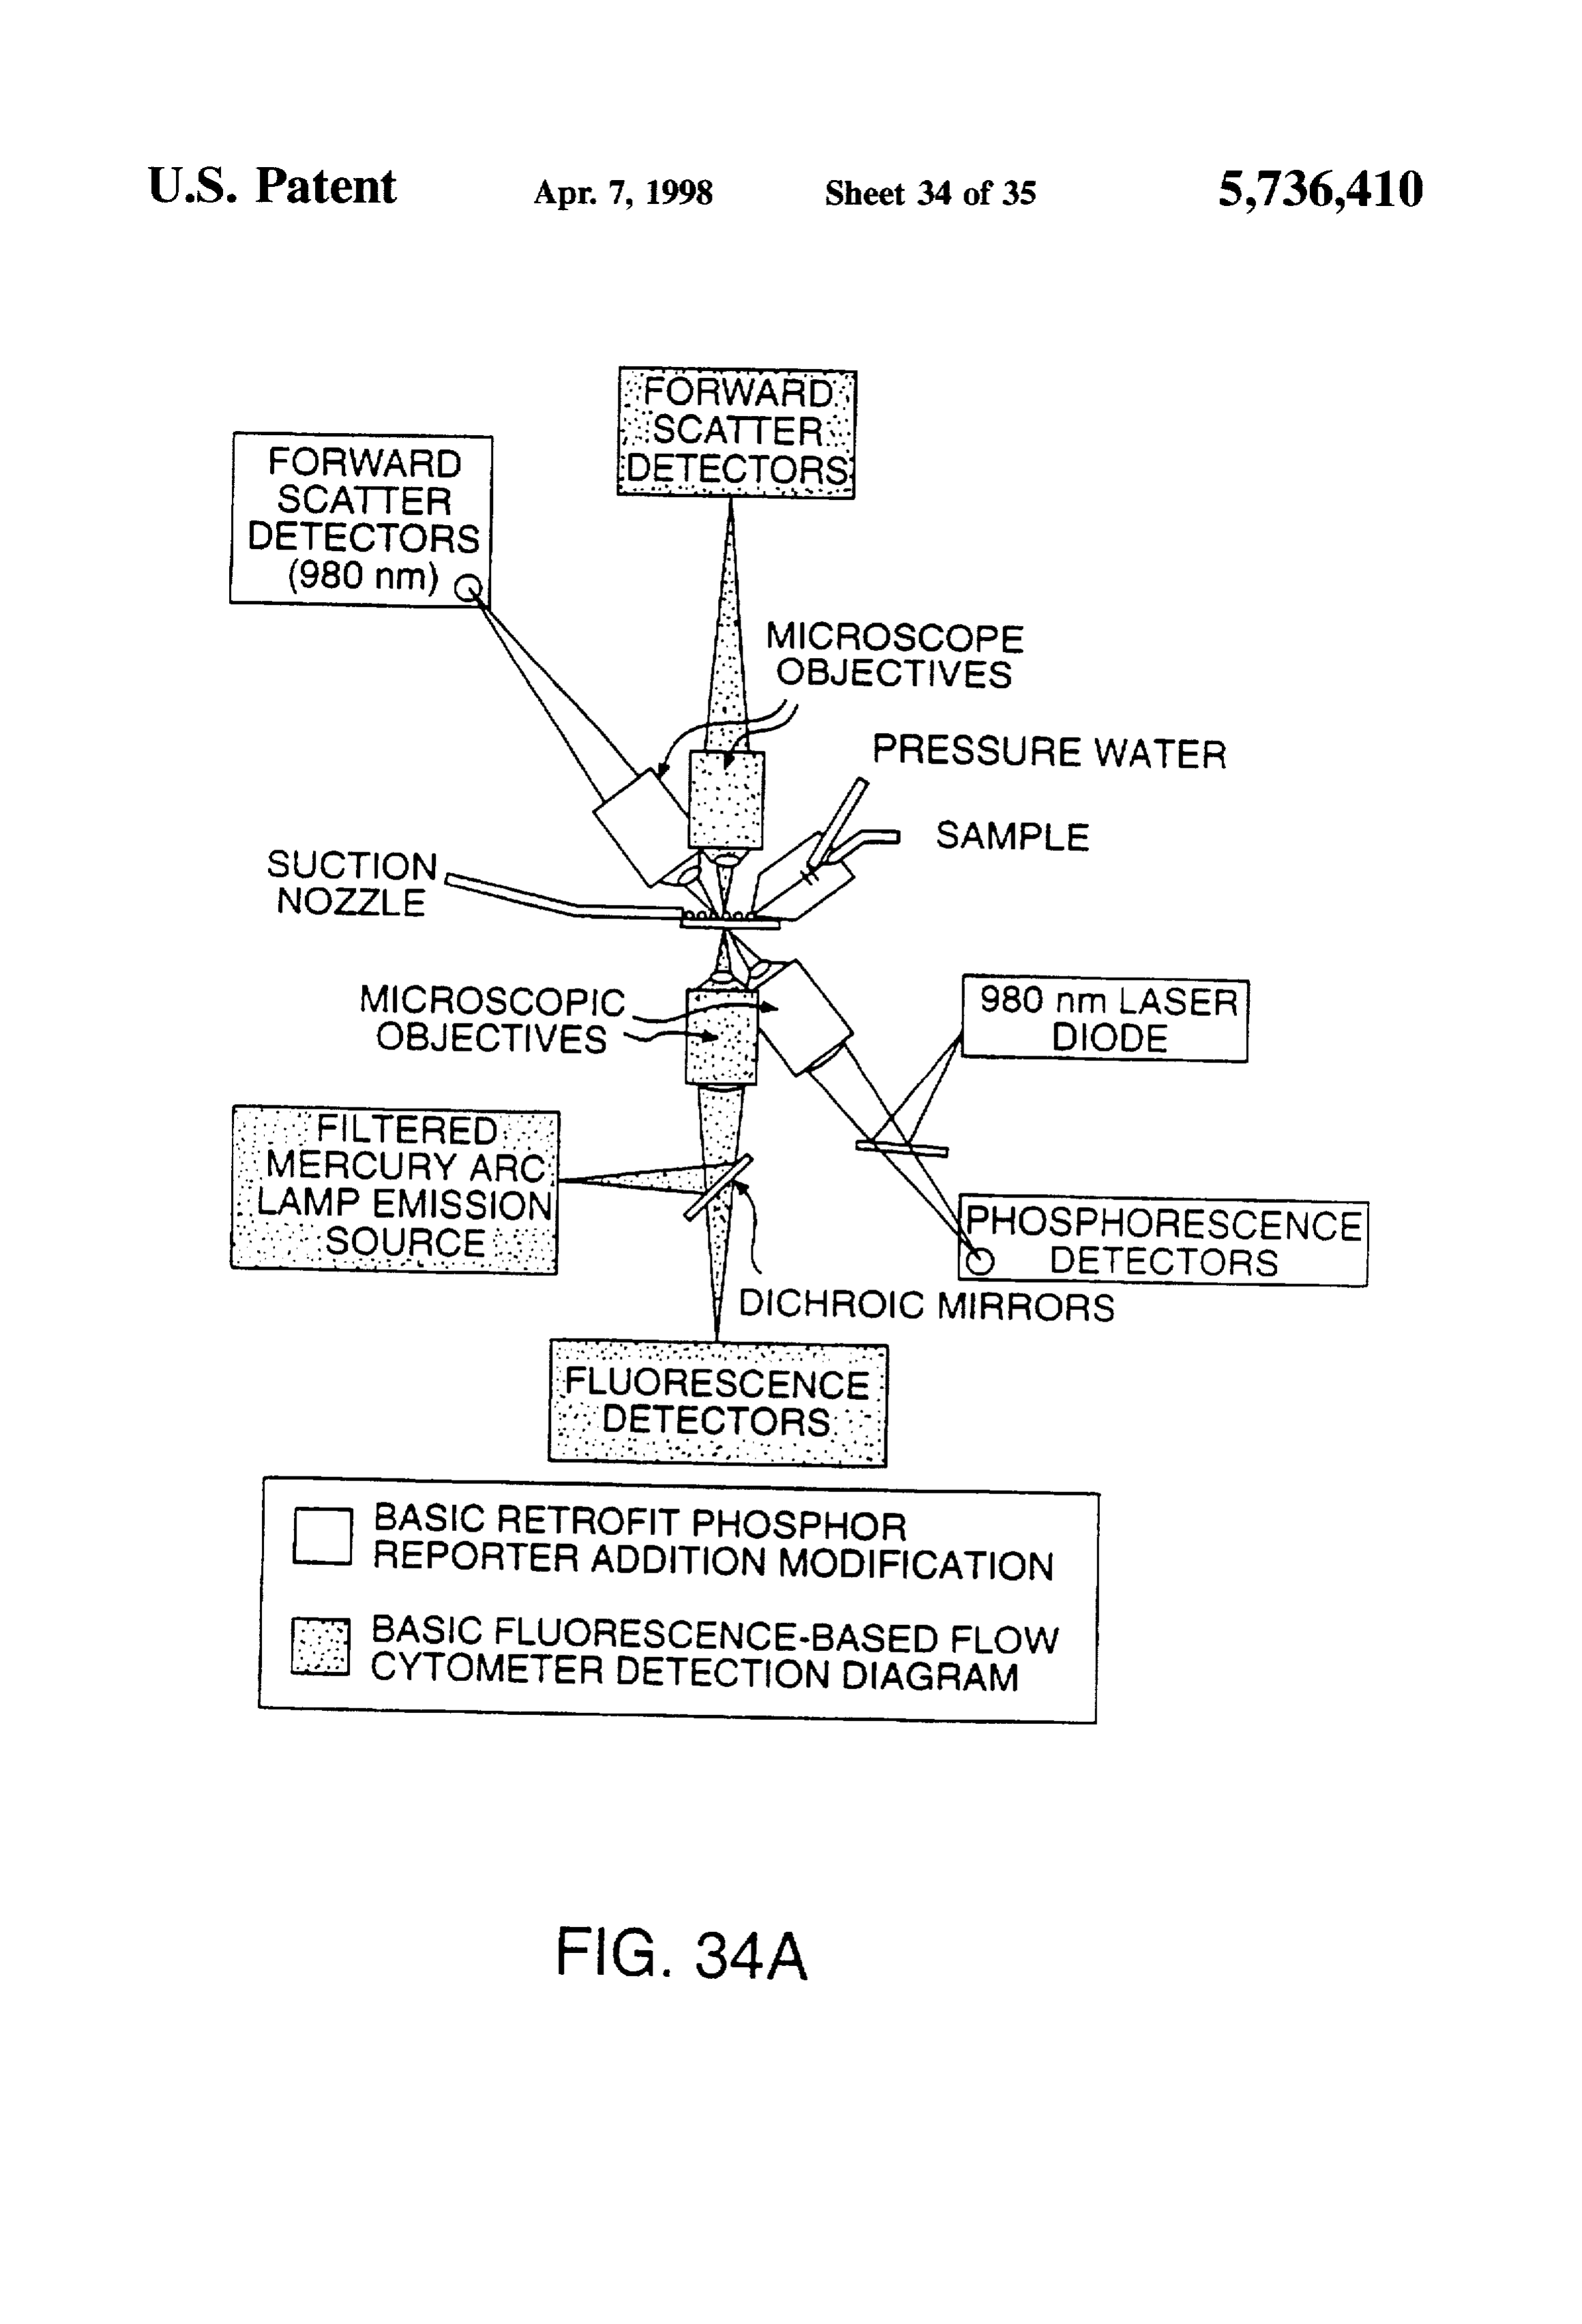
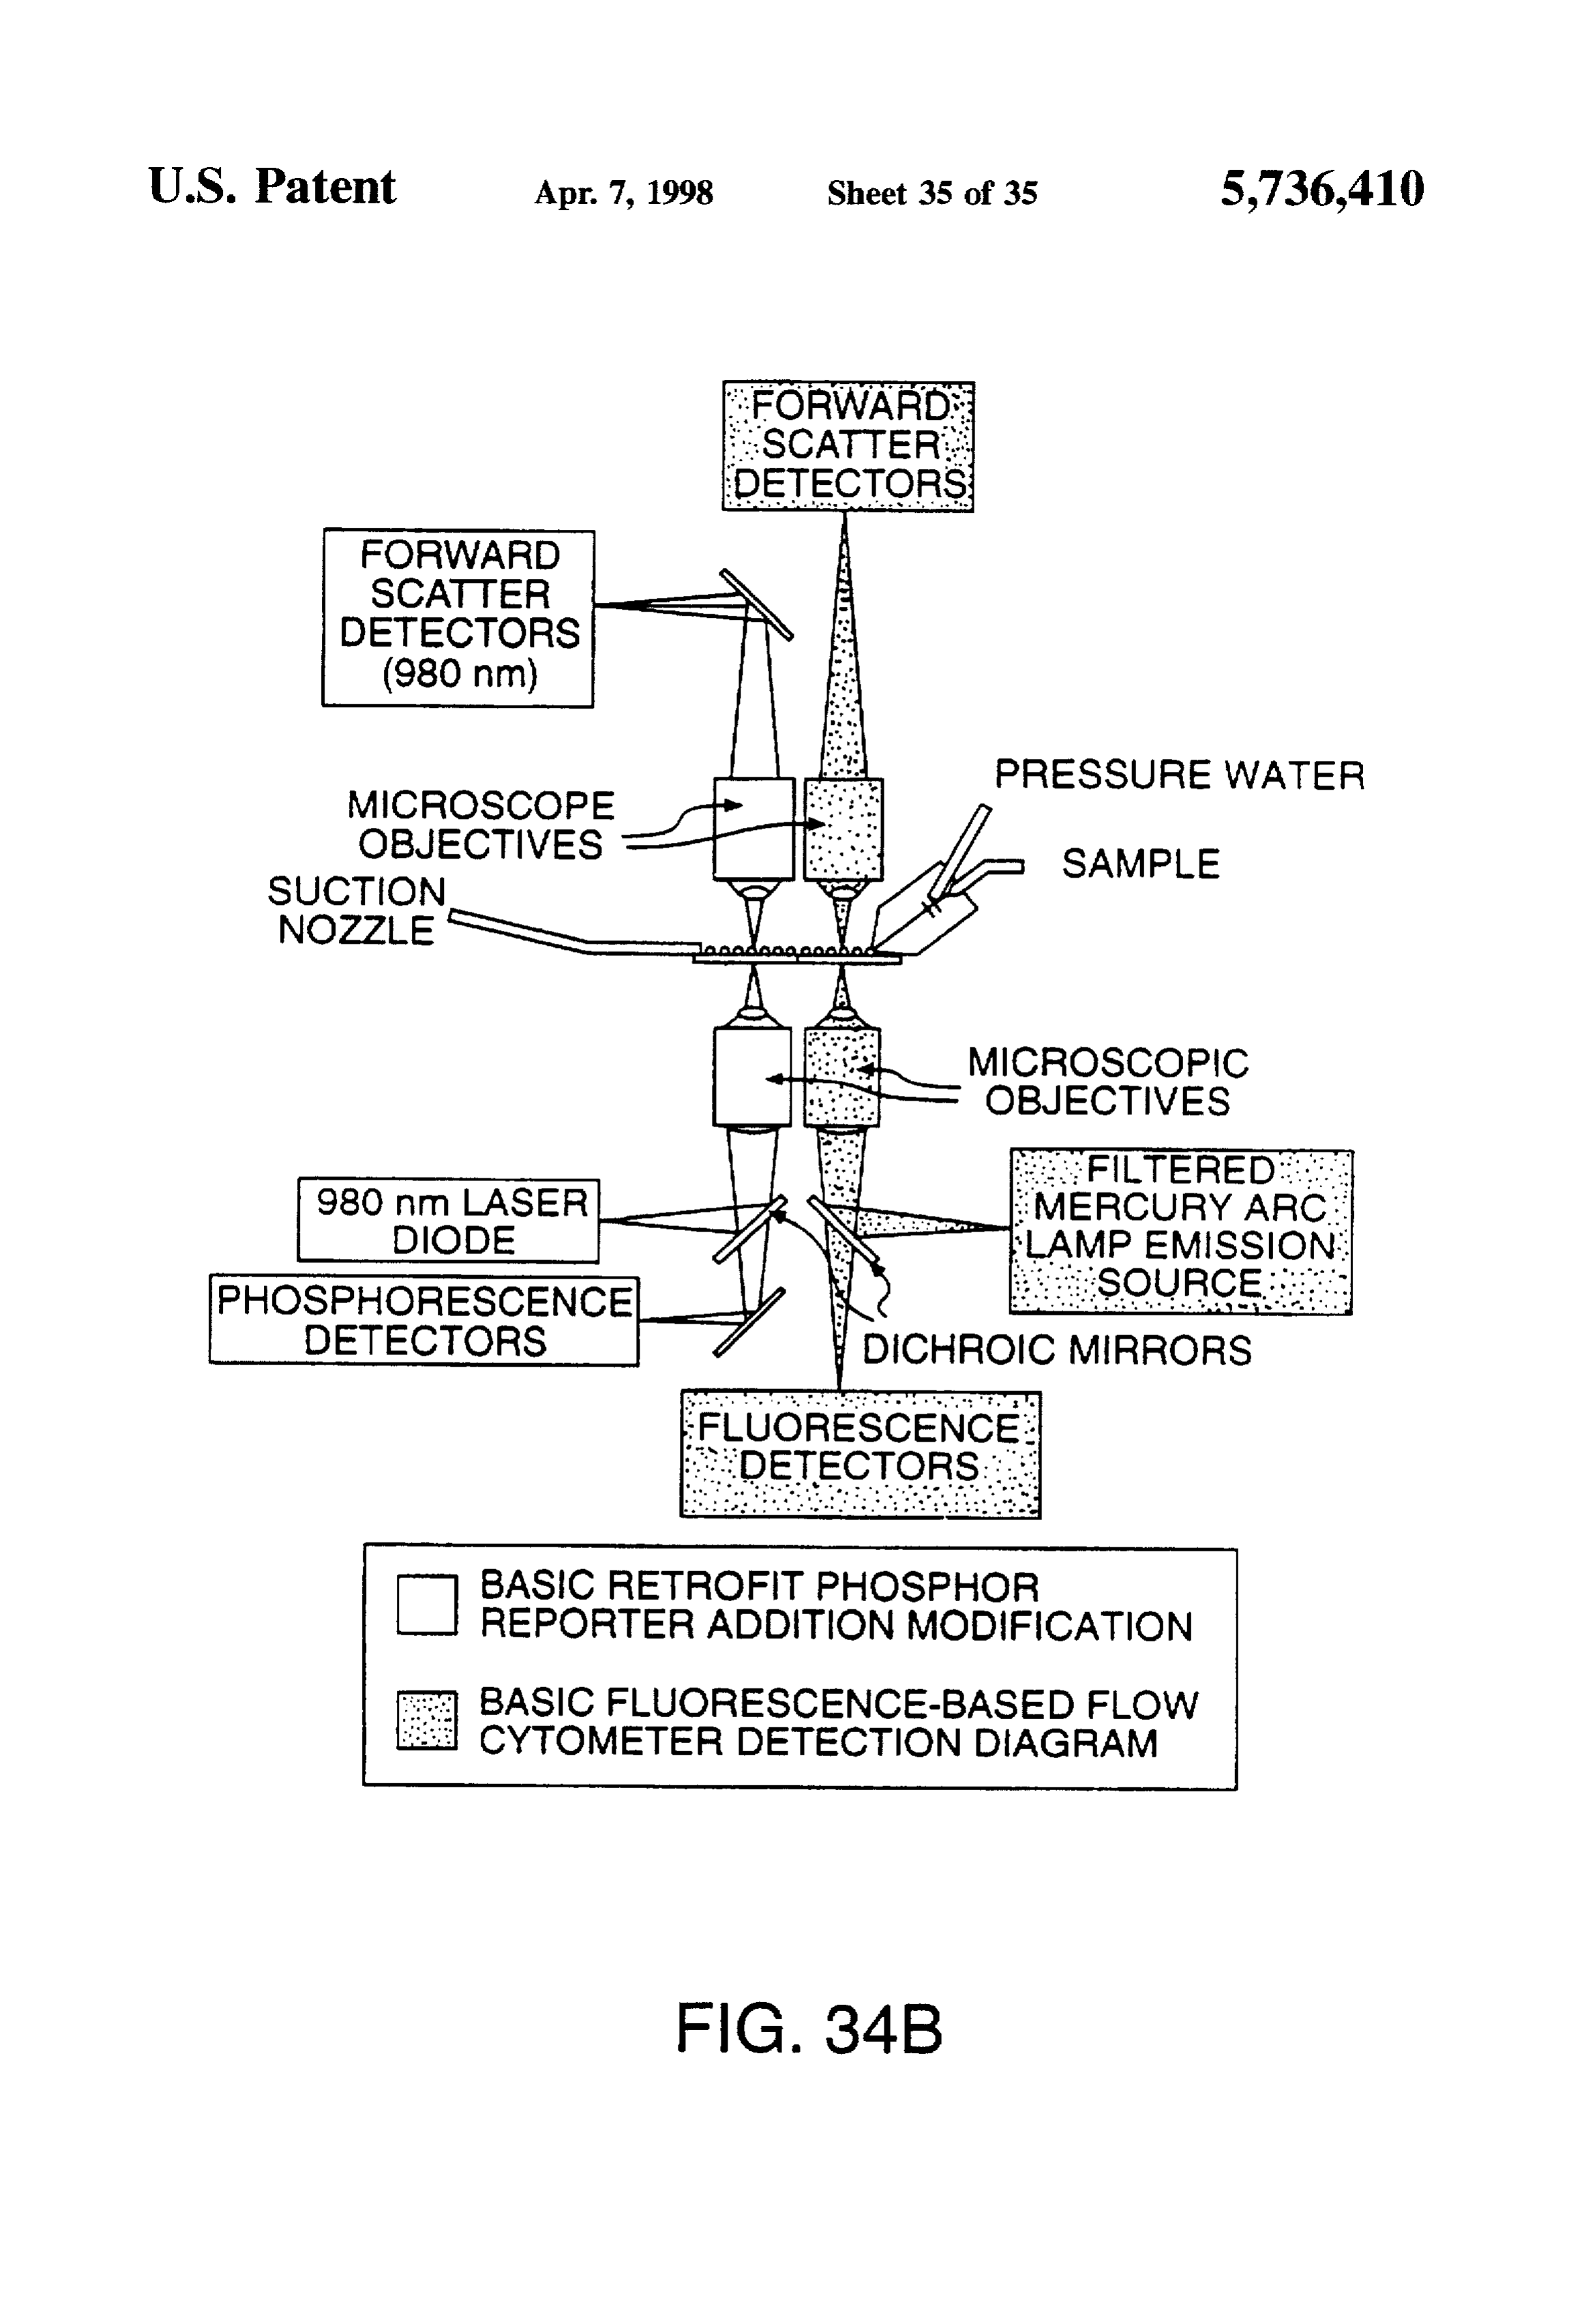
following excitation with 200 W/cm at 970 nm. FIGS. 34A and 34B show a fluorescence-based flow FIG. 16 shows size-dependence of phosphorescence cytometer modified for use with up-converting phosphors. cross-section for Na(YoYboEroos)F particles,
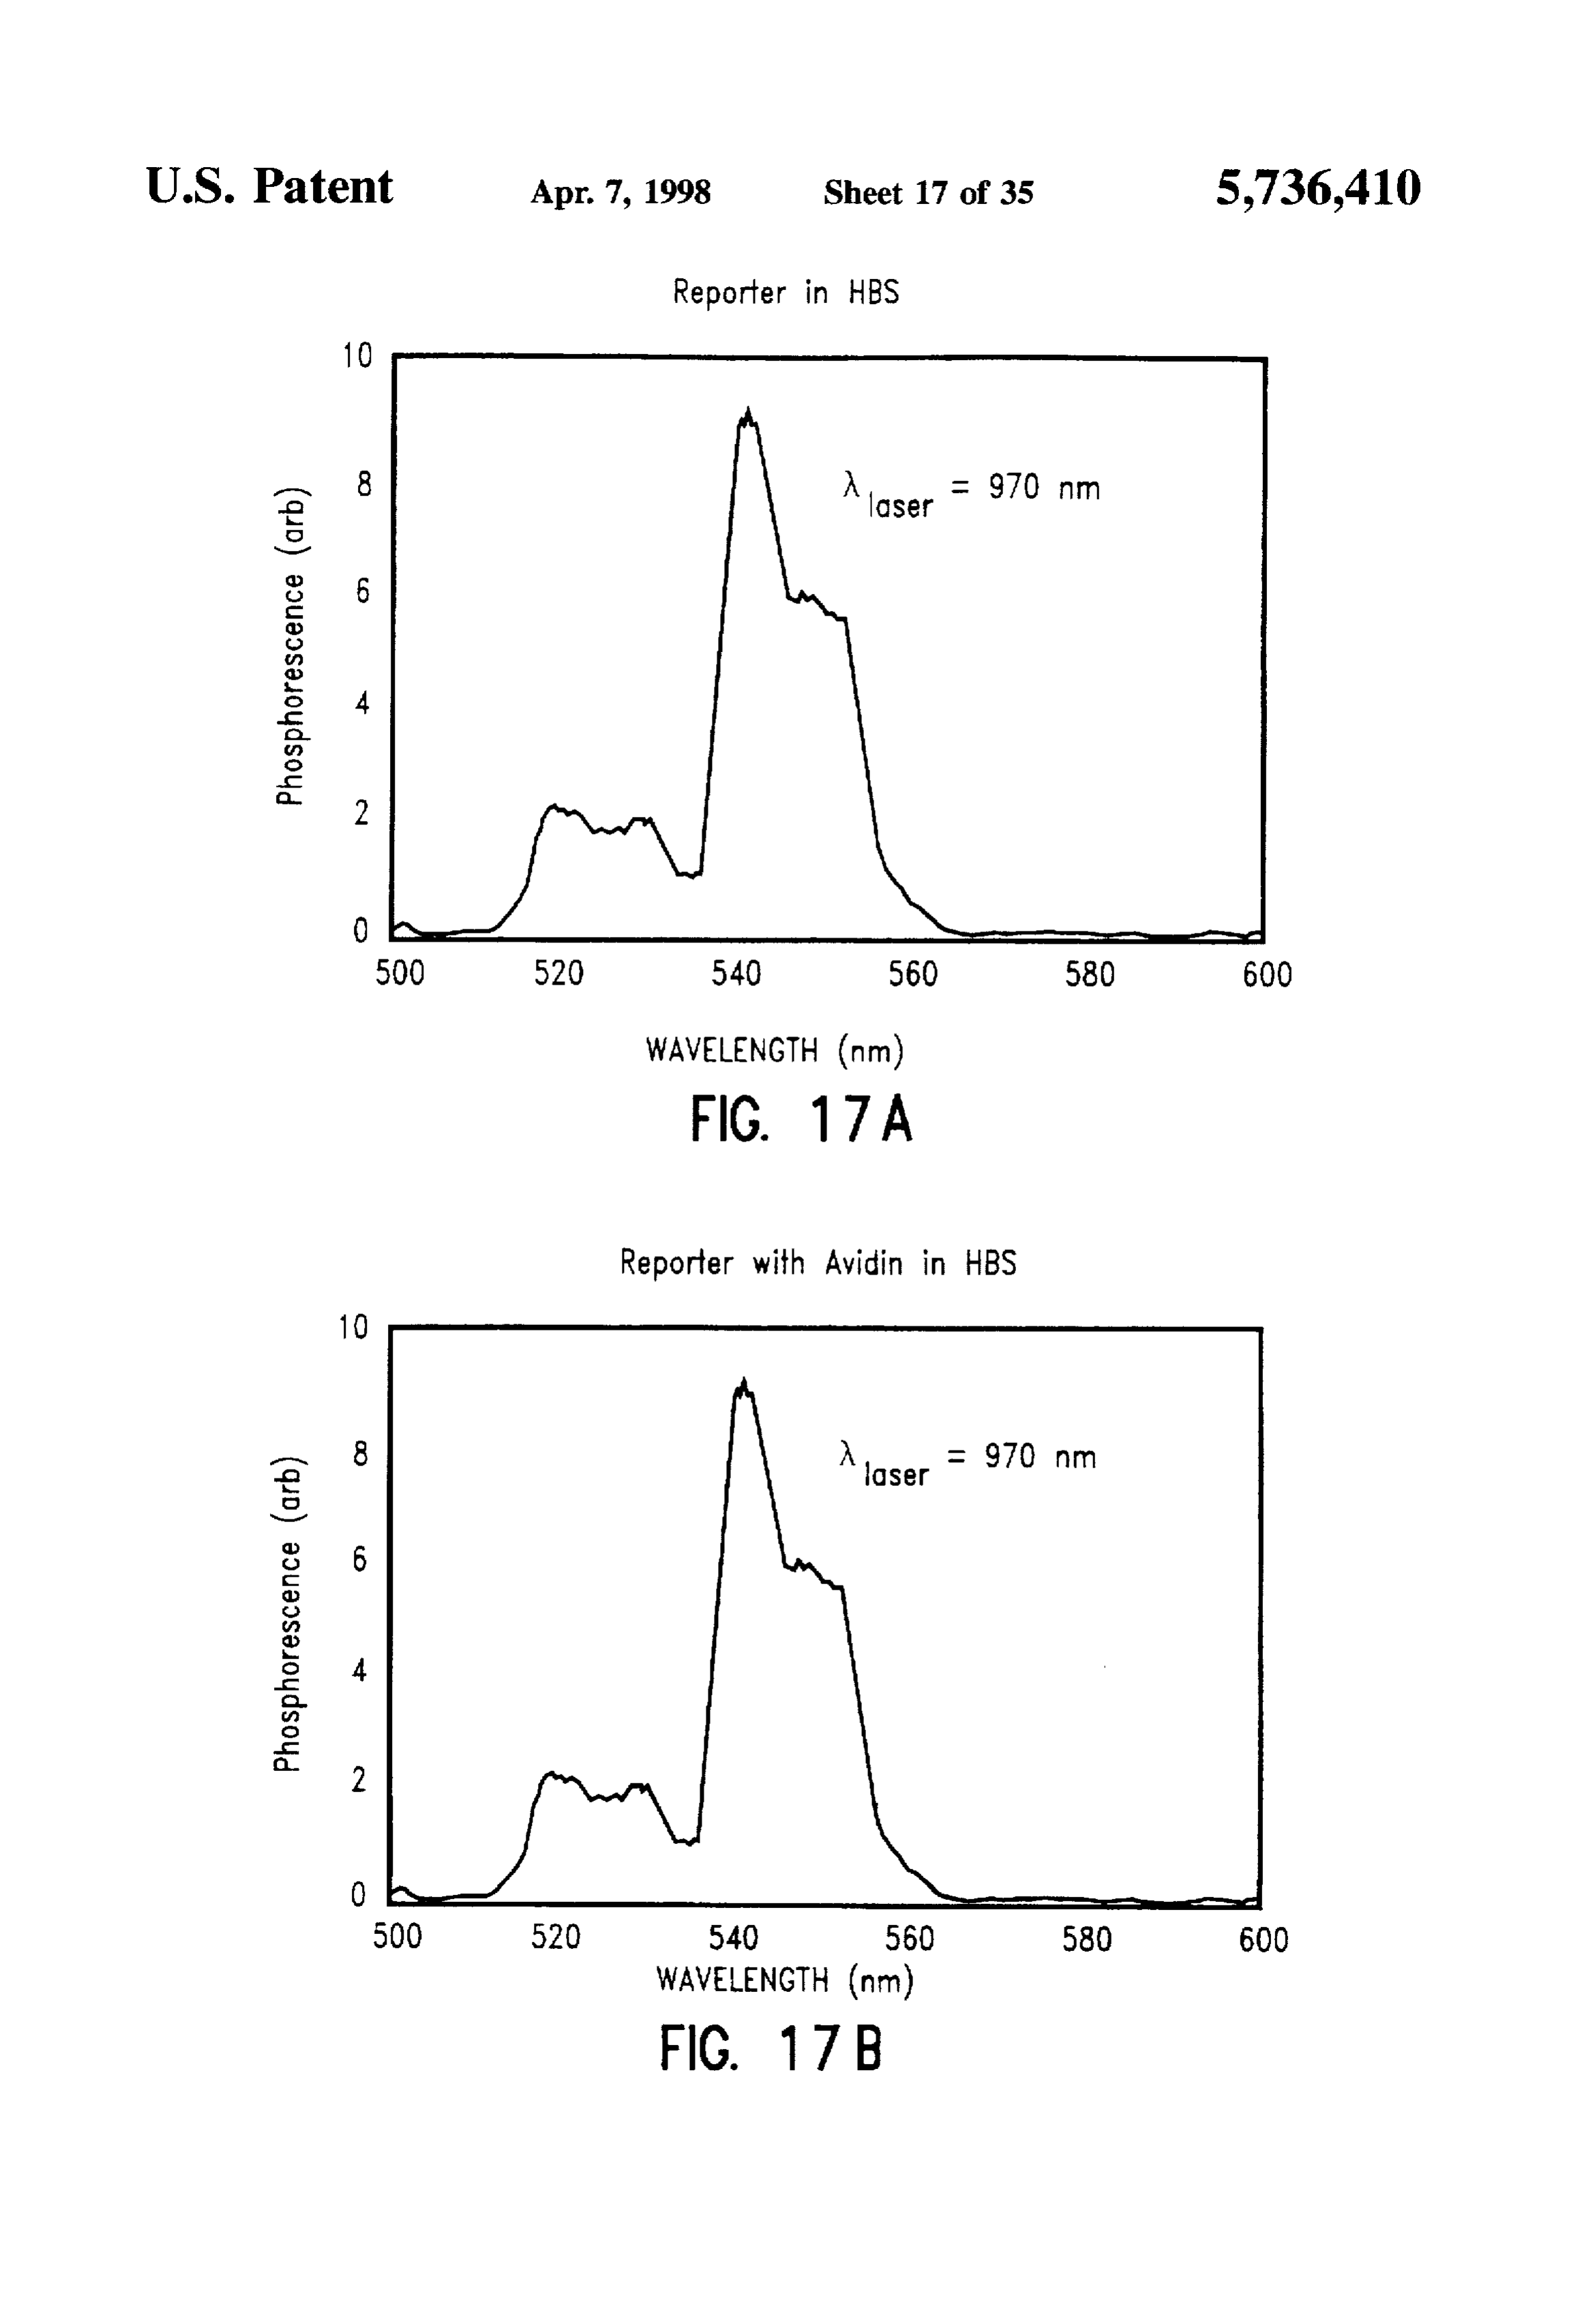
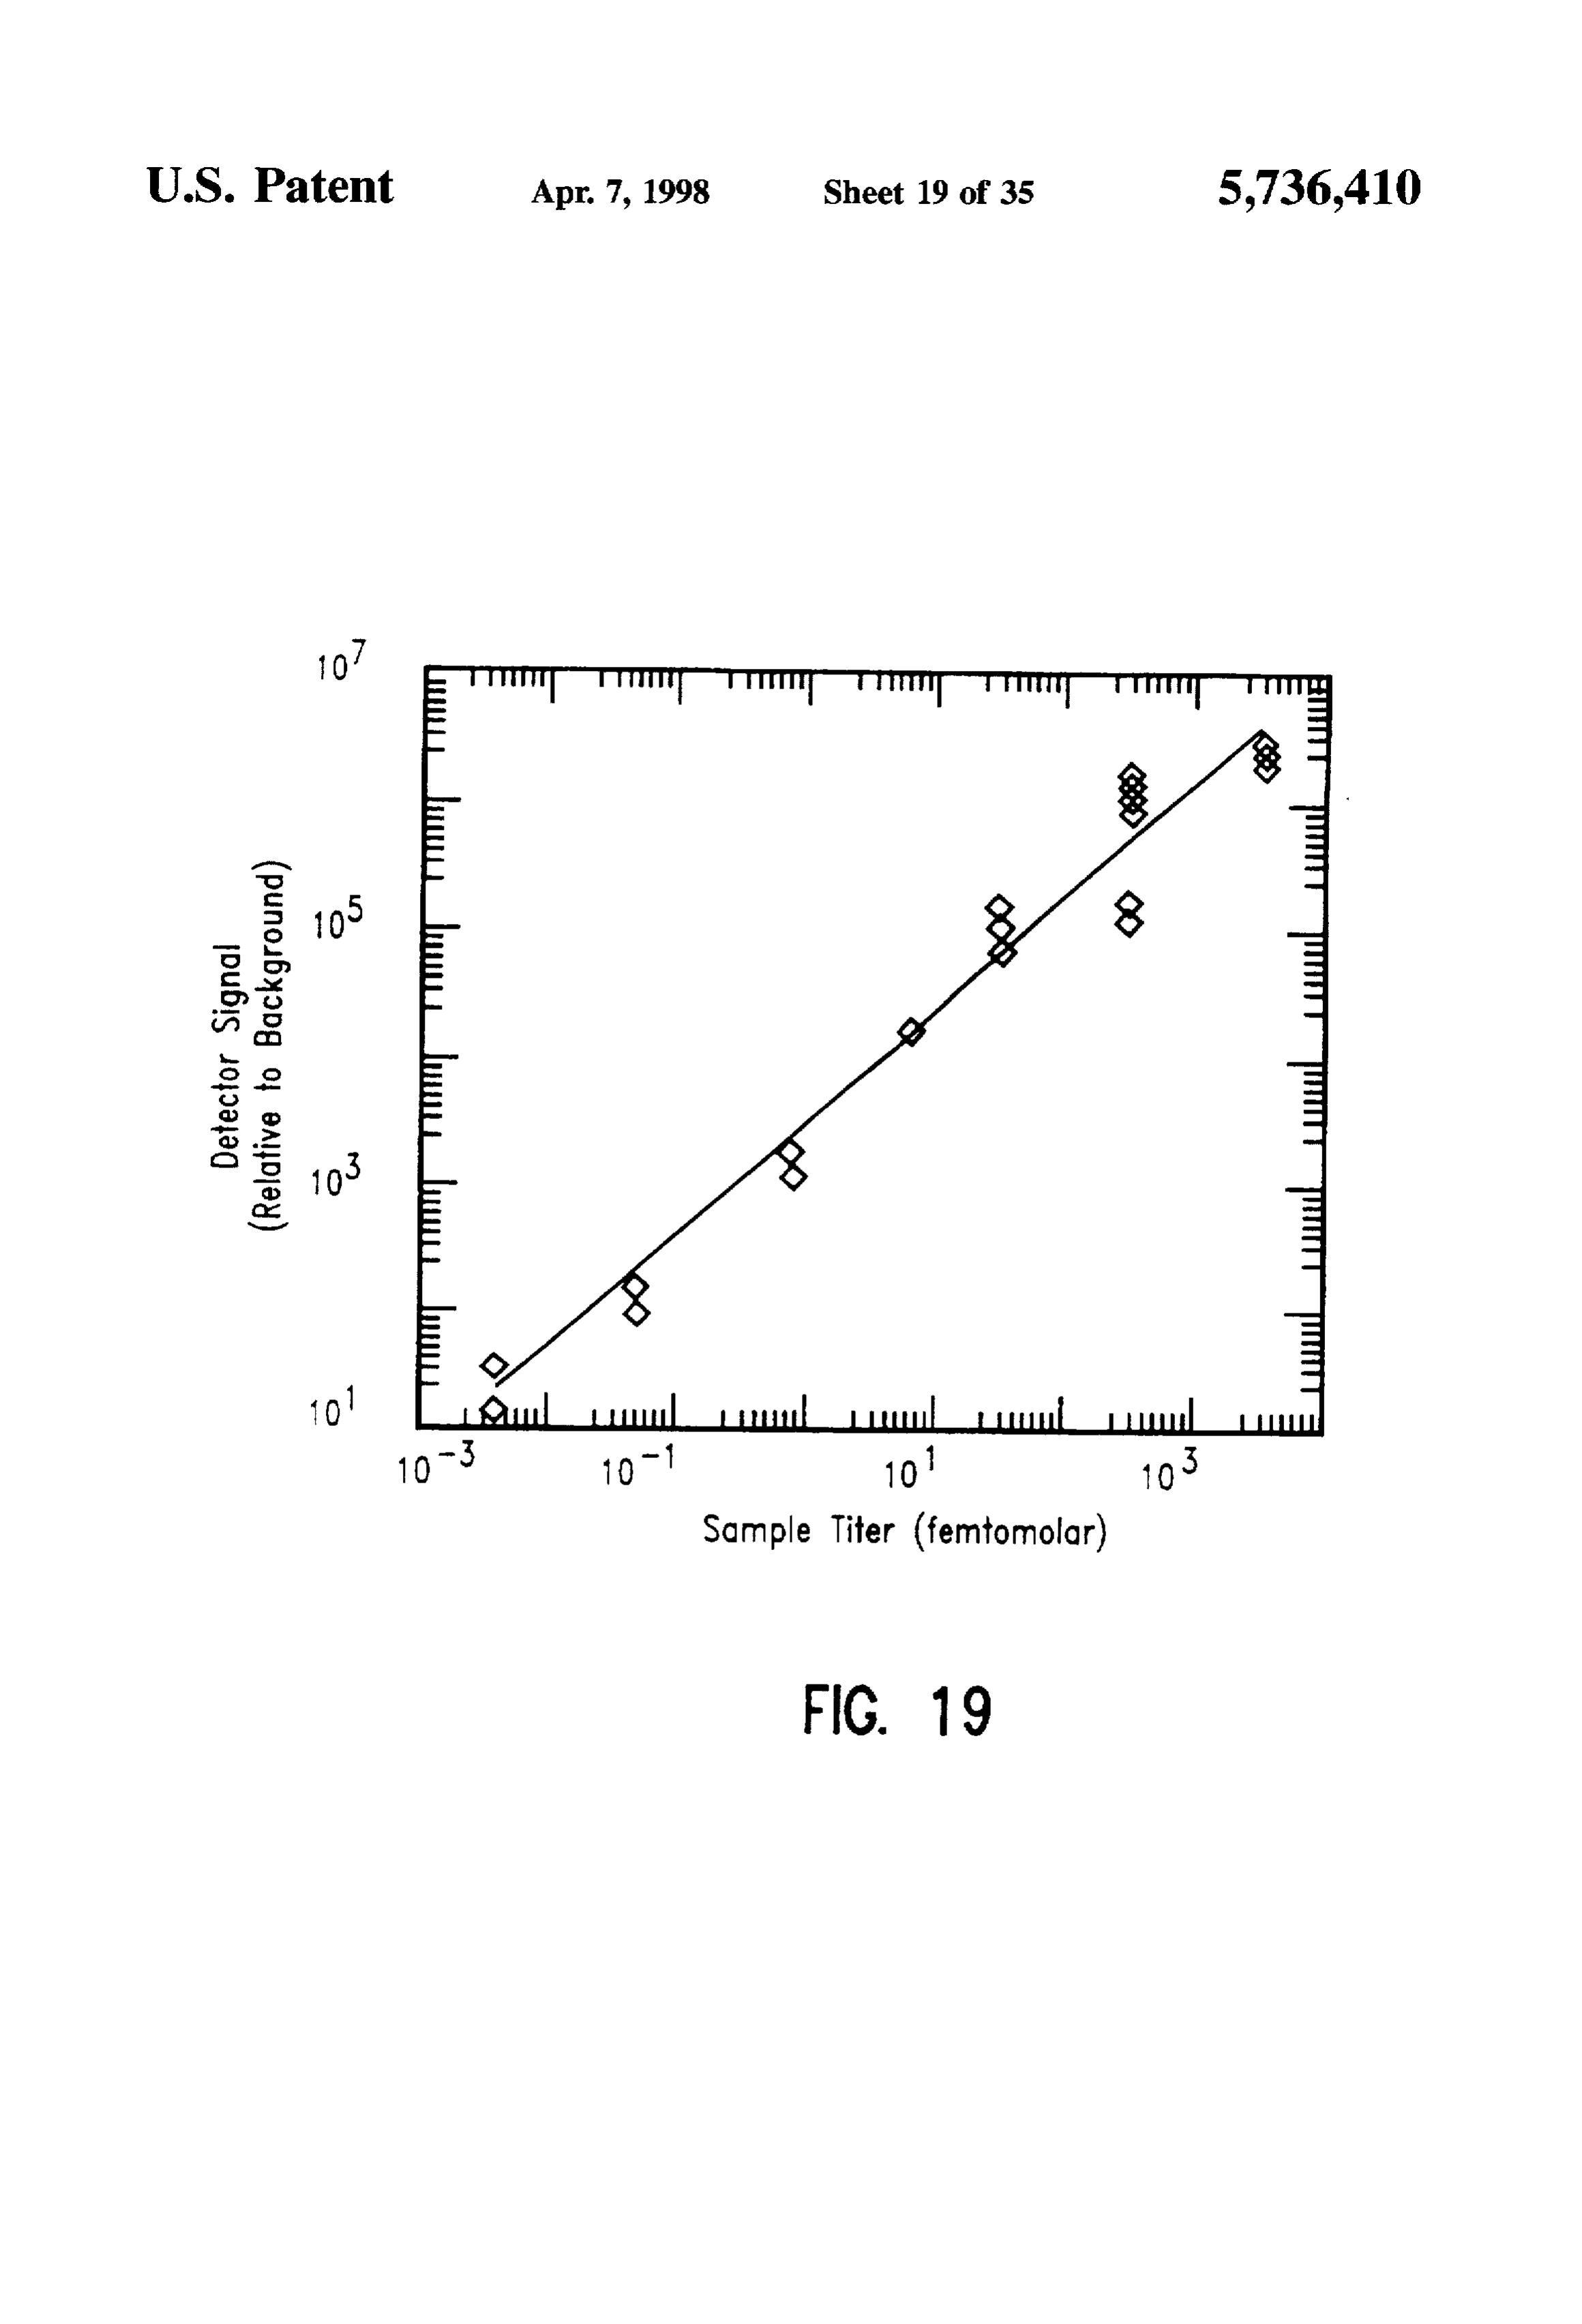
FIG. 17A shows a fluorescence scan of an up-converting DESCRIPTION OF SPECIFIC EMBODIMENTS phosphor reporter in Hepes-buffered saline induced by exci Definitions tation with a 970-nm laser source:
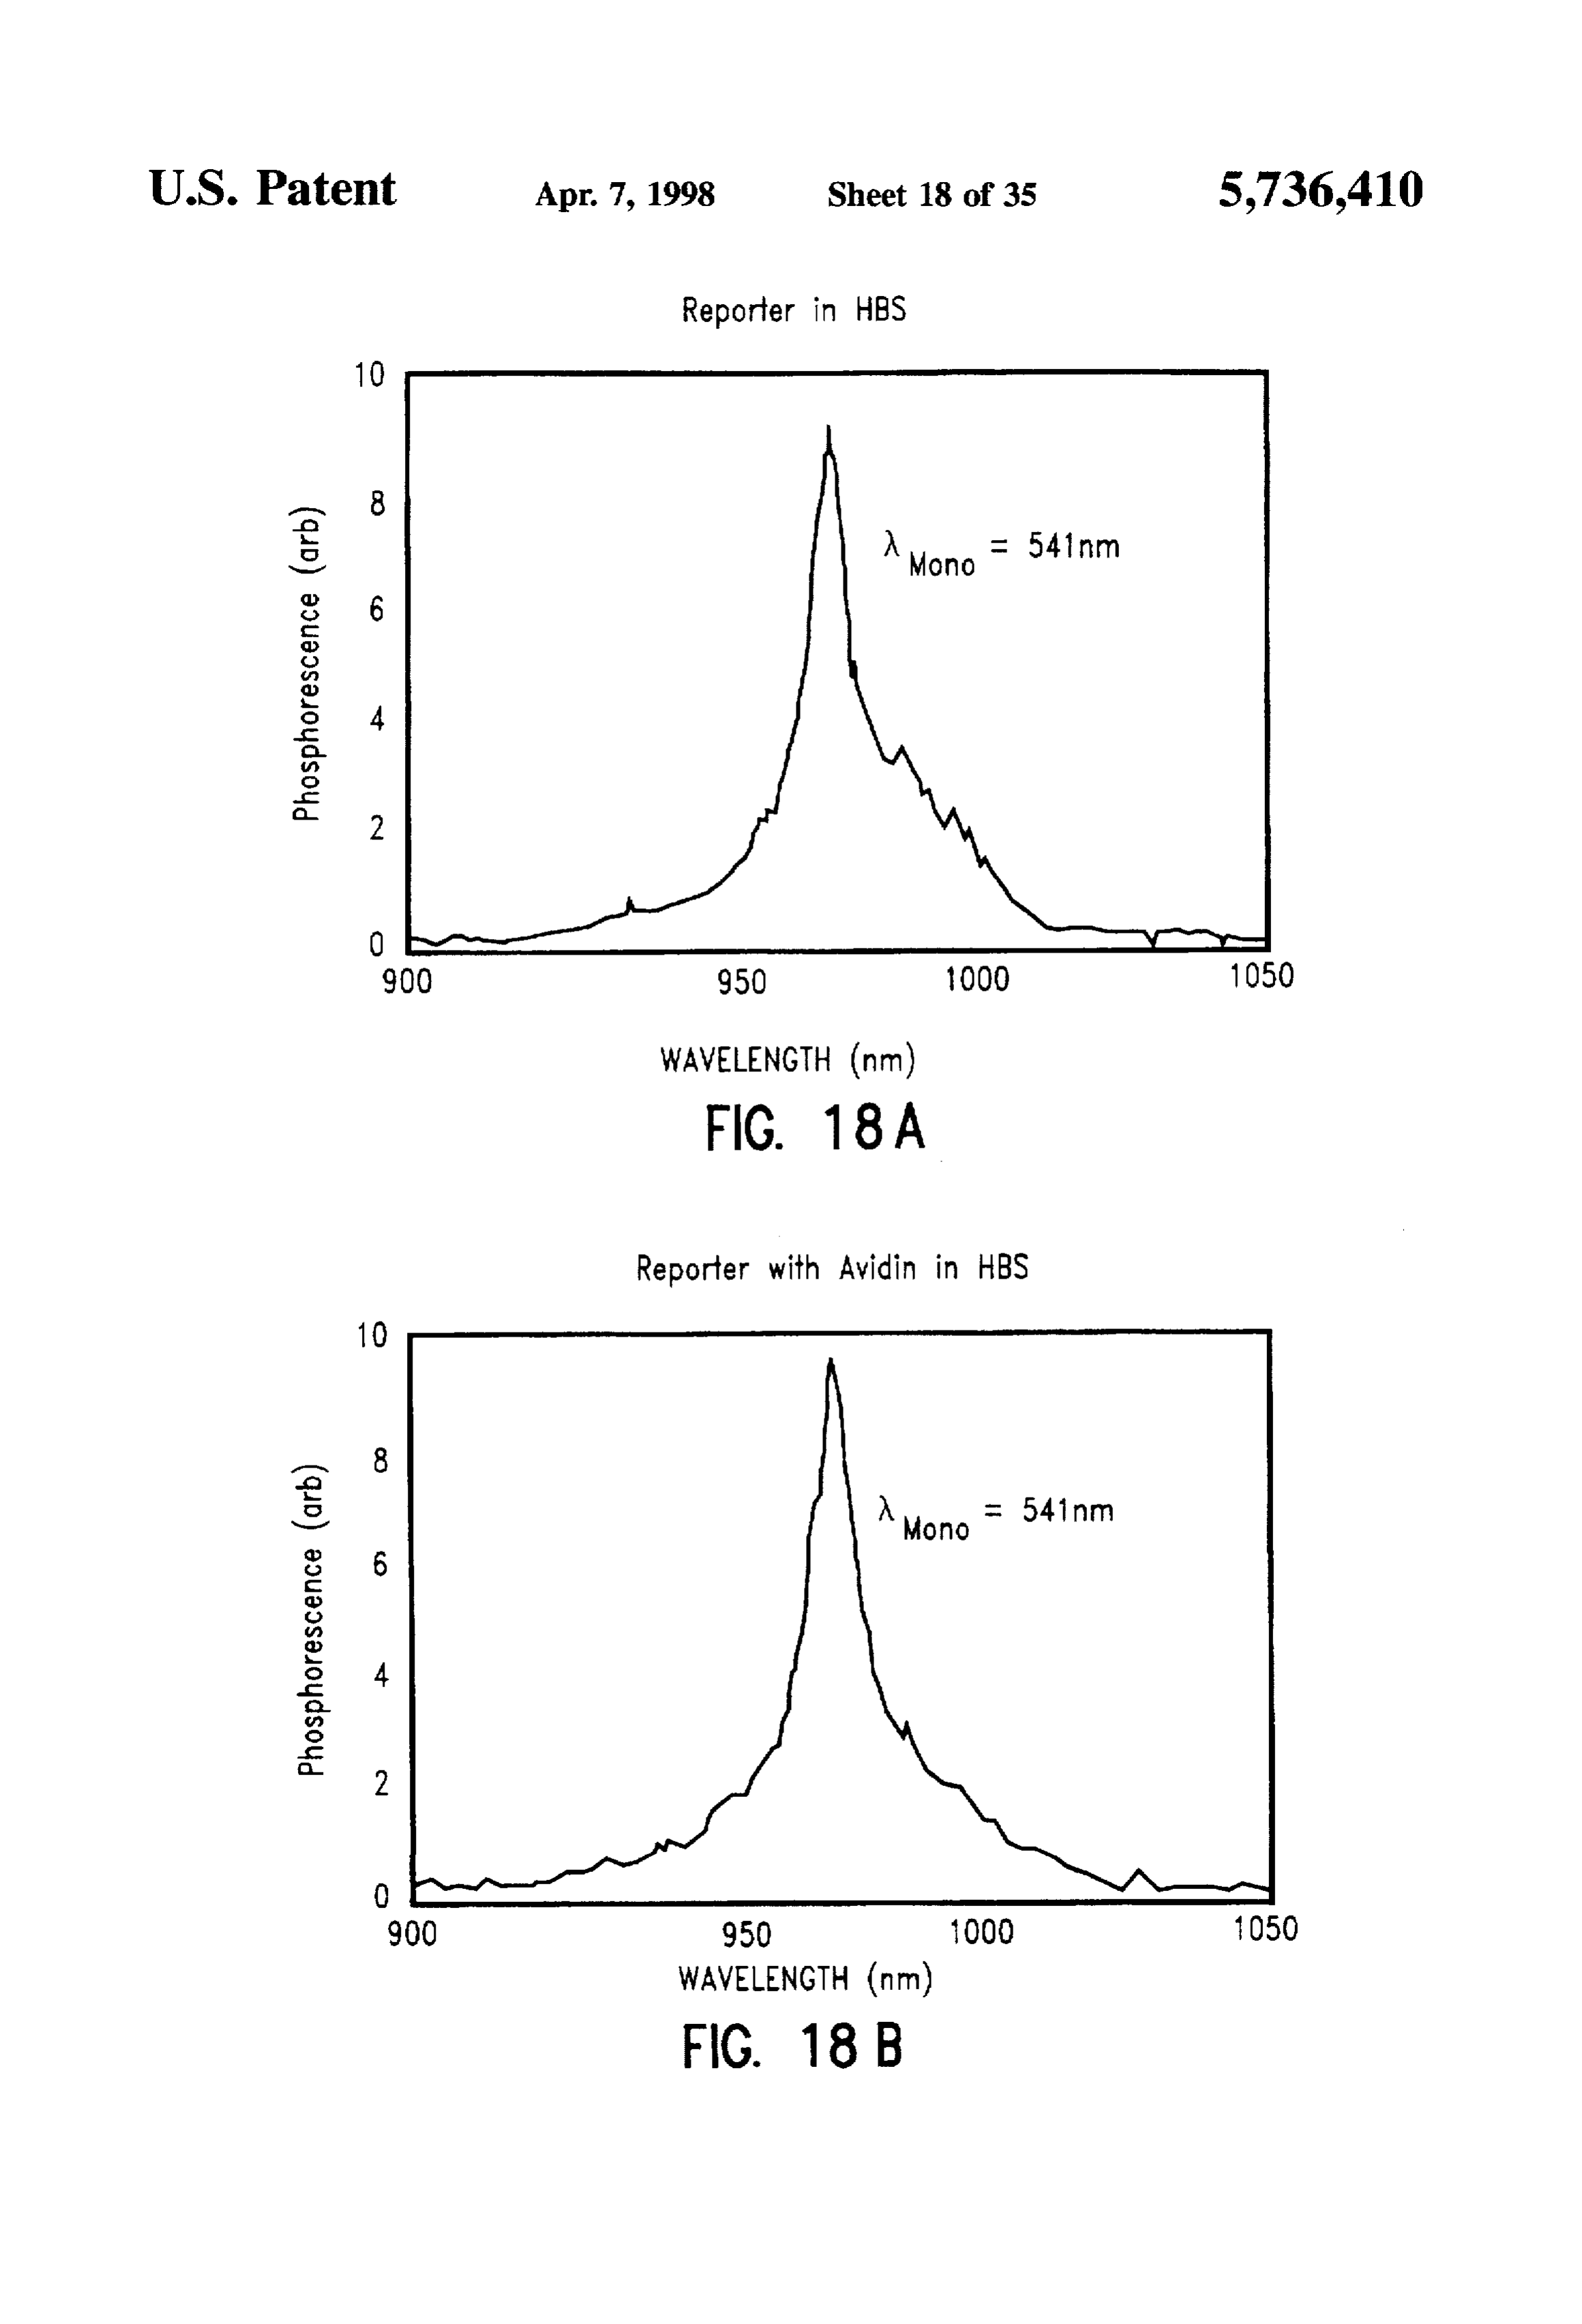
FIG. 17B shows a fluorescence spectrum scan of an Unless defined otherwise, all technical and scientific up-converting phosphor reporter coated with streptavidin in O terms used herein have the same meaning as commonly Hepes-buffered saline induced by excitation with a 970-nm understood by one of ordinary skill in the art to which this laser source; invention belongs. Although any methods and materials FIG. 18A shows an excitation spectrum scan of an similar or equivalent to those described herein can be used up-converting phosphor reporter in Hepes-buffered saline 15 in the practice or testing of the present invention, the with monochromatic detection of emission at 541 mm: preferred methods and materials are described. For purposes FIG. 18B shows an excitation spectrum scan of an below. of the present invention, the following terms are defined up-converting phosphor reporter coated with streptavidin in
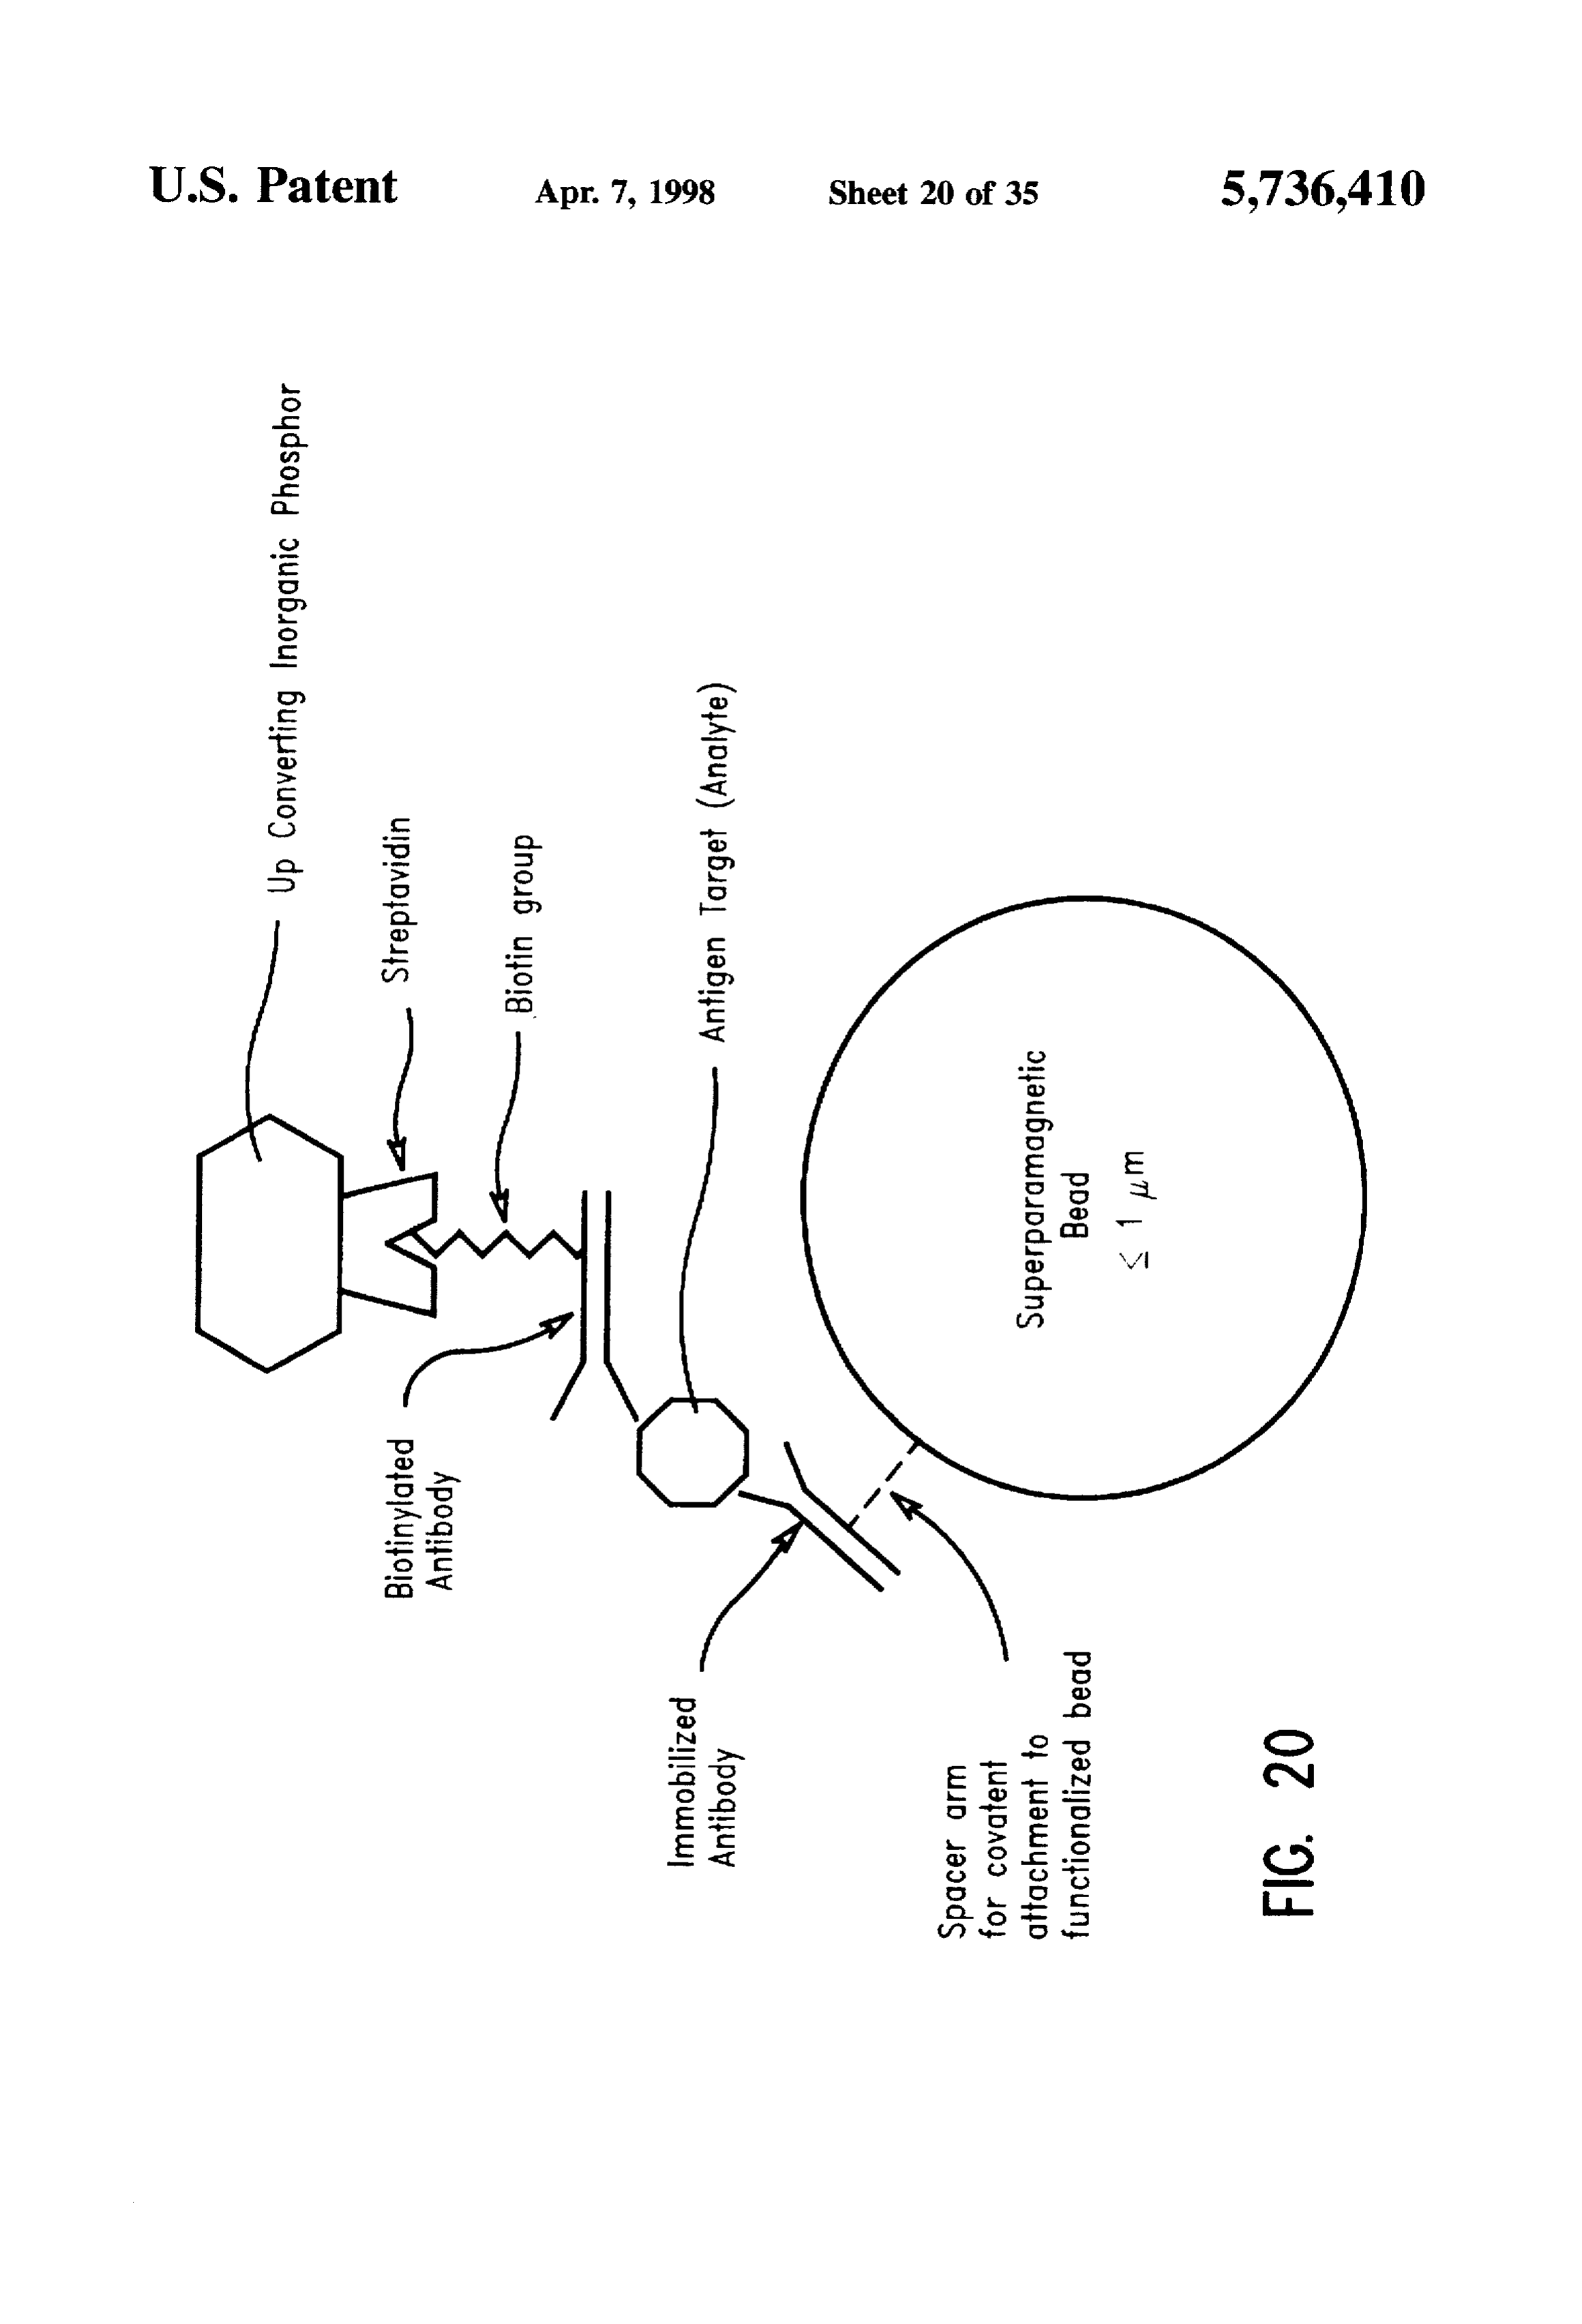
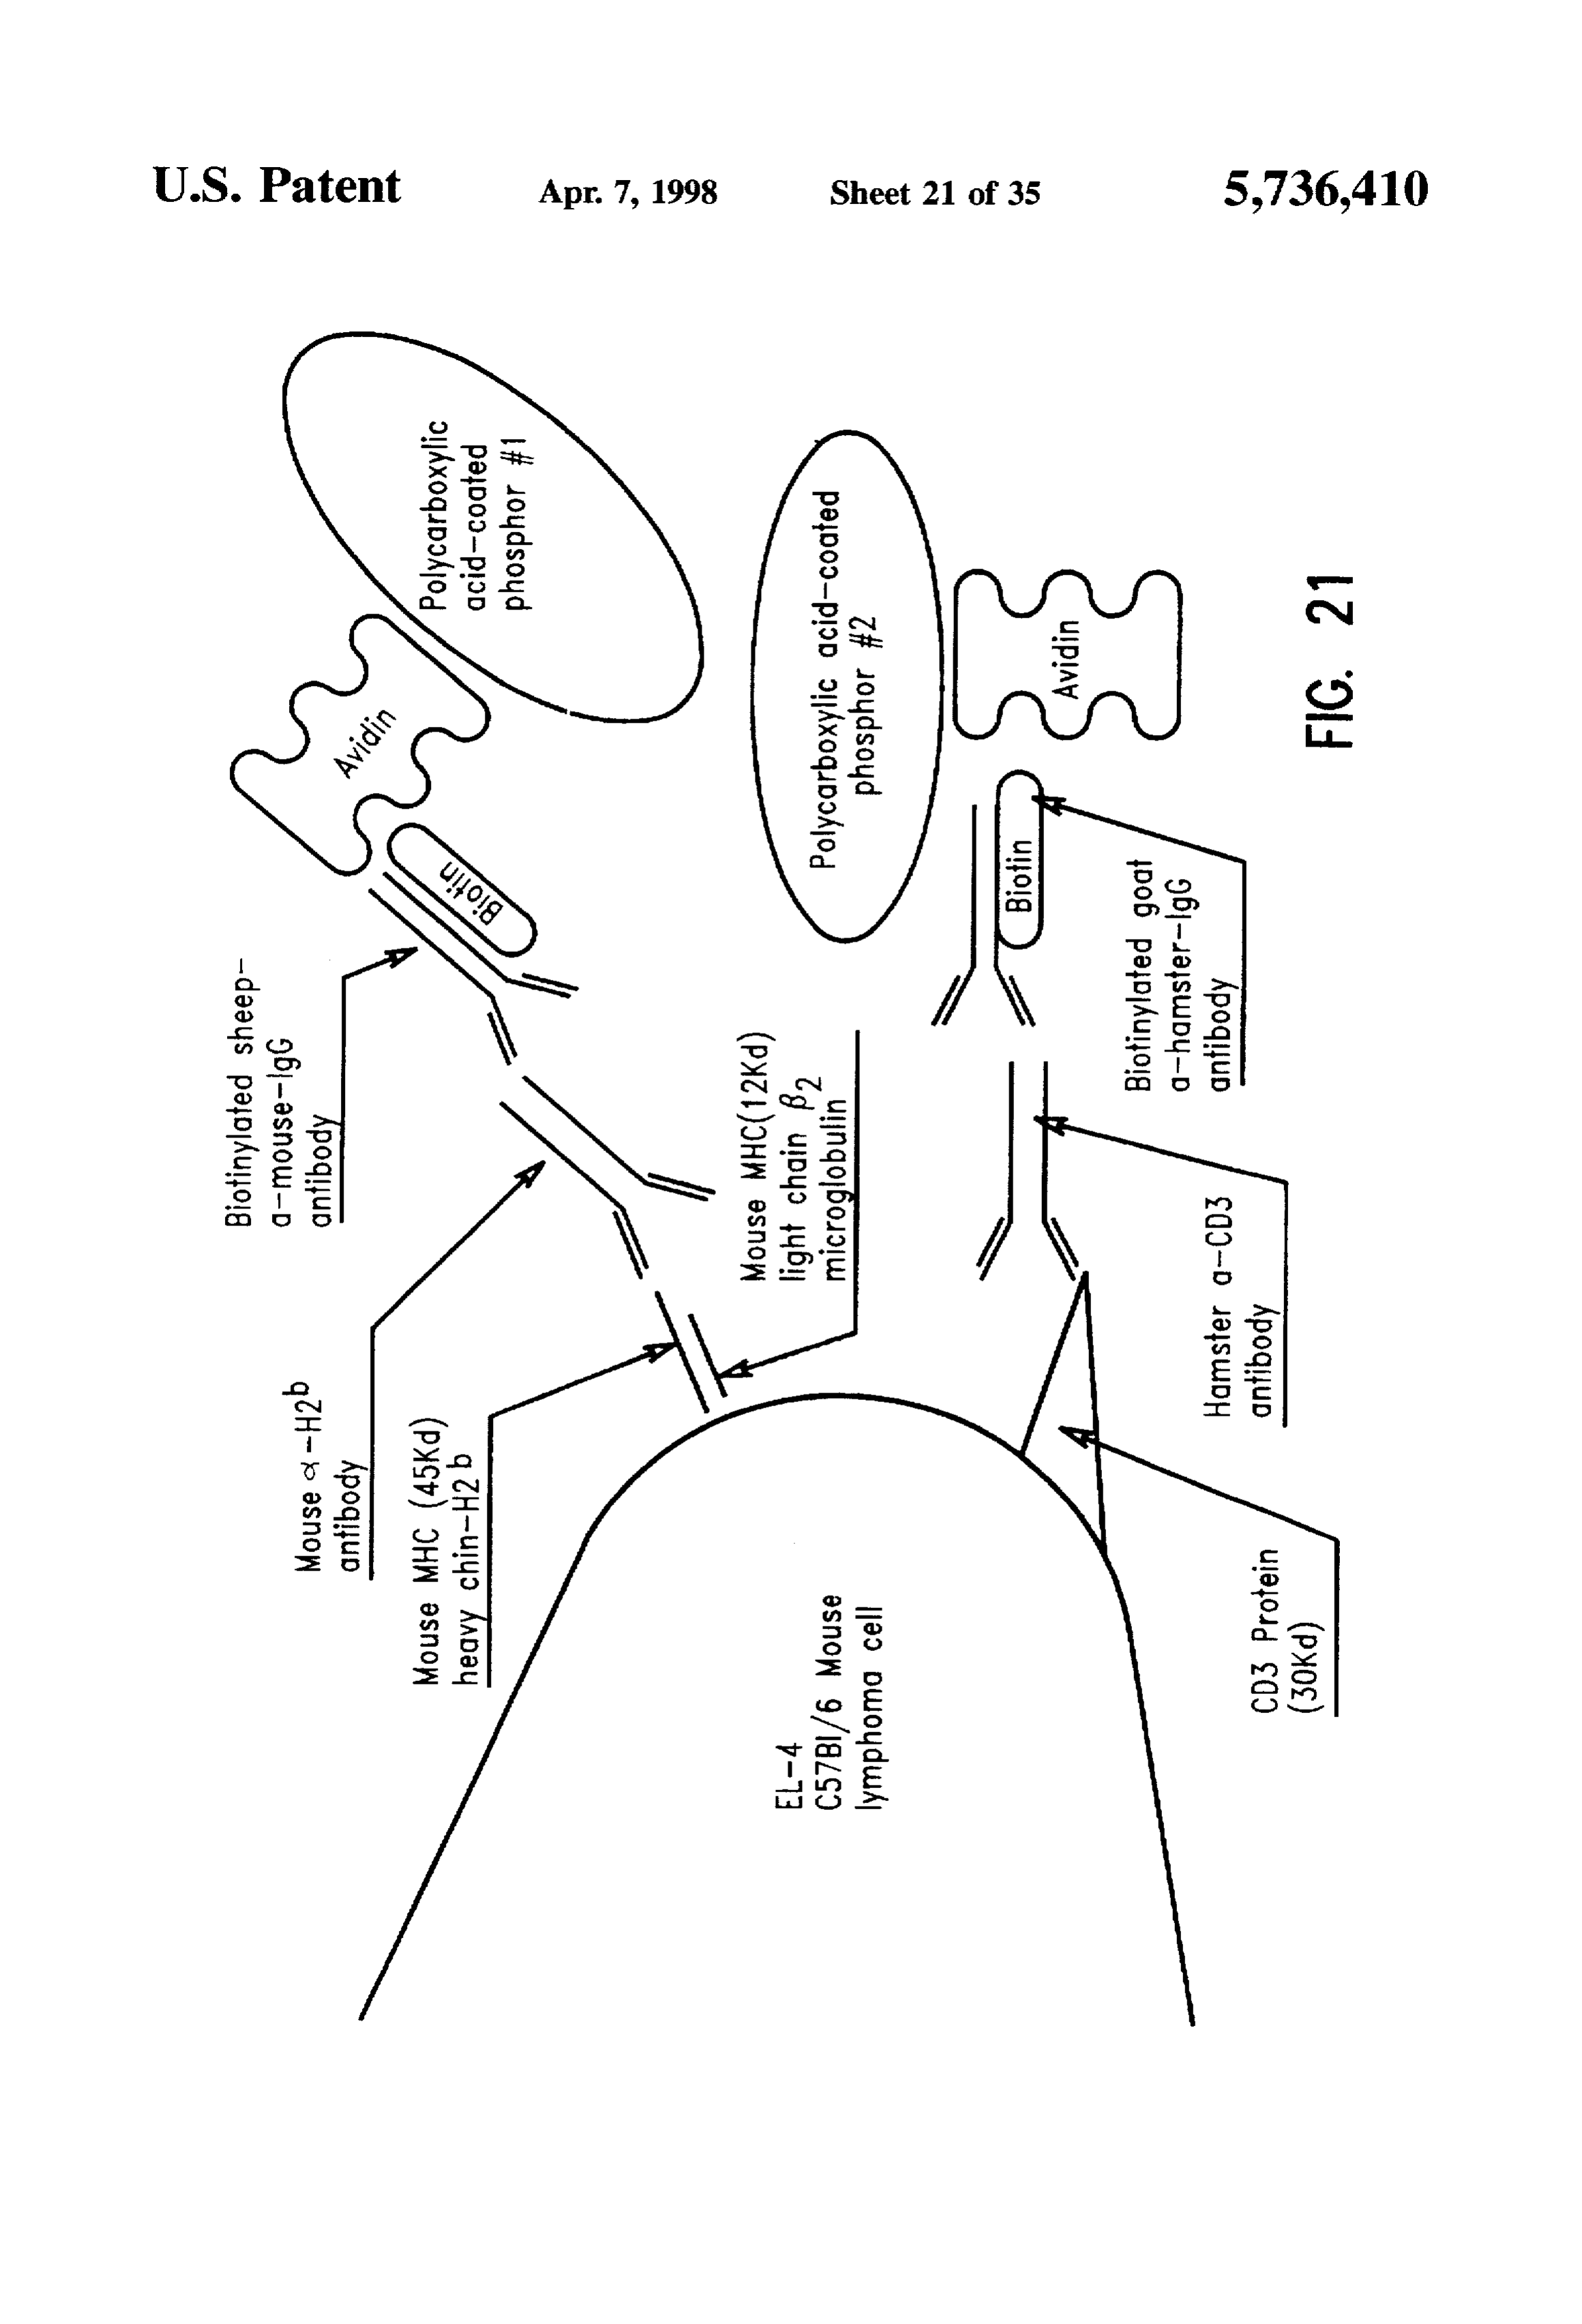
Hepes-buffered saline with monochromatic detection of As used herein, "label" refers to a chemical substituent emission at 541 nm: that produces, under appropriate excitation conditions, a FIG. 19 shows the integrated signal obtained from detectable optical signal. The optical signal produced by an Samples of (Yossy booseroos)2O2S showing the relation excited label is typically electromagnetic radiation in the ship between phosphor concentration and up-converted sig near-infrared, visible, or ultraviolet portions of the spectrum. nal: The labels of the invention are up-converting labels, which FIG. 20 shows schematically one embodiment of an 25 photons means that the chemical substituent absorbs at least two Sandwich immunoassay for detecting an analyte in a solution at an excitation frequency and subsequently emits by binding the analyte (e.g., an antigen target) to a biotiny electromagnetic energy at an emission frequency higher than lated antibody and to an immobilized antibody, wherein the the excitation frequency. Thus, there is generally a signifi analyte forms a sandwich complex immobilized on a solid cant Stokes shift between the original excitation frequency Substrate Superparamagnetic microbead; and and the final emission frequency. A label is generally FIG. 21 shows schematically detection and discrimination presence toand/or attached a probe to serve as a reporter that indicates the location of probe. The invention encom of two cell surface antigens with specific antibodies labeled passes organic and inorganic up-converting labels, but pref with two phosphors with distinct phosphorescence charac erably employs up-converting inorganic lanthanide phos teristics, 35 phors as labels. Thus, a typical label of the invention is a
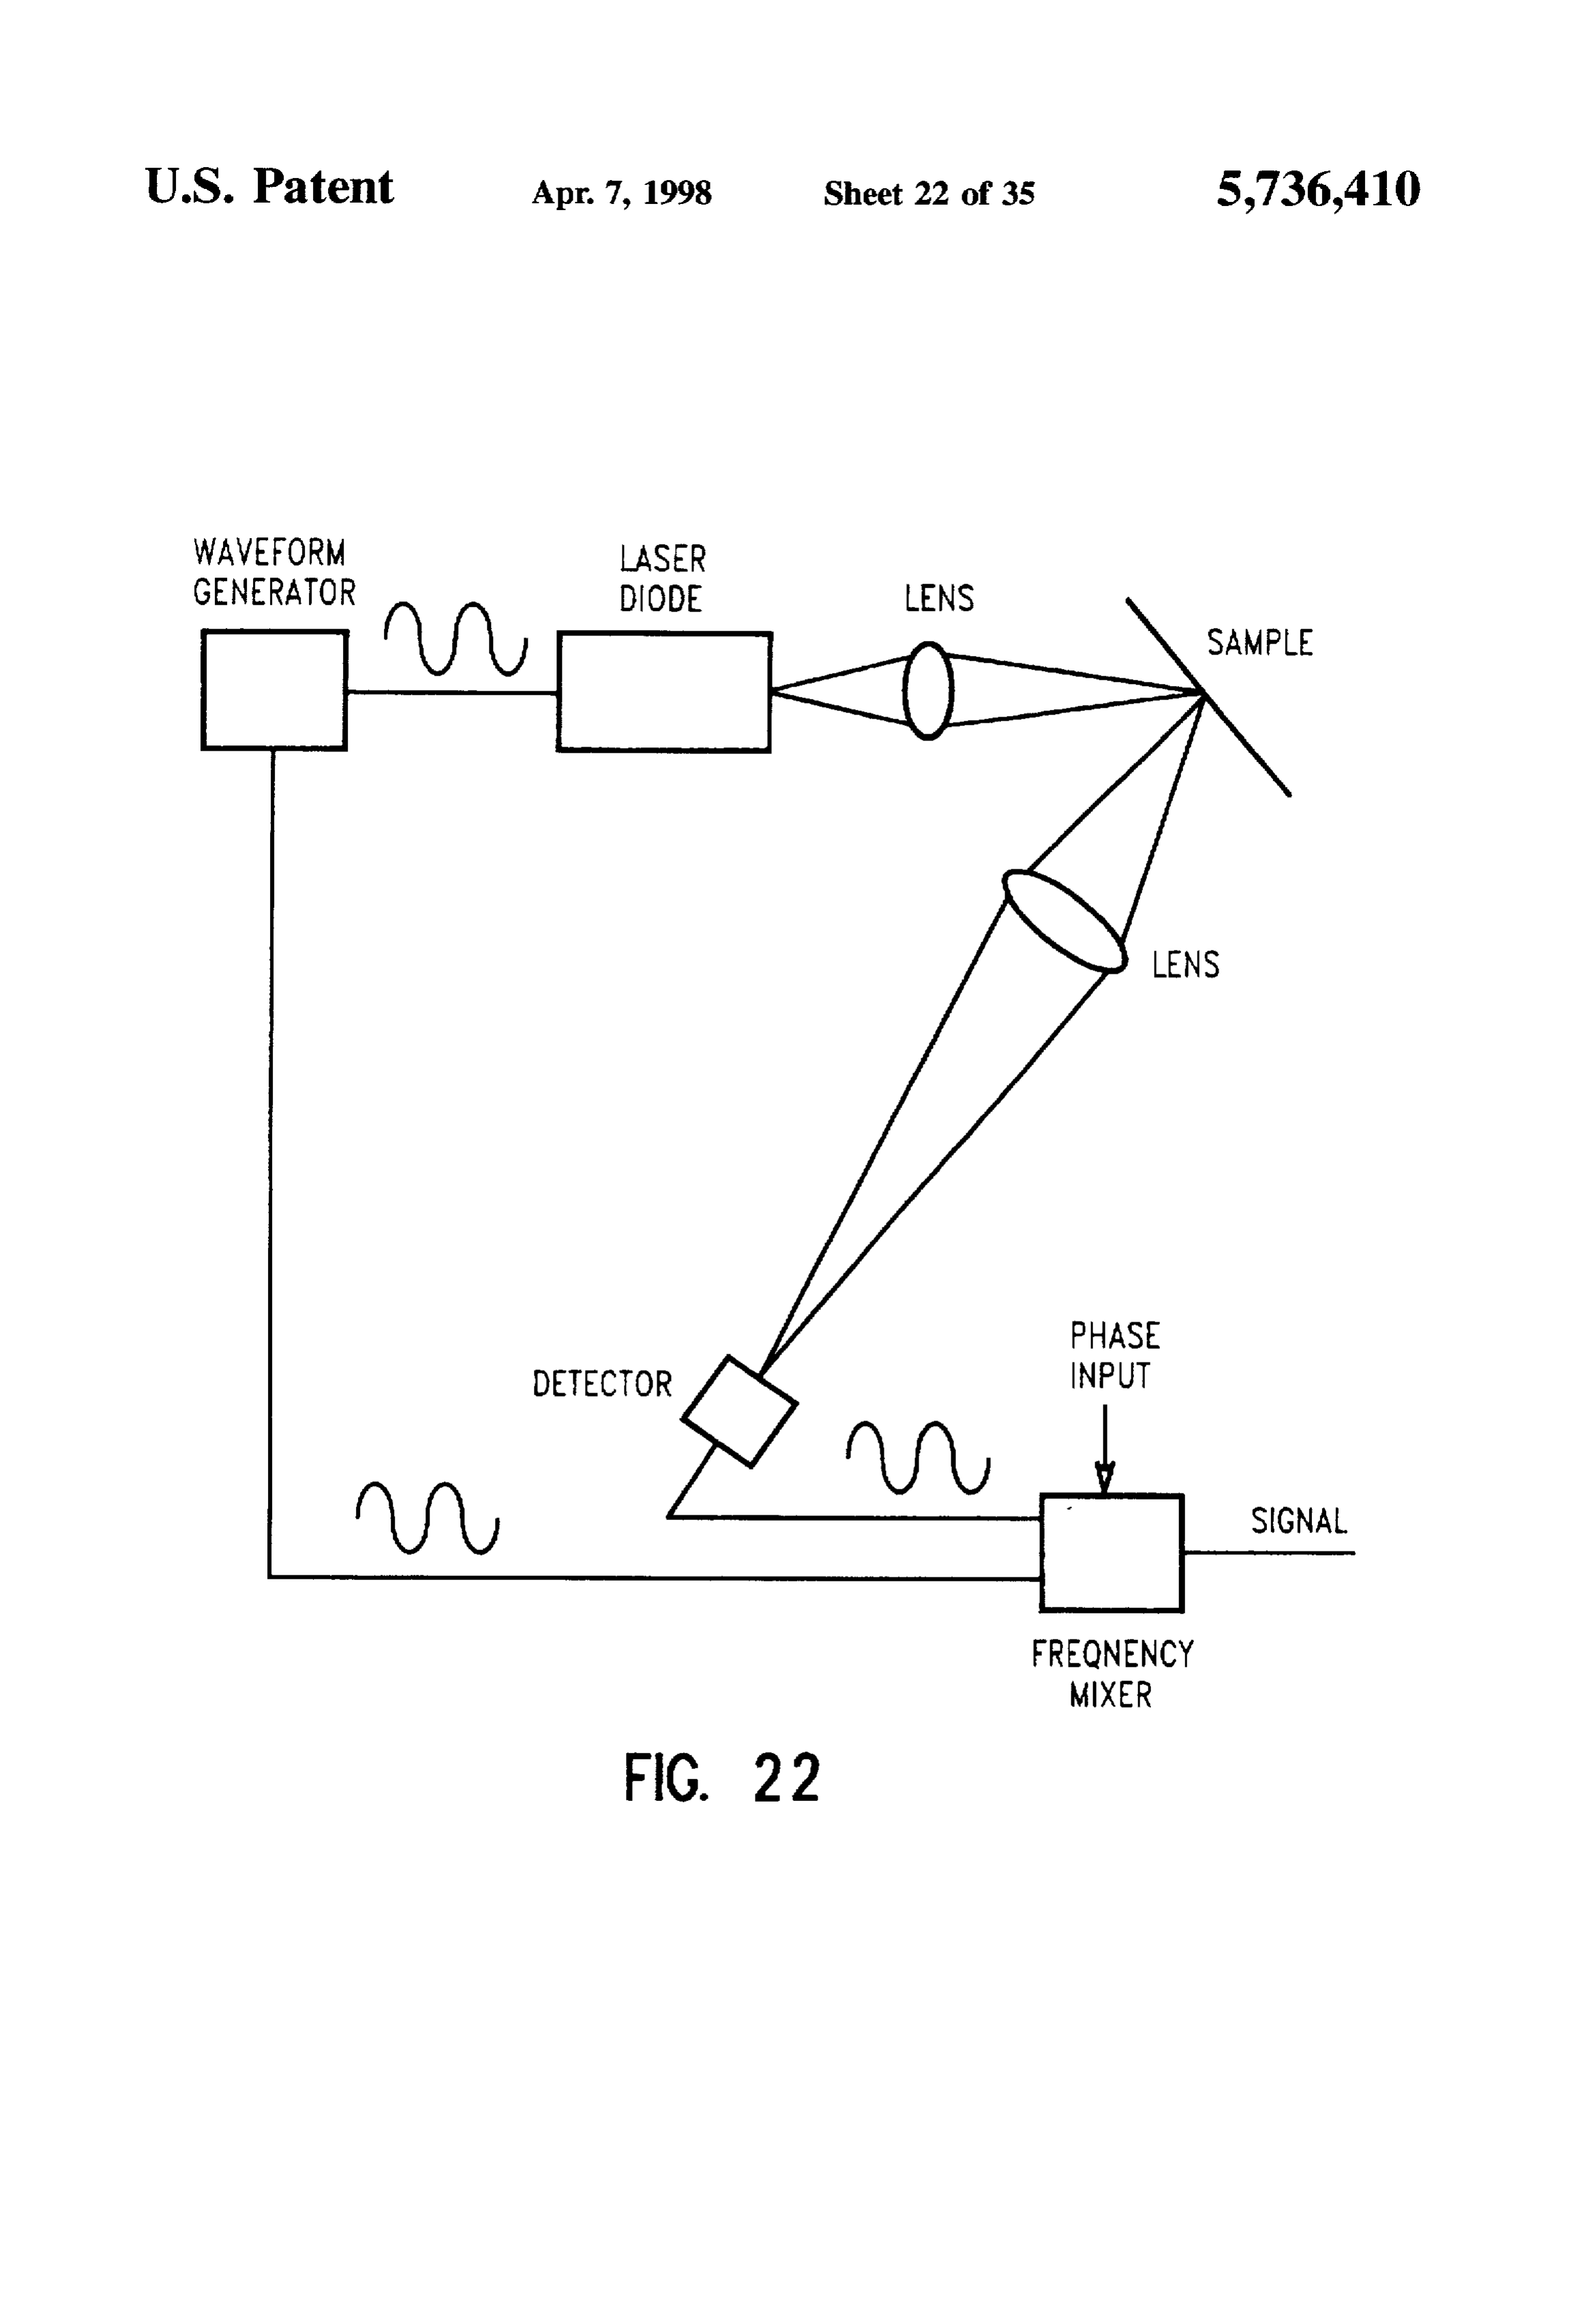
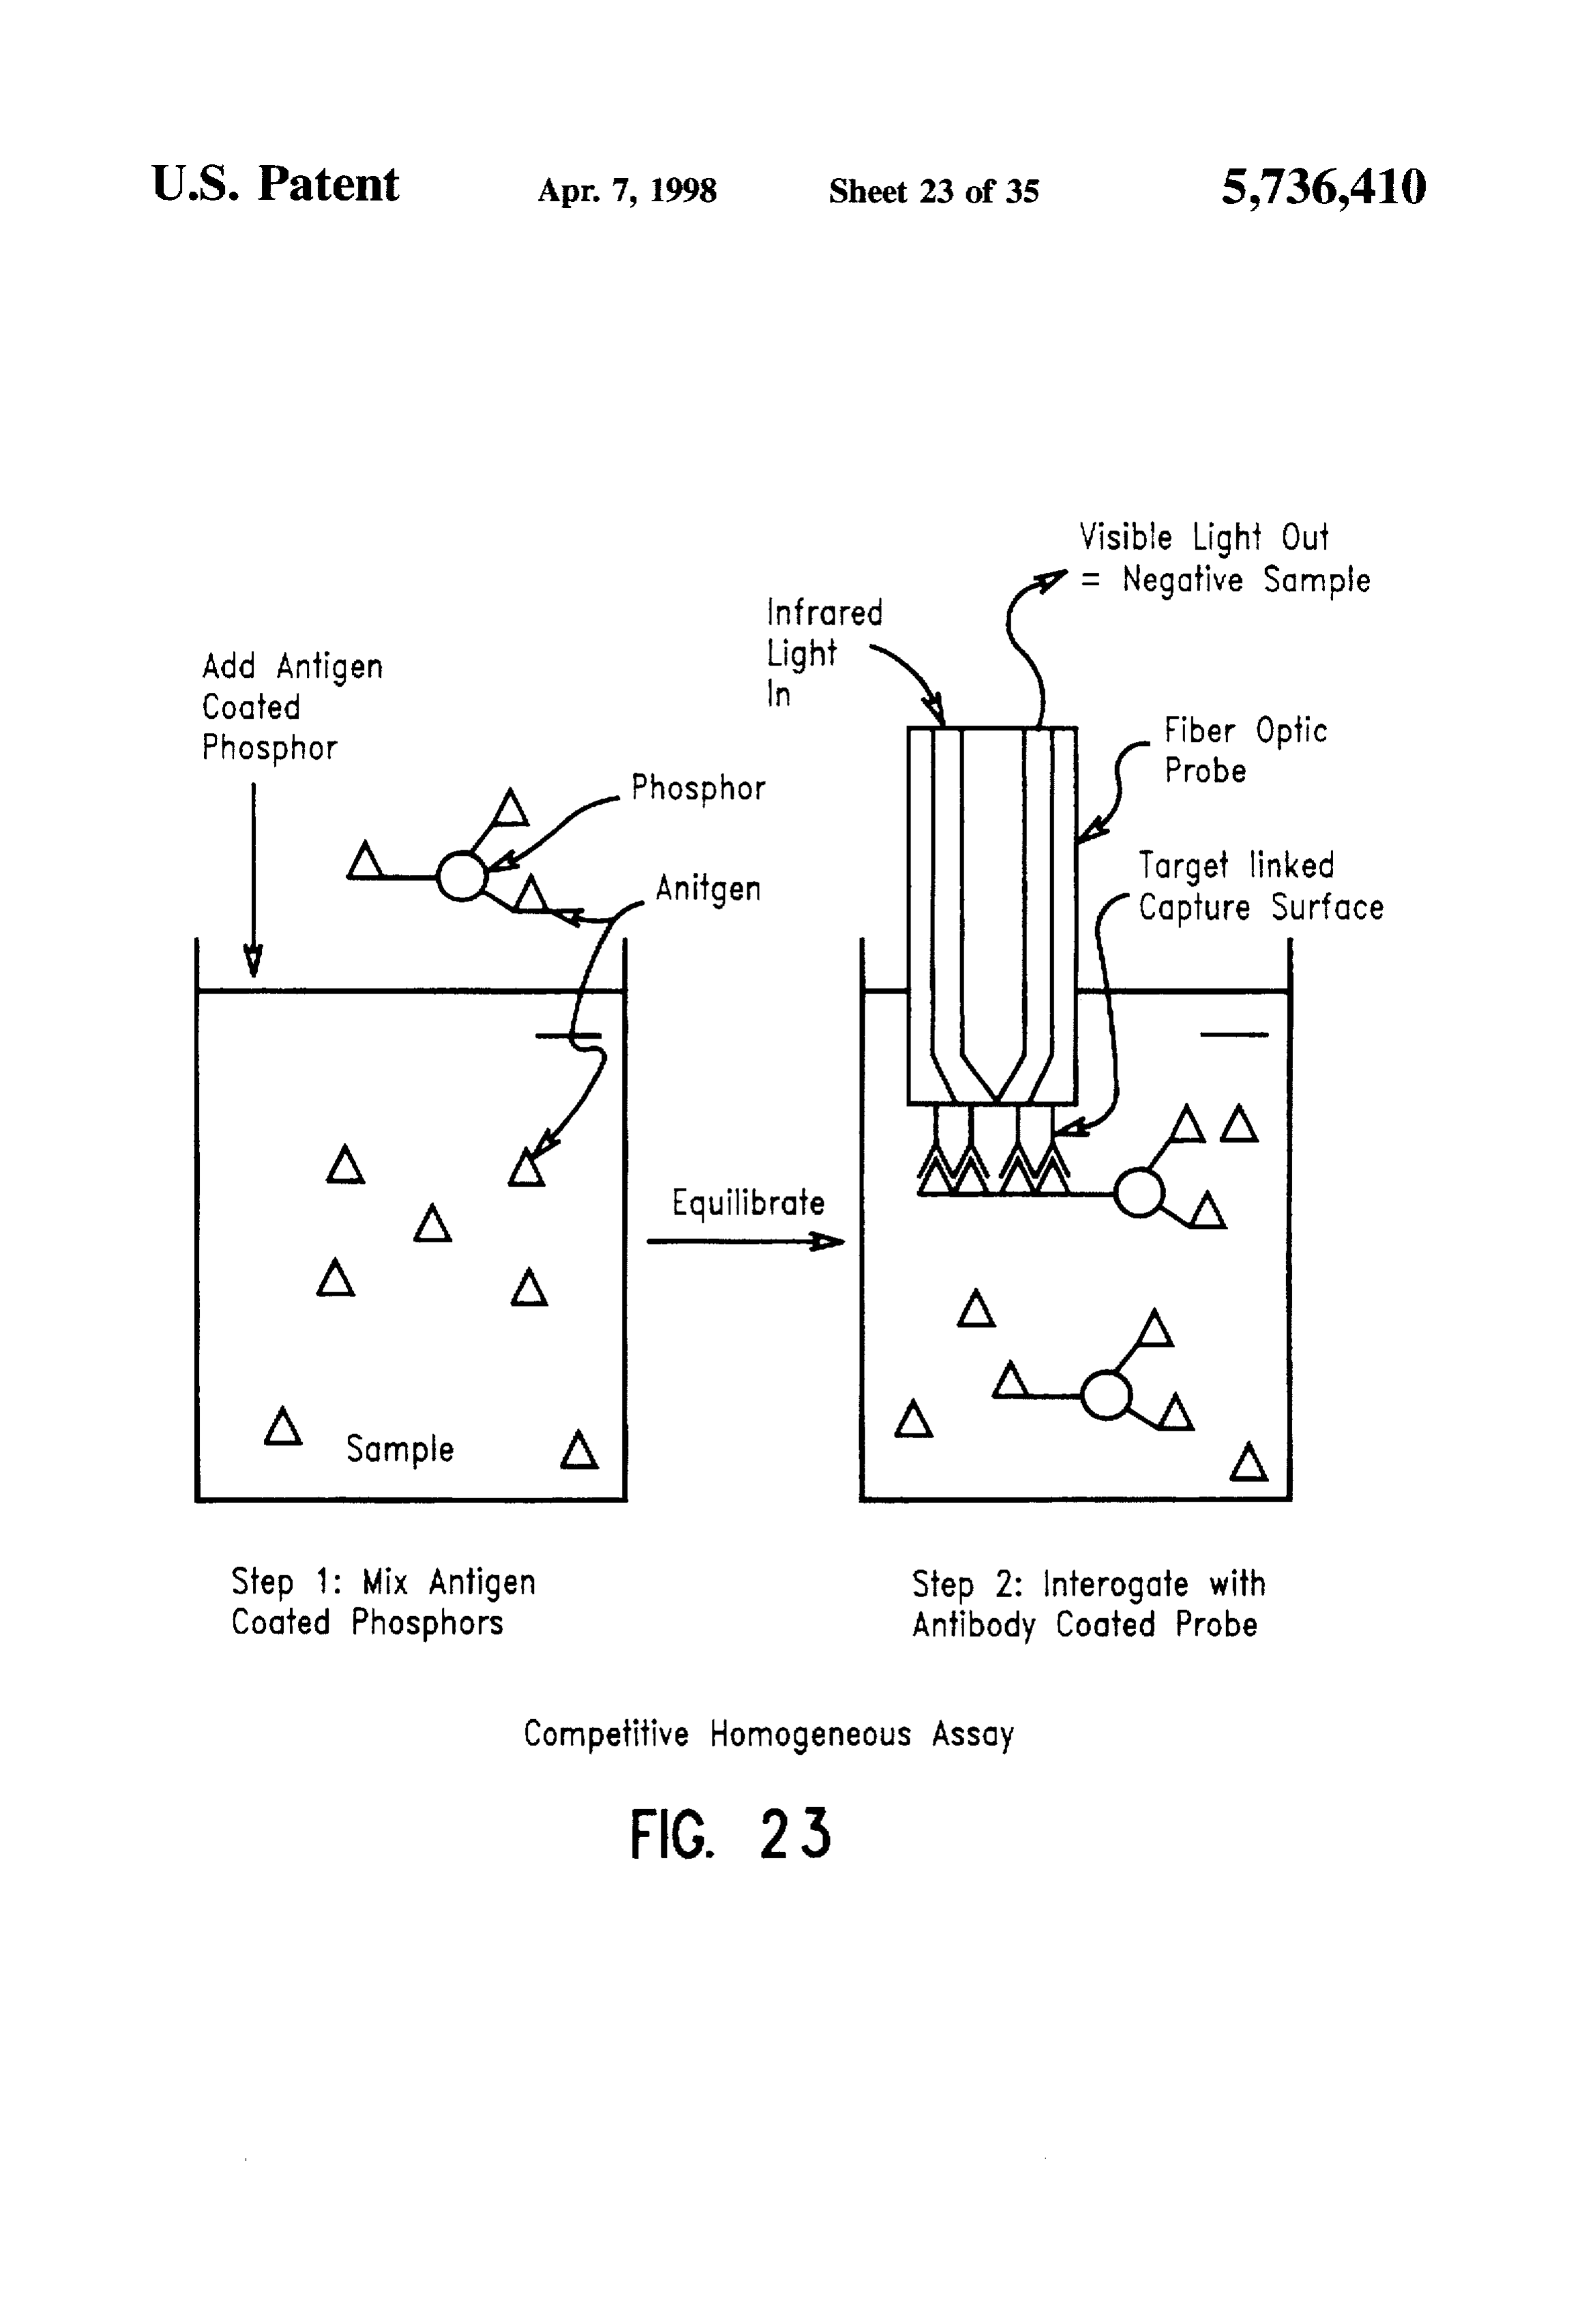
FIG. 22 shows a schematic of an apparatus for phase submicron-size up-converting lanthanide phosphor particle. sensitive detection.
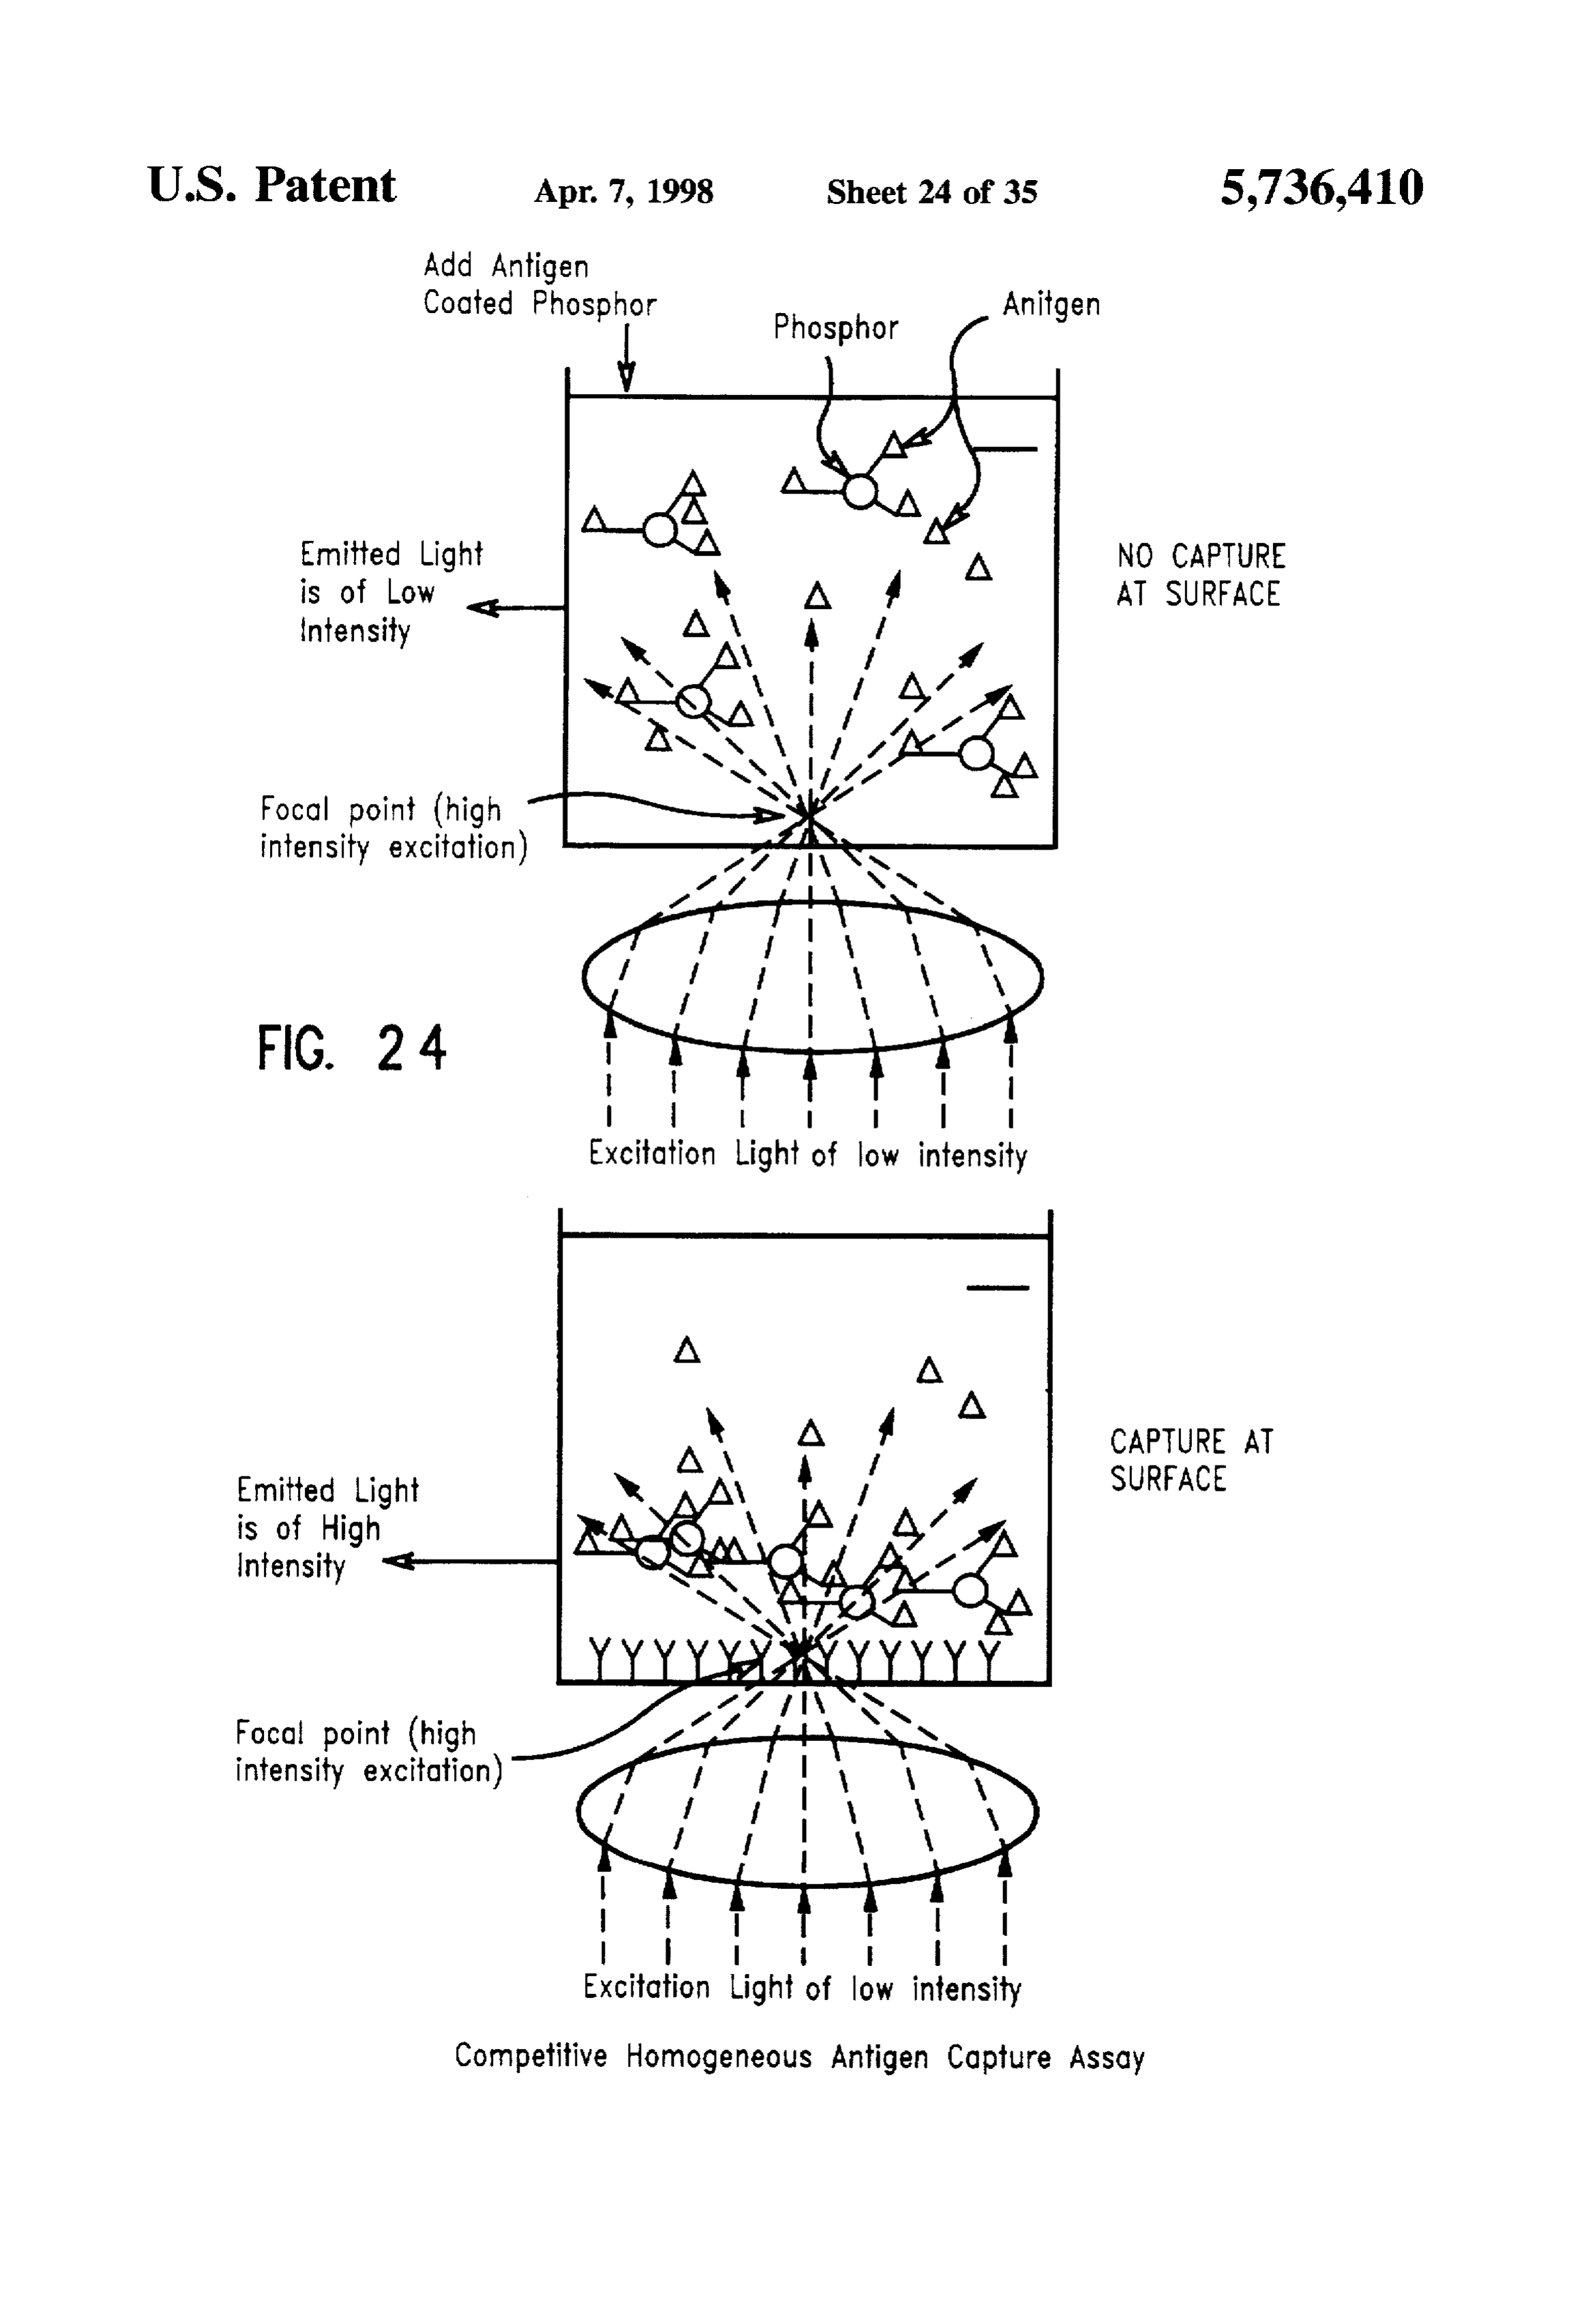
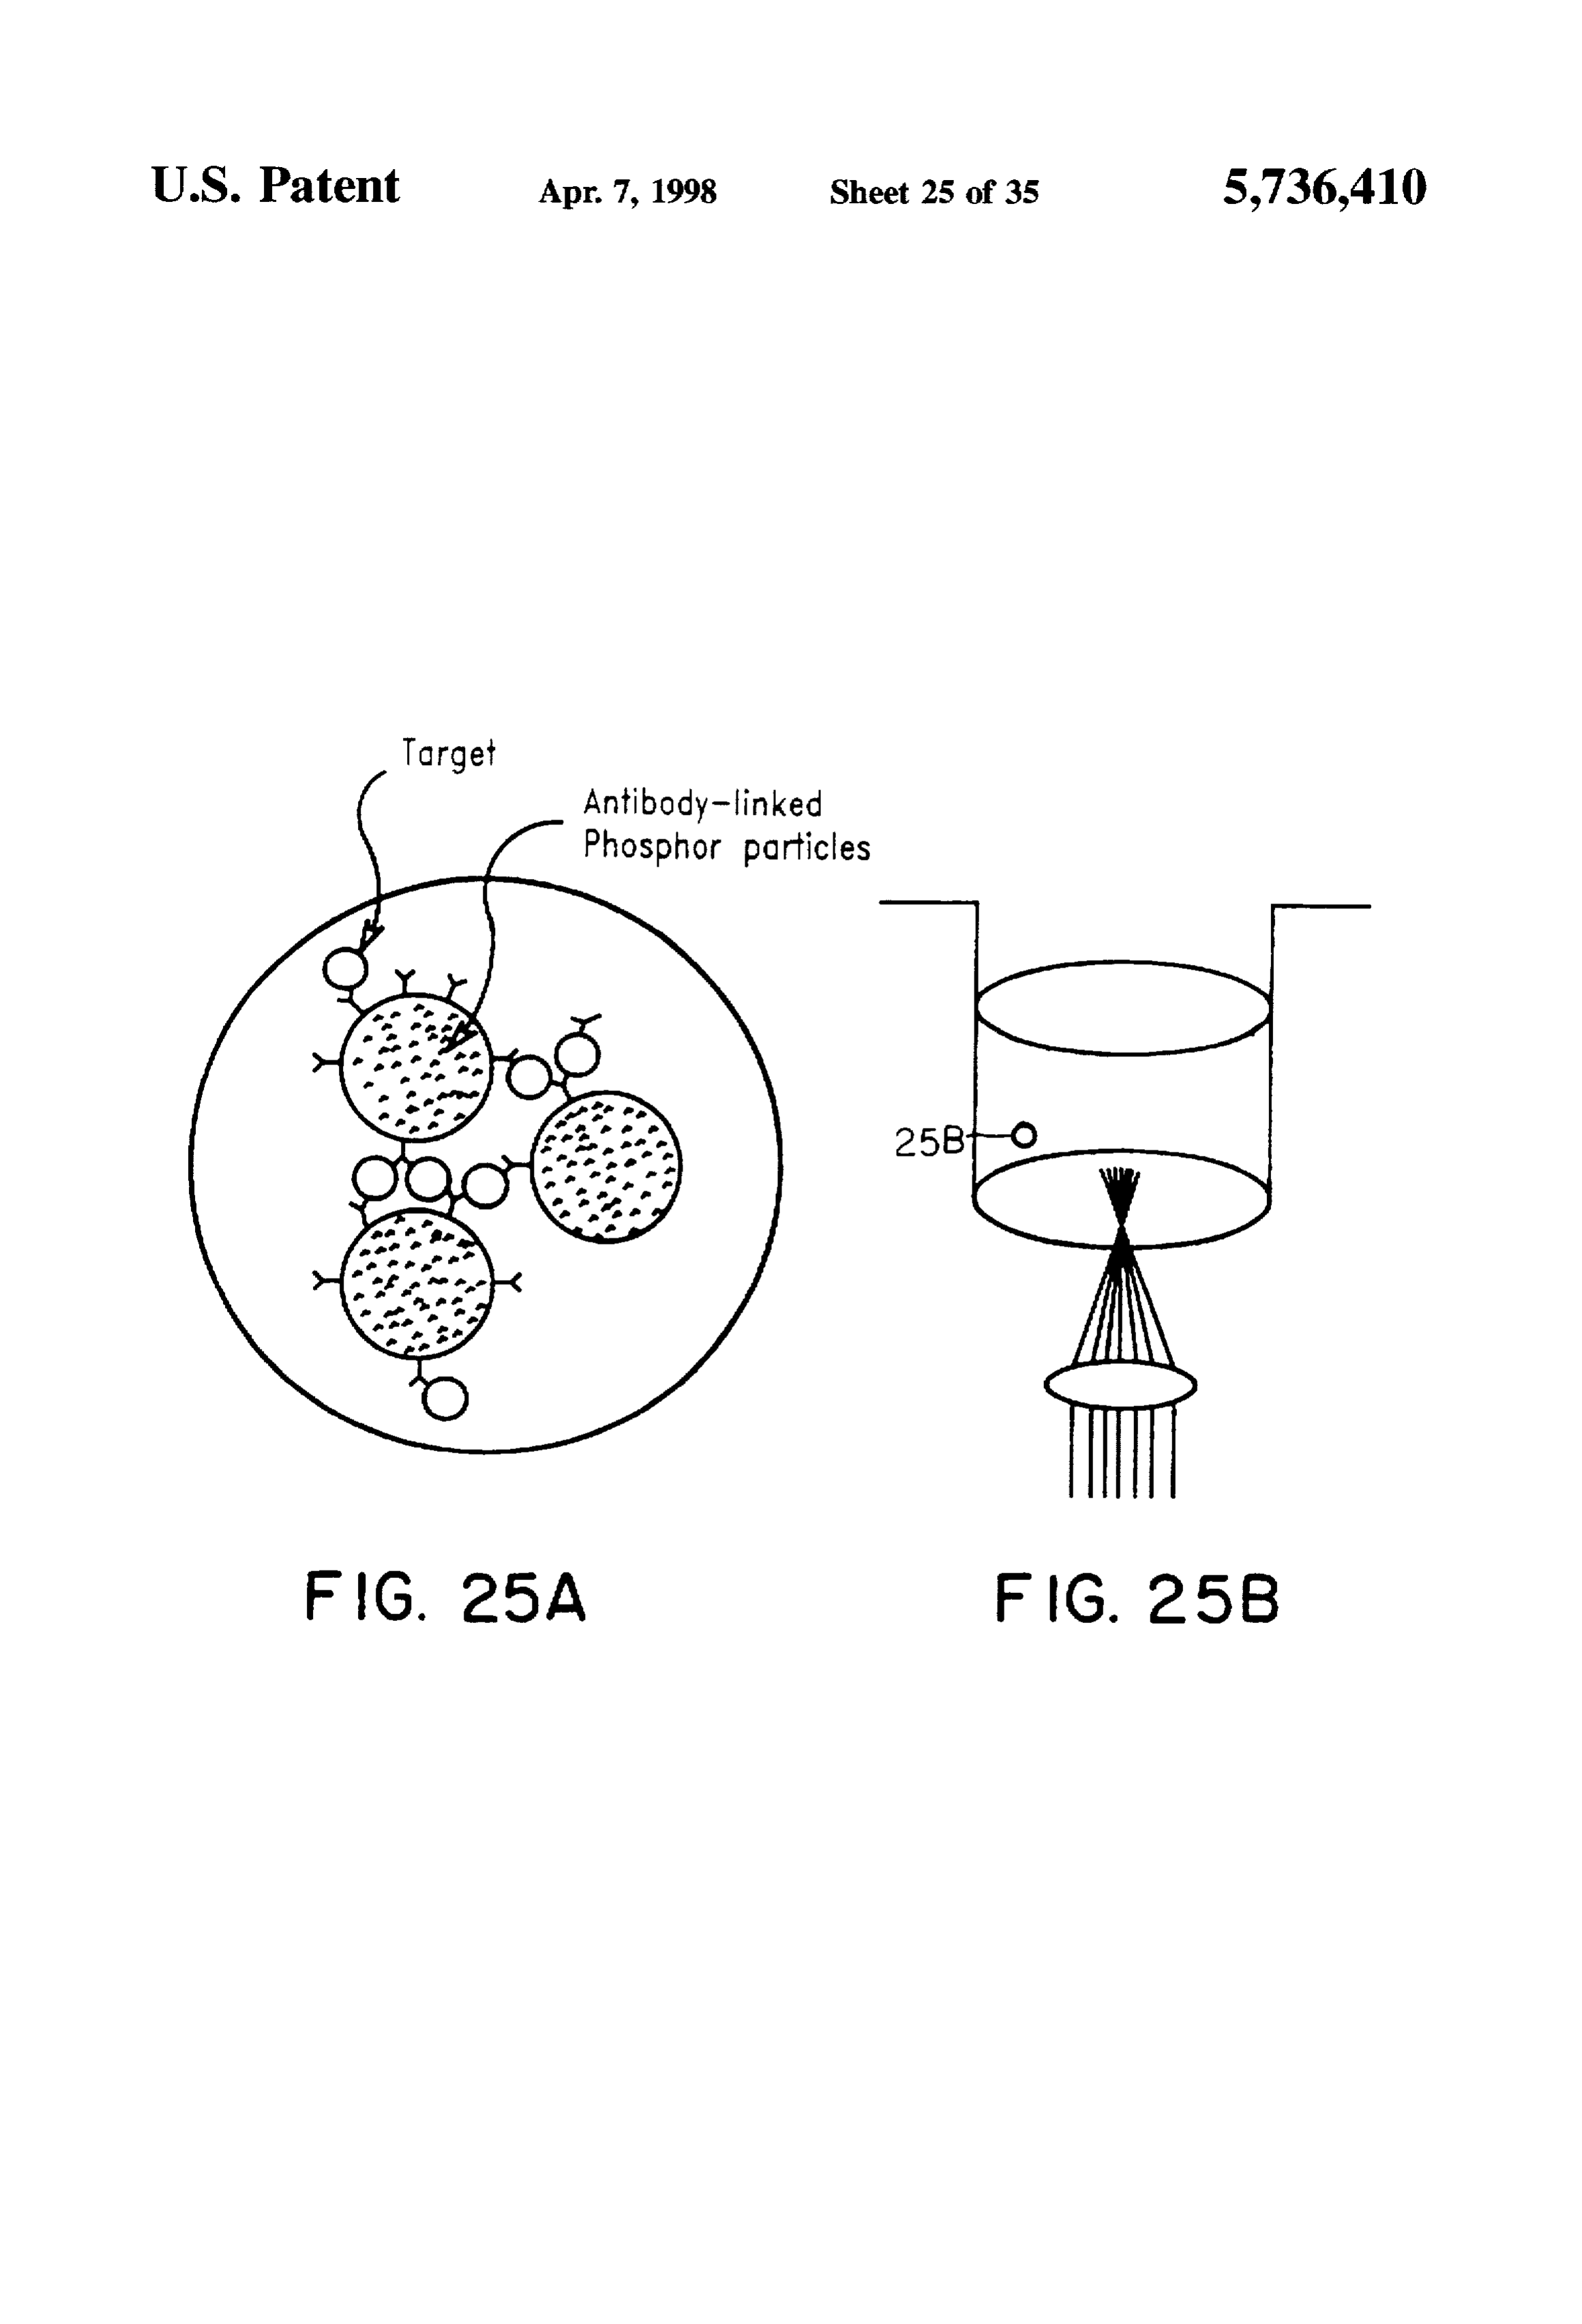
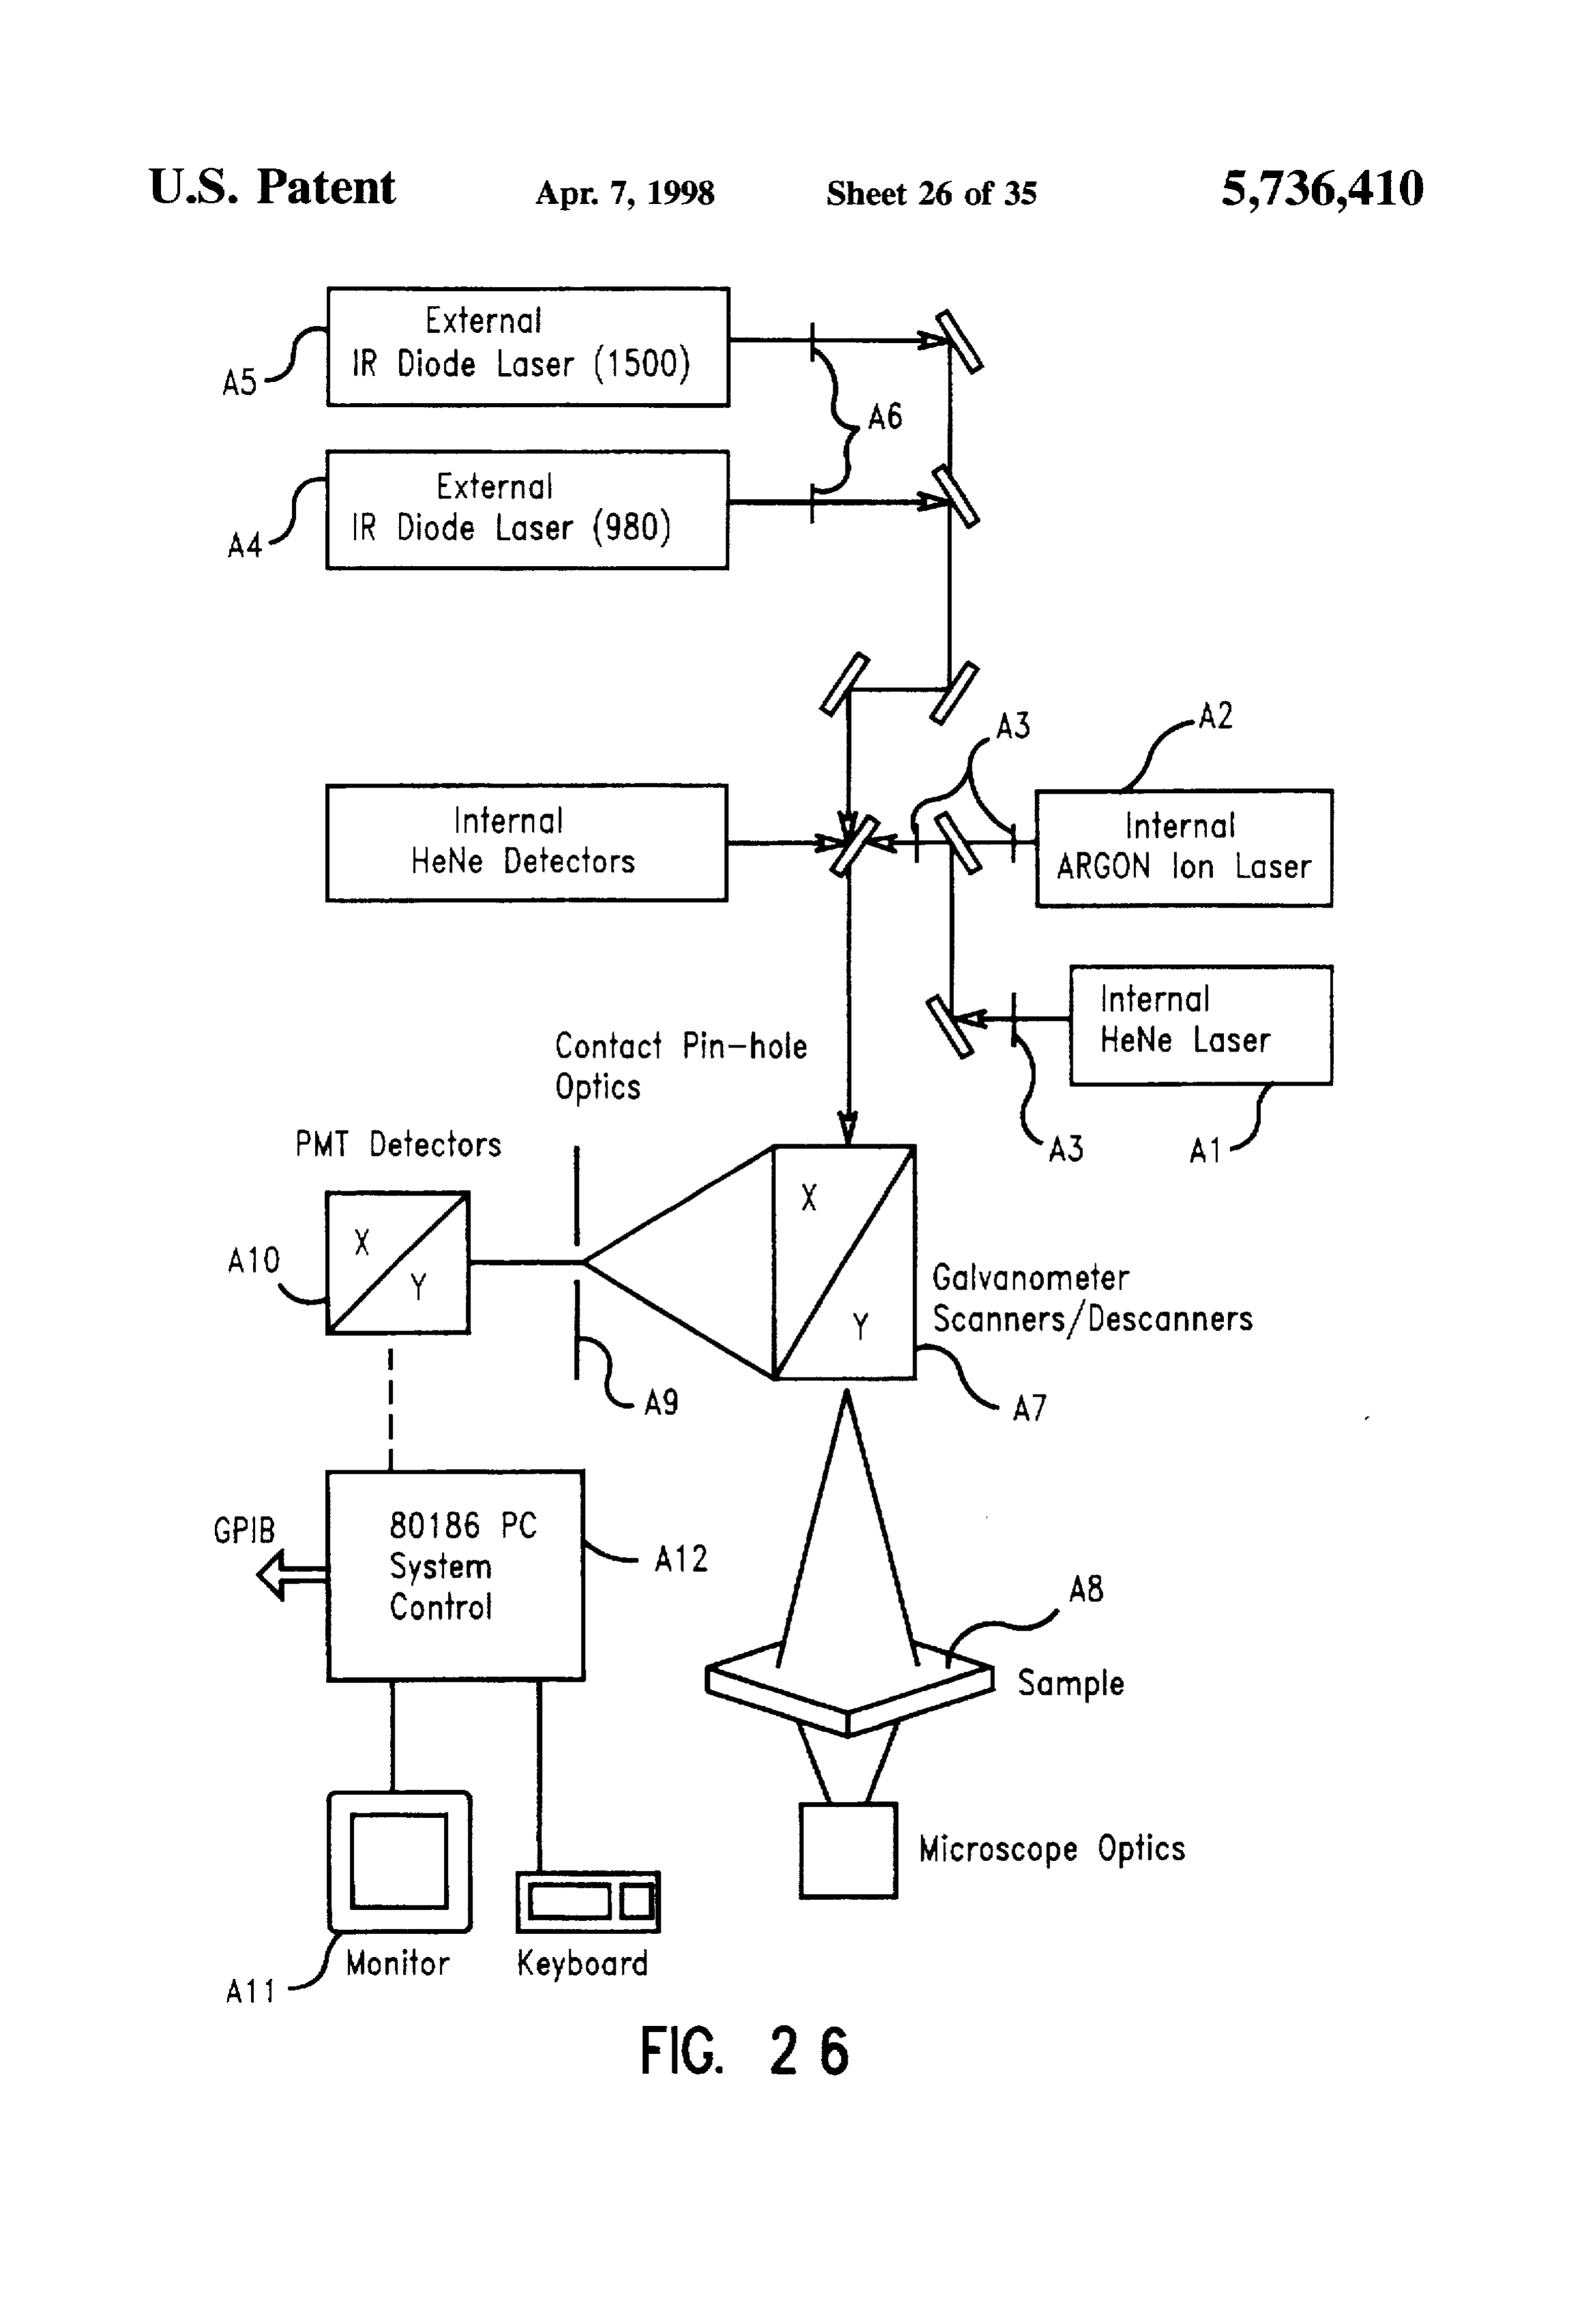
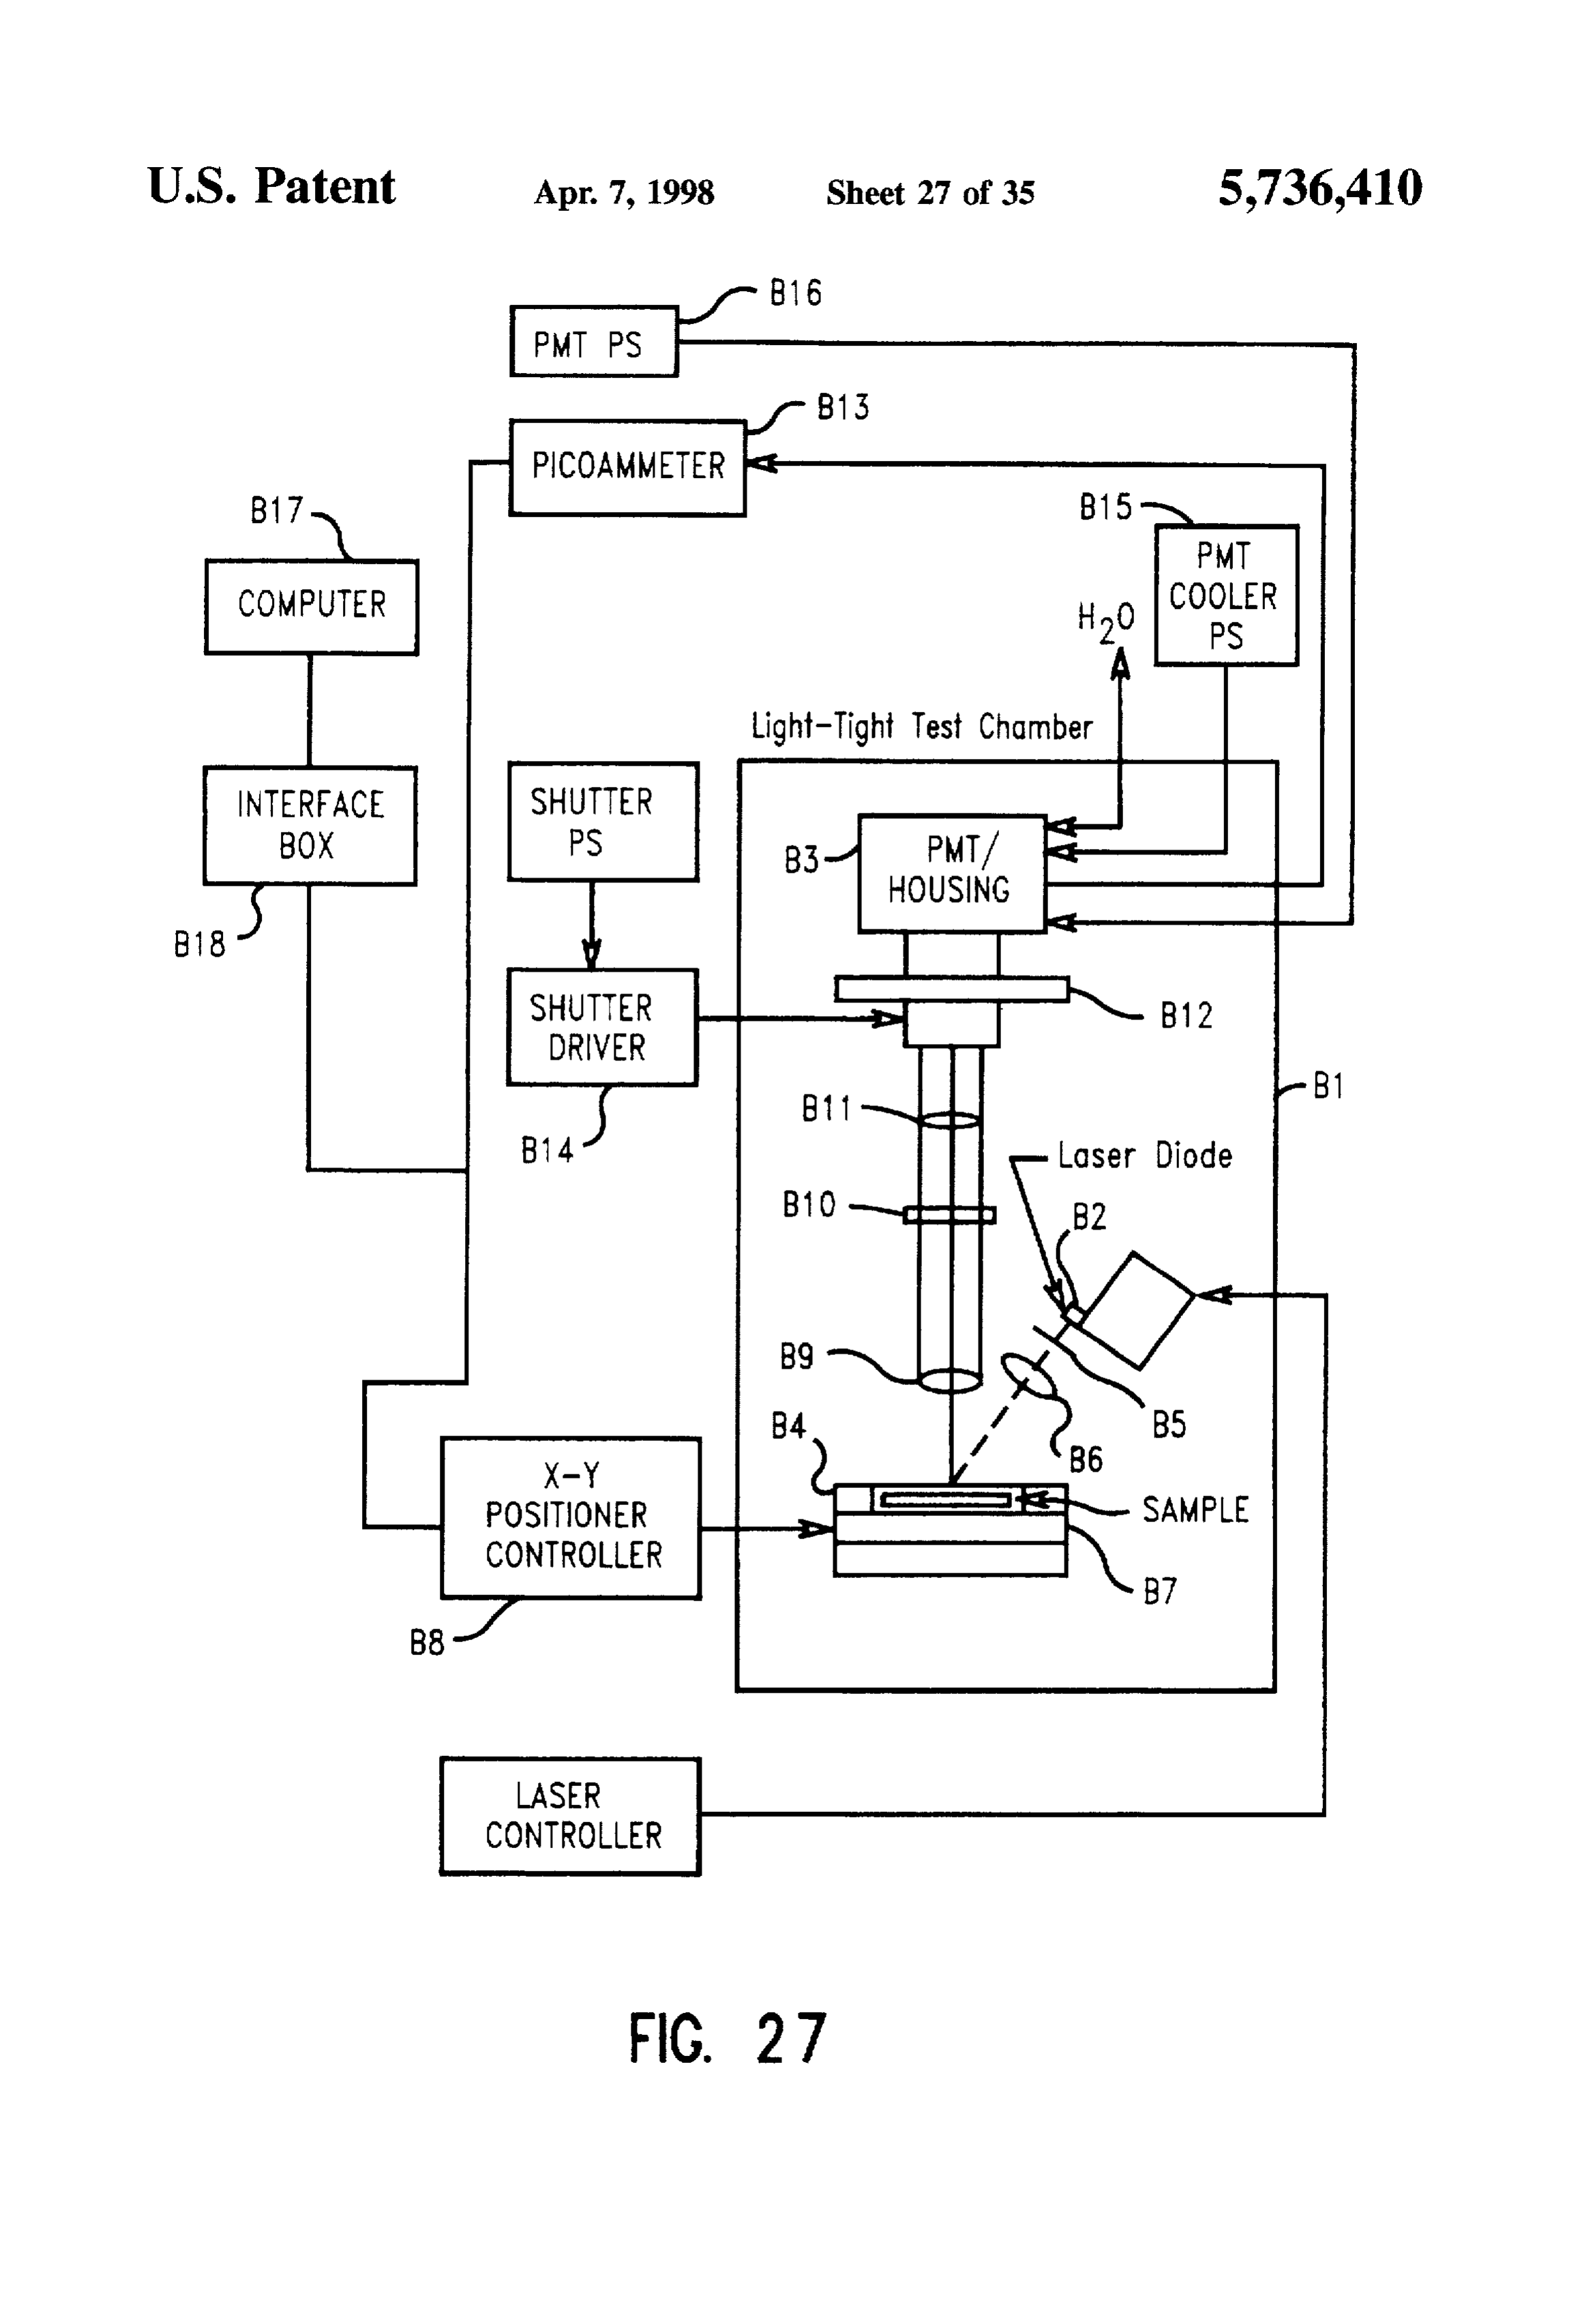
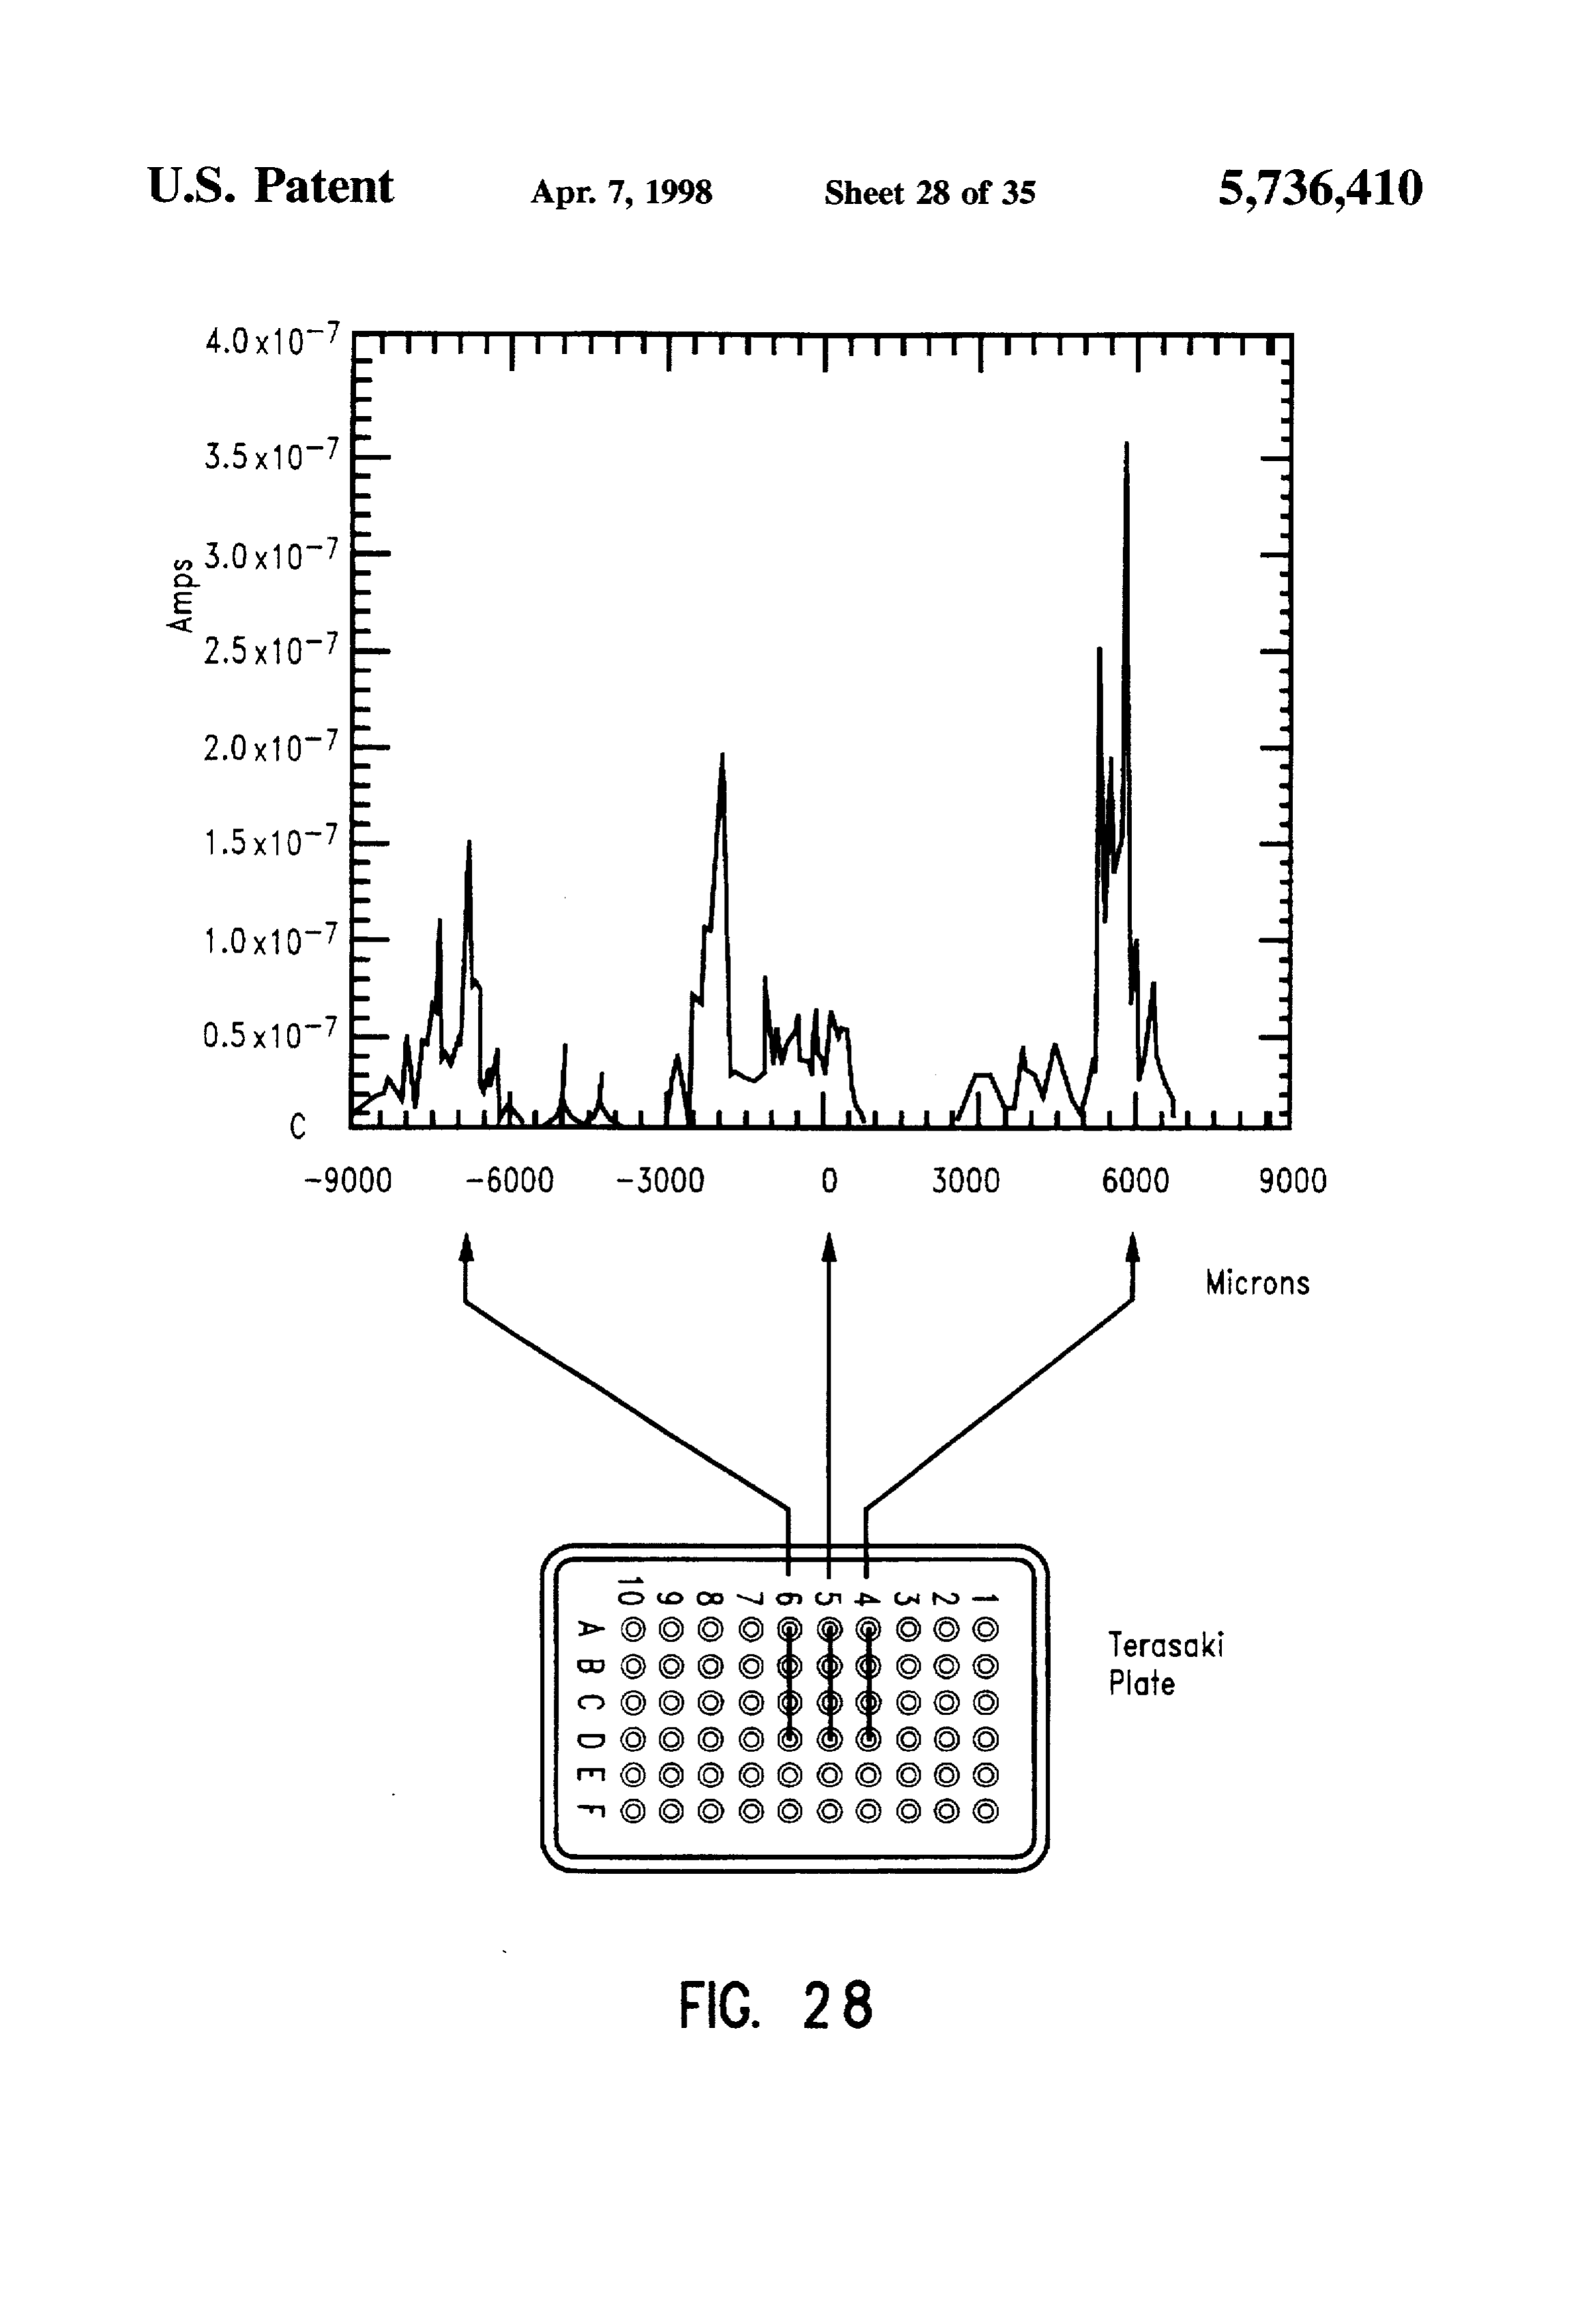
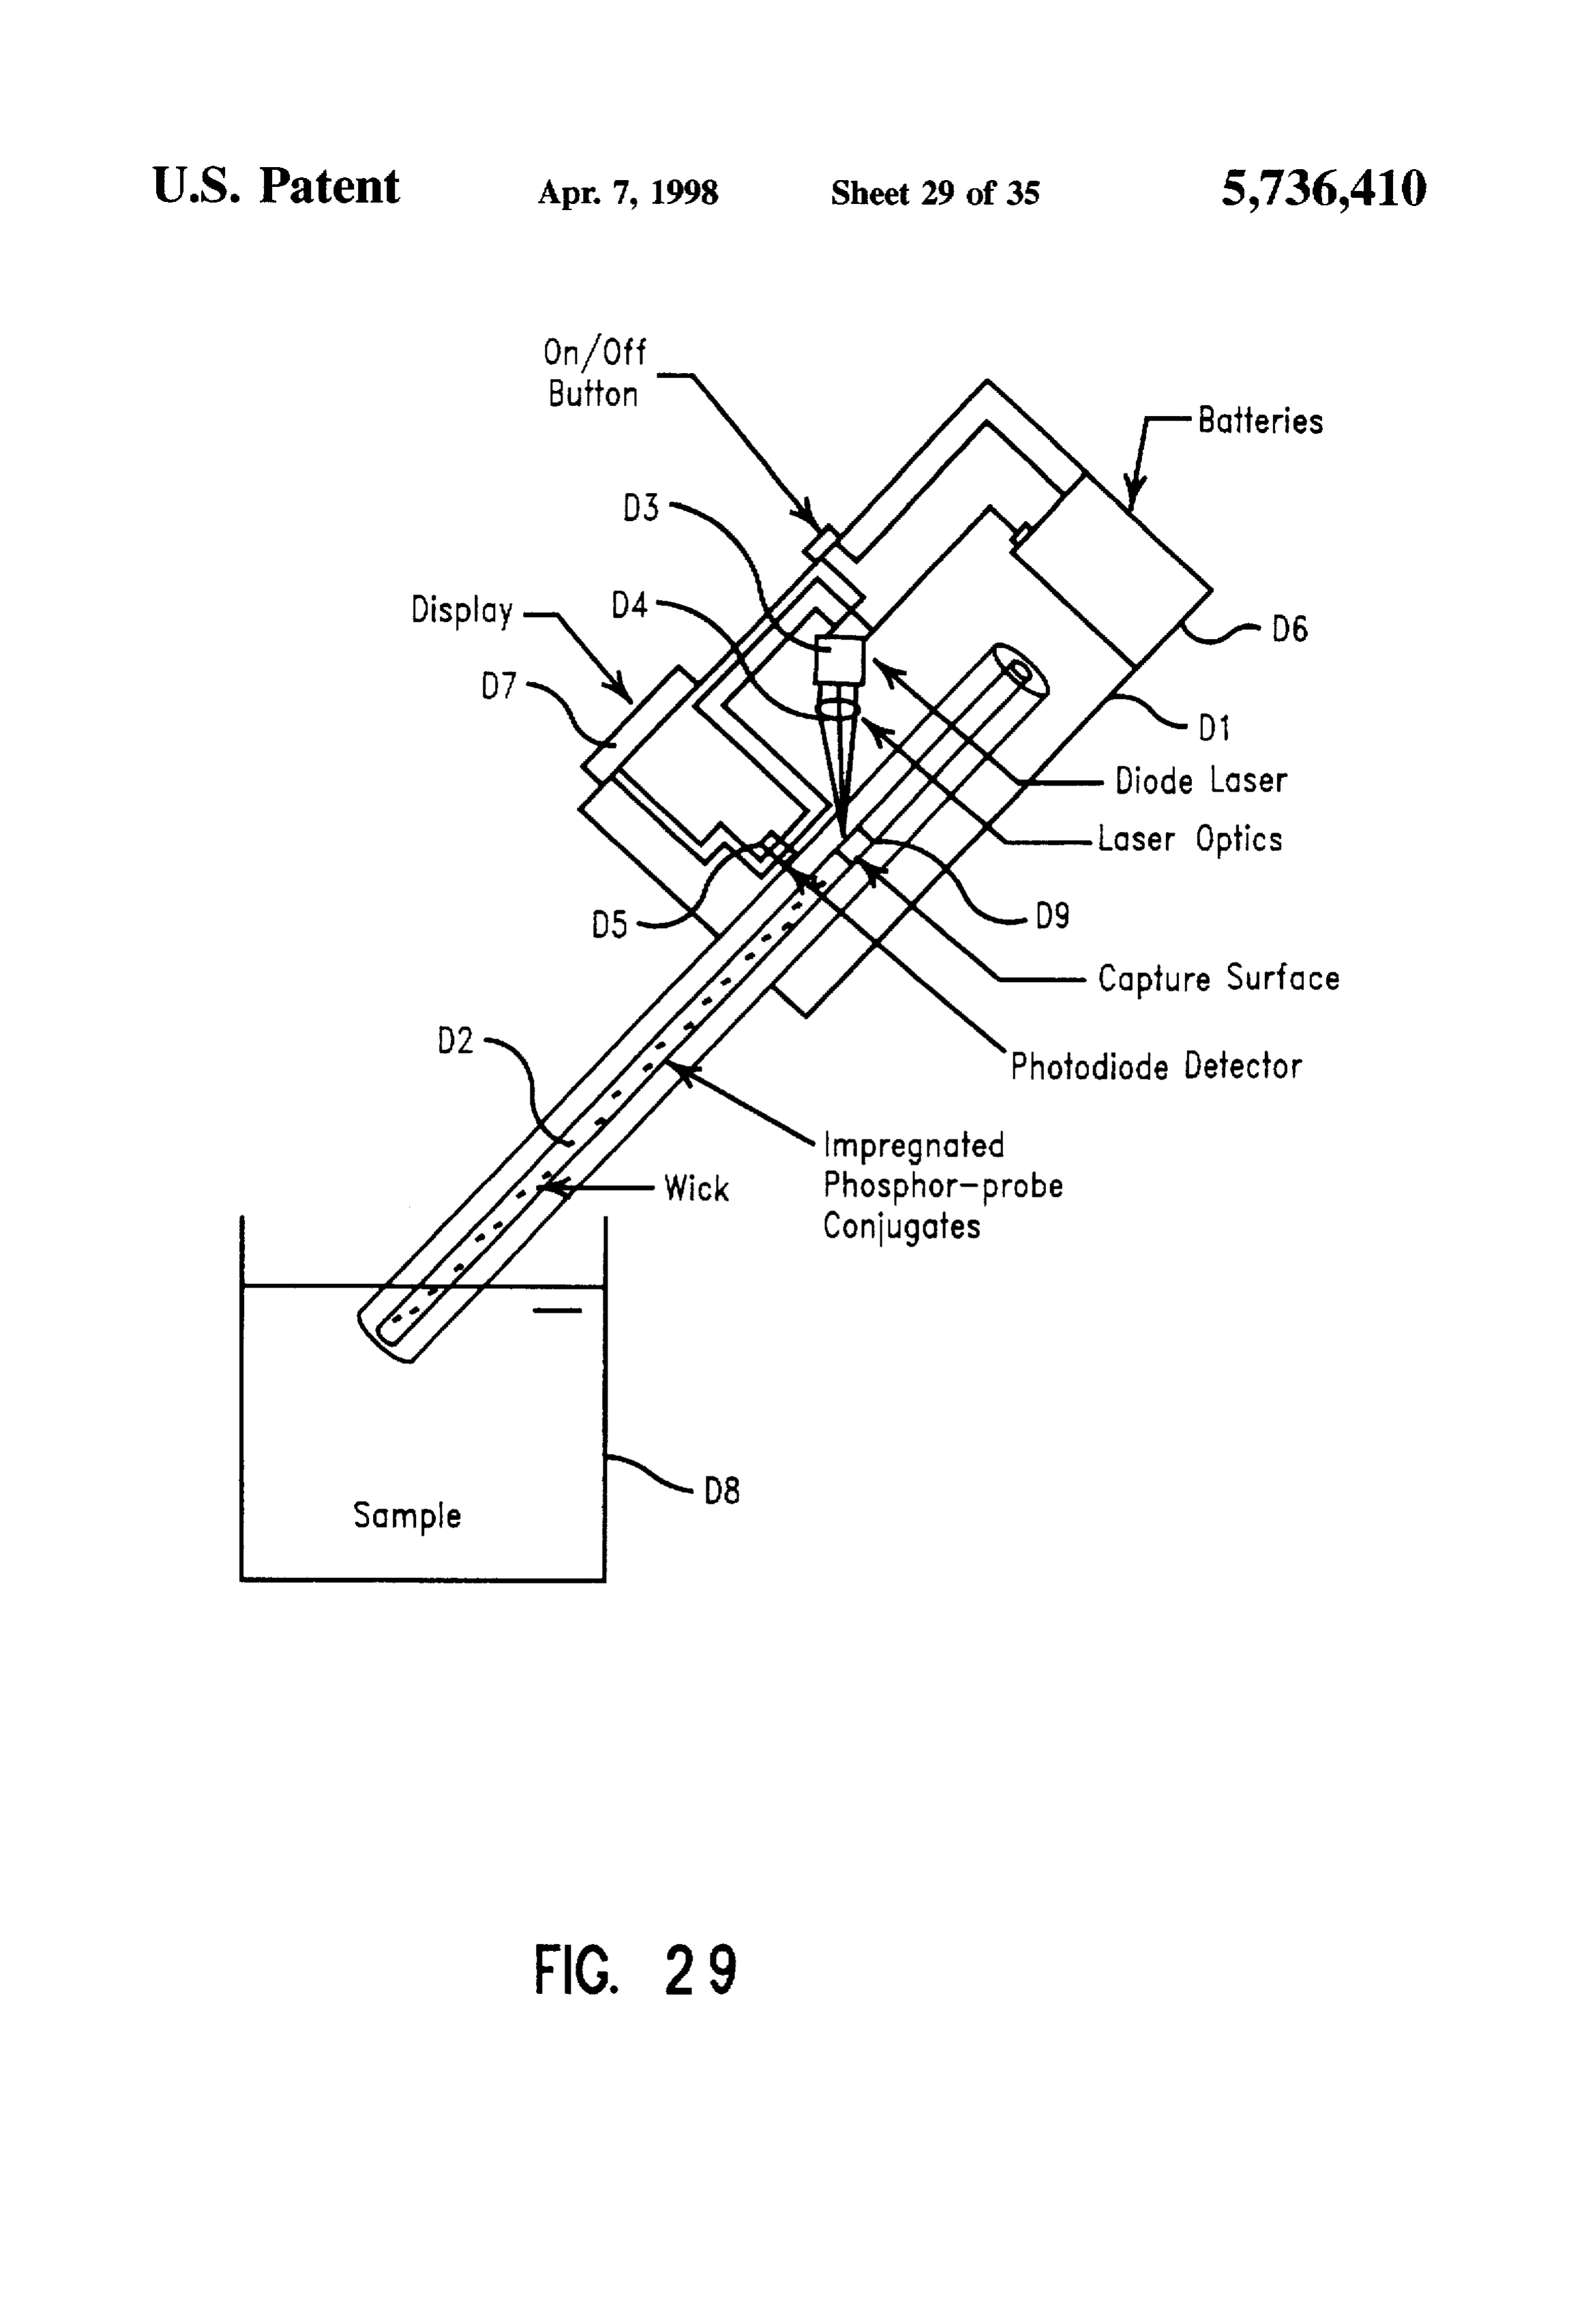
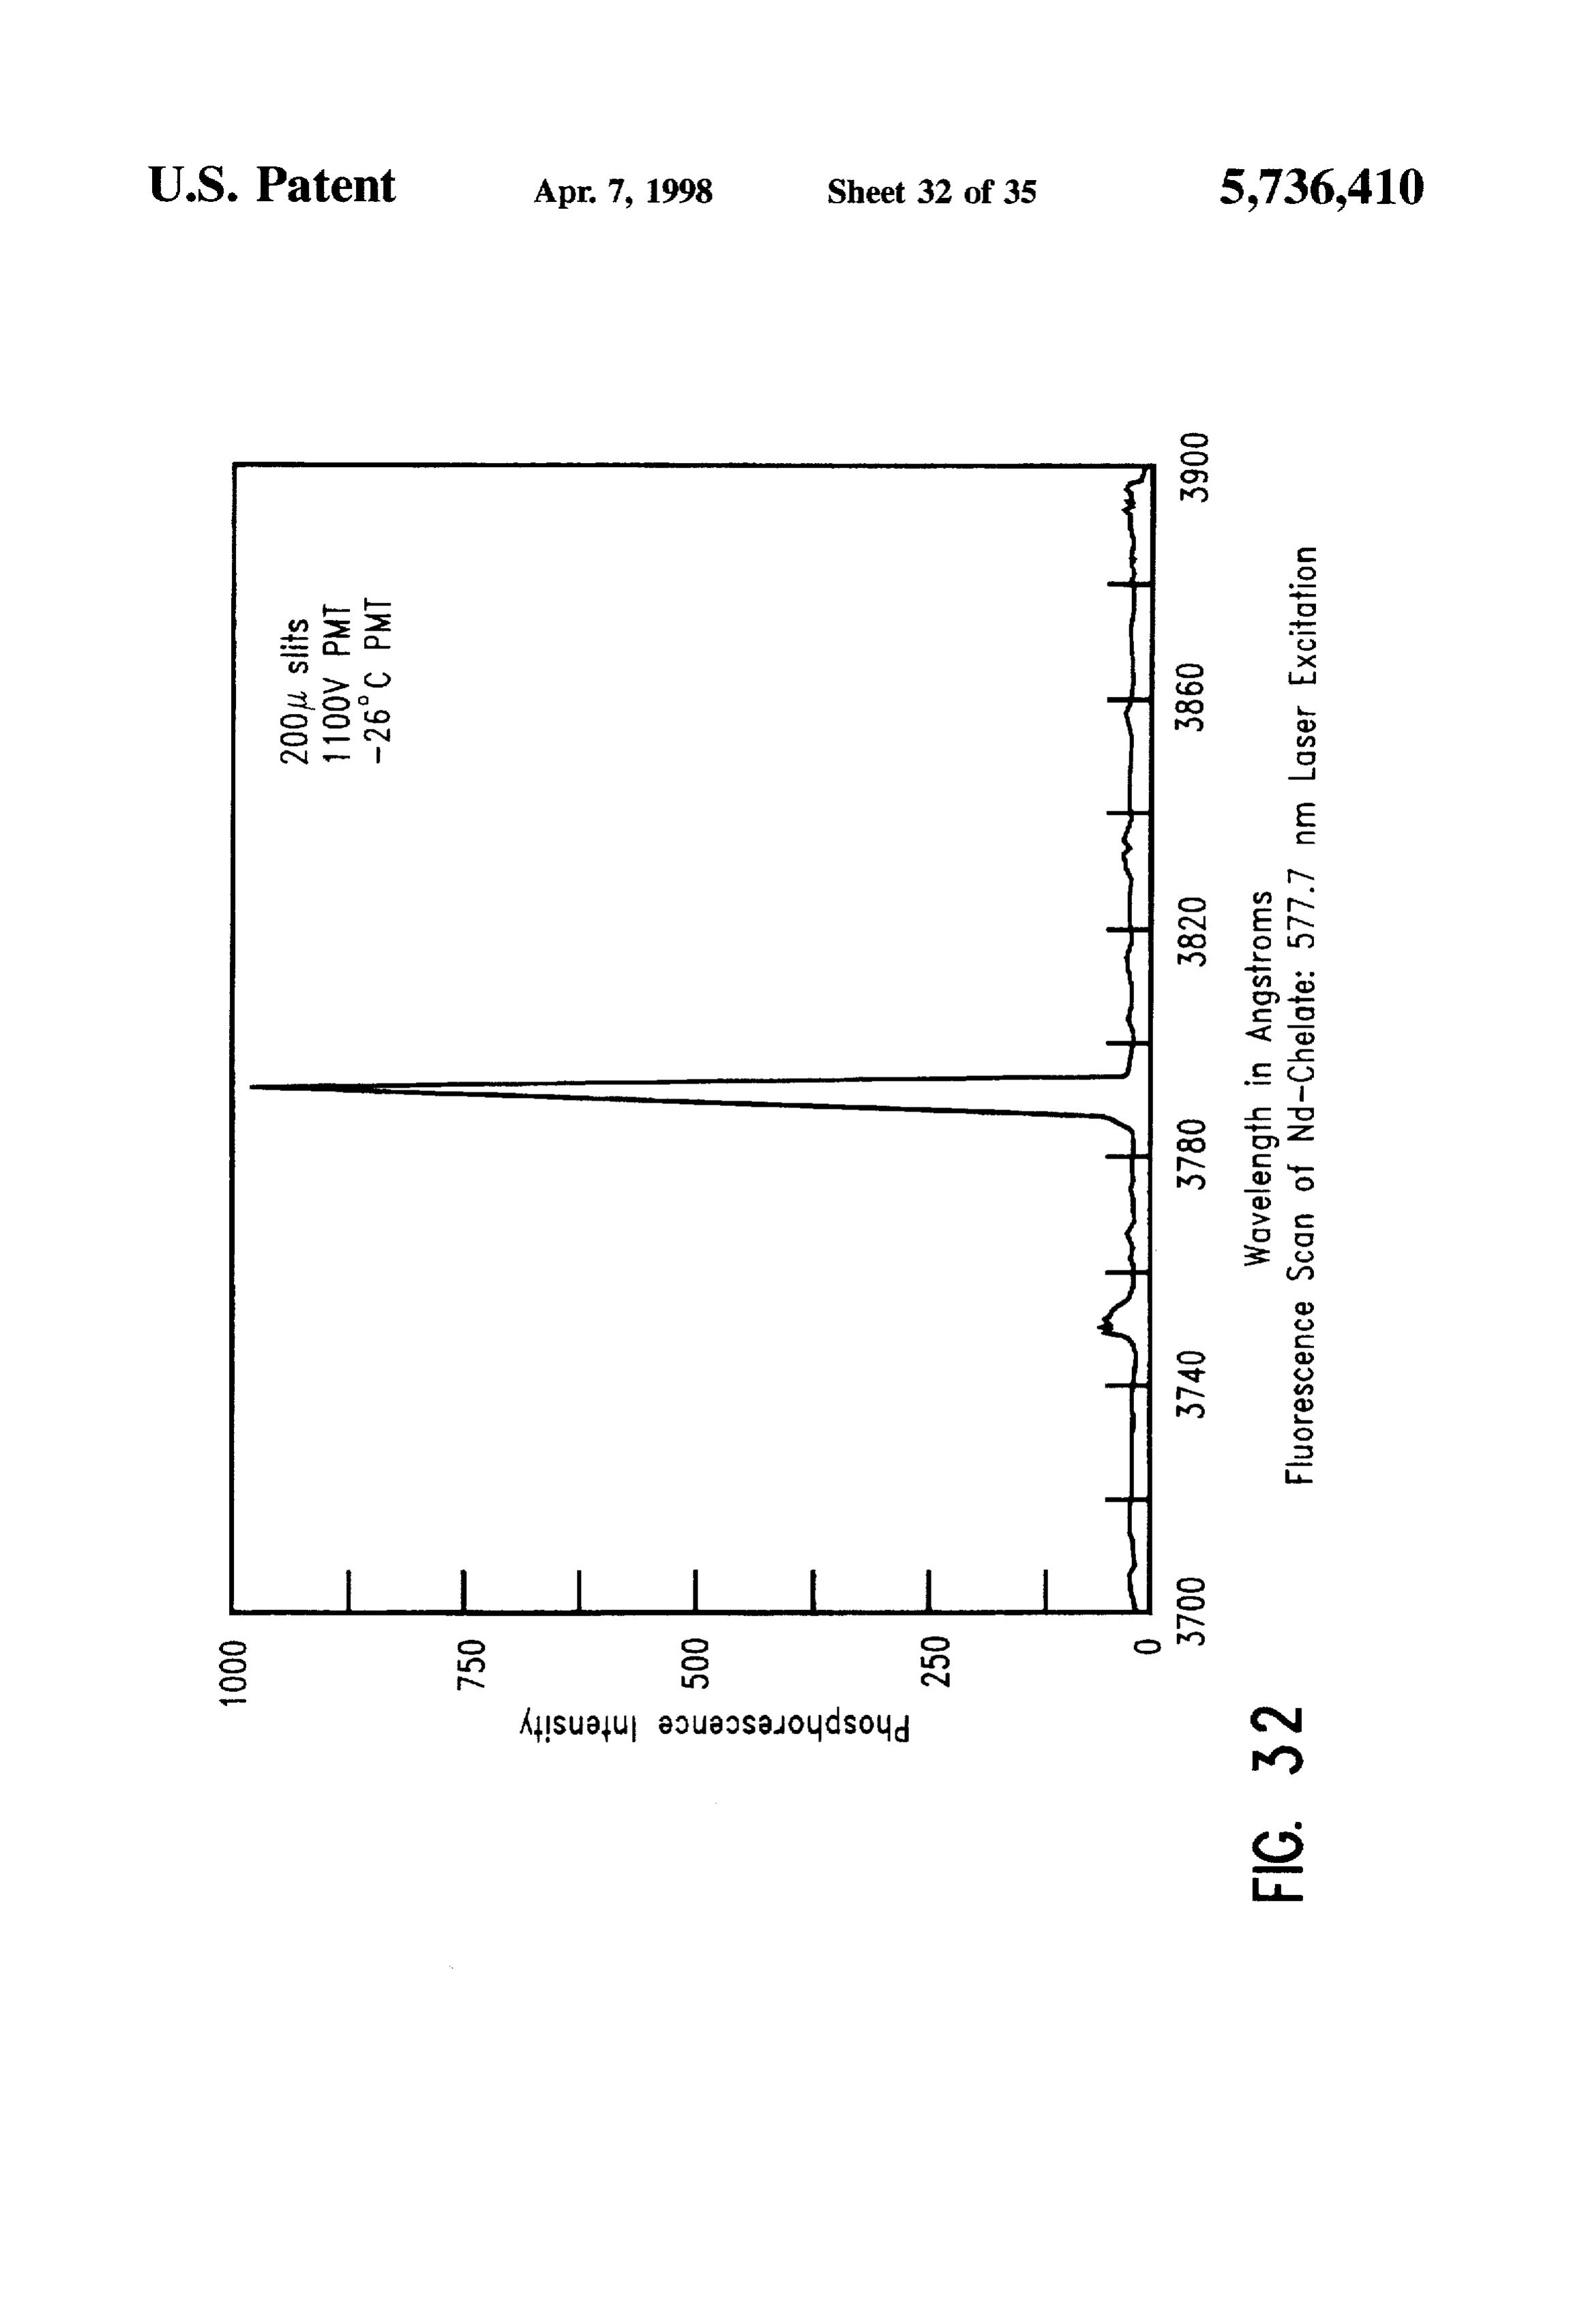
FIG. 23 show a schematic of a competitive homogeneous which As used herein. a "probe" refers to a binding component assay using phosphors as labels and fiber optic illumination antigenicbinds preferentially to one or more targets (e.g. epitopes, polynucleotide sequences. macromo at a capture surface. 40 lecular receptors) with an affinity sufficient to permit dis FIG. 24 show a schematic of a competitive homogeneous crimination of labeled probe bound to target from nonspe antigen capture assay using phosphors as labels and a cifically bound labeled probe (i.e., background). Generally, convergent illumination beam focused on the capture sur the probe-target binding is a non-covalent interaction with a face. binding affinity (KD) of at least about 1x10'M', preferably FIG. 25 shows a schematic of a homogeneous immuno 45 with at least about 1x10'M', and more preferably with an precititation assay using phosphors as labels and a conver affinity of at least about 1x10'M' or greater. Antibodies gent illumination beam focused on the capture surface typically have a binding affinity for cognate antigen of about wherein the capture surface collects immunoprecititates. 1x10'M' or more. For example but not limitation, probes FIG. 26 shows a block diagram of one embodiment of of the invention include: antibodies, polypeptide hormones, apparatus for carrying out the present invention on a sample 50 polynucleotides, streptavidin, Staphlyococcus aureus pro using a microscope. tein A. receptor ligands (e.g., steroid or polypeptide FIG. 27 is a block diagram of a microtiter plate reader for hormones), leucine zipper polypeptides, lectins, antigens use with the present invention. (polypeptide, carbohydrate. nucleic acid, and hapten FIG. 28 is an illustration of the data for upconverting 55 epitopes), and others.
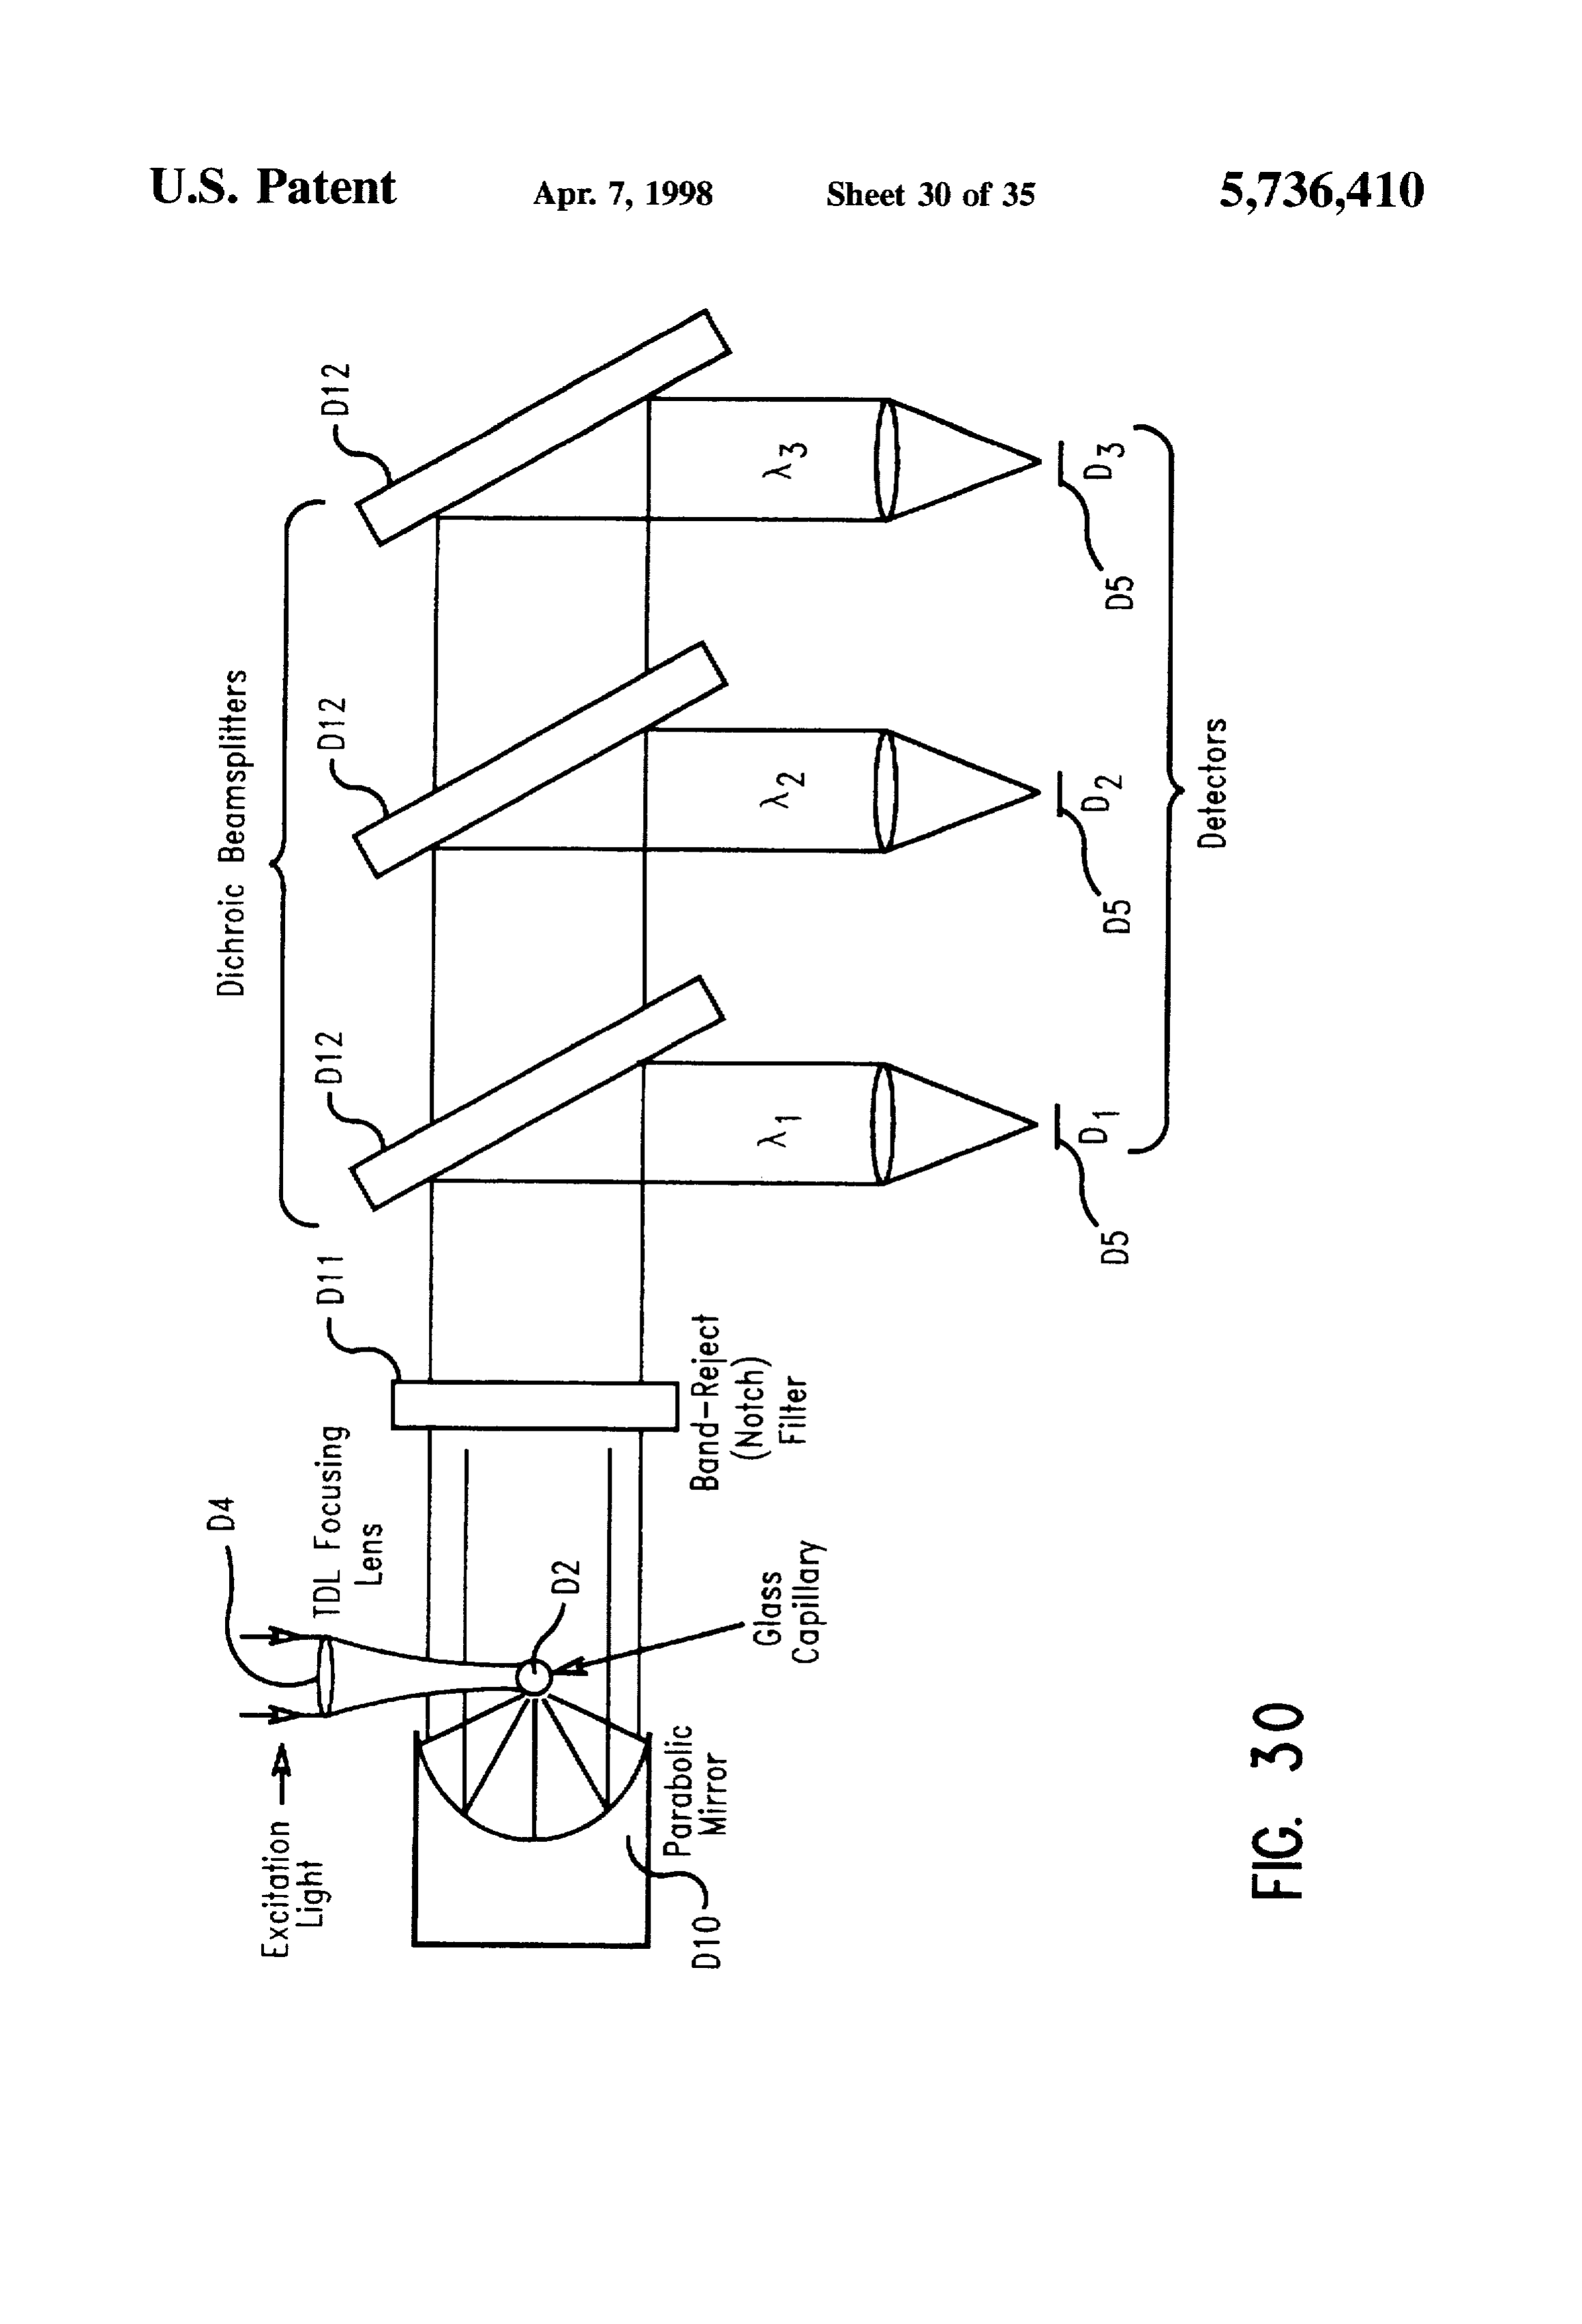
phosphors in three test wells. As used herein, a "probe-label conjugate" and a "labeled FIG. 29 is a schematic view of a second embodiment of probe" refer to a combination comprising a label attached to a hand-held probe for carrying out the present invention. a probe. In certain embodiments, more than one label FIG. 30 illustrates a three channel configuration using substituent may be attached to a probe. Alternatively, in some embodiments more than one probe may be attached to interference filters.
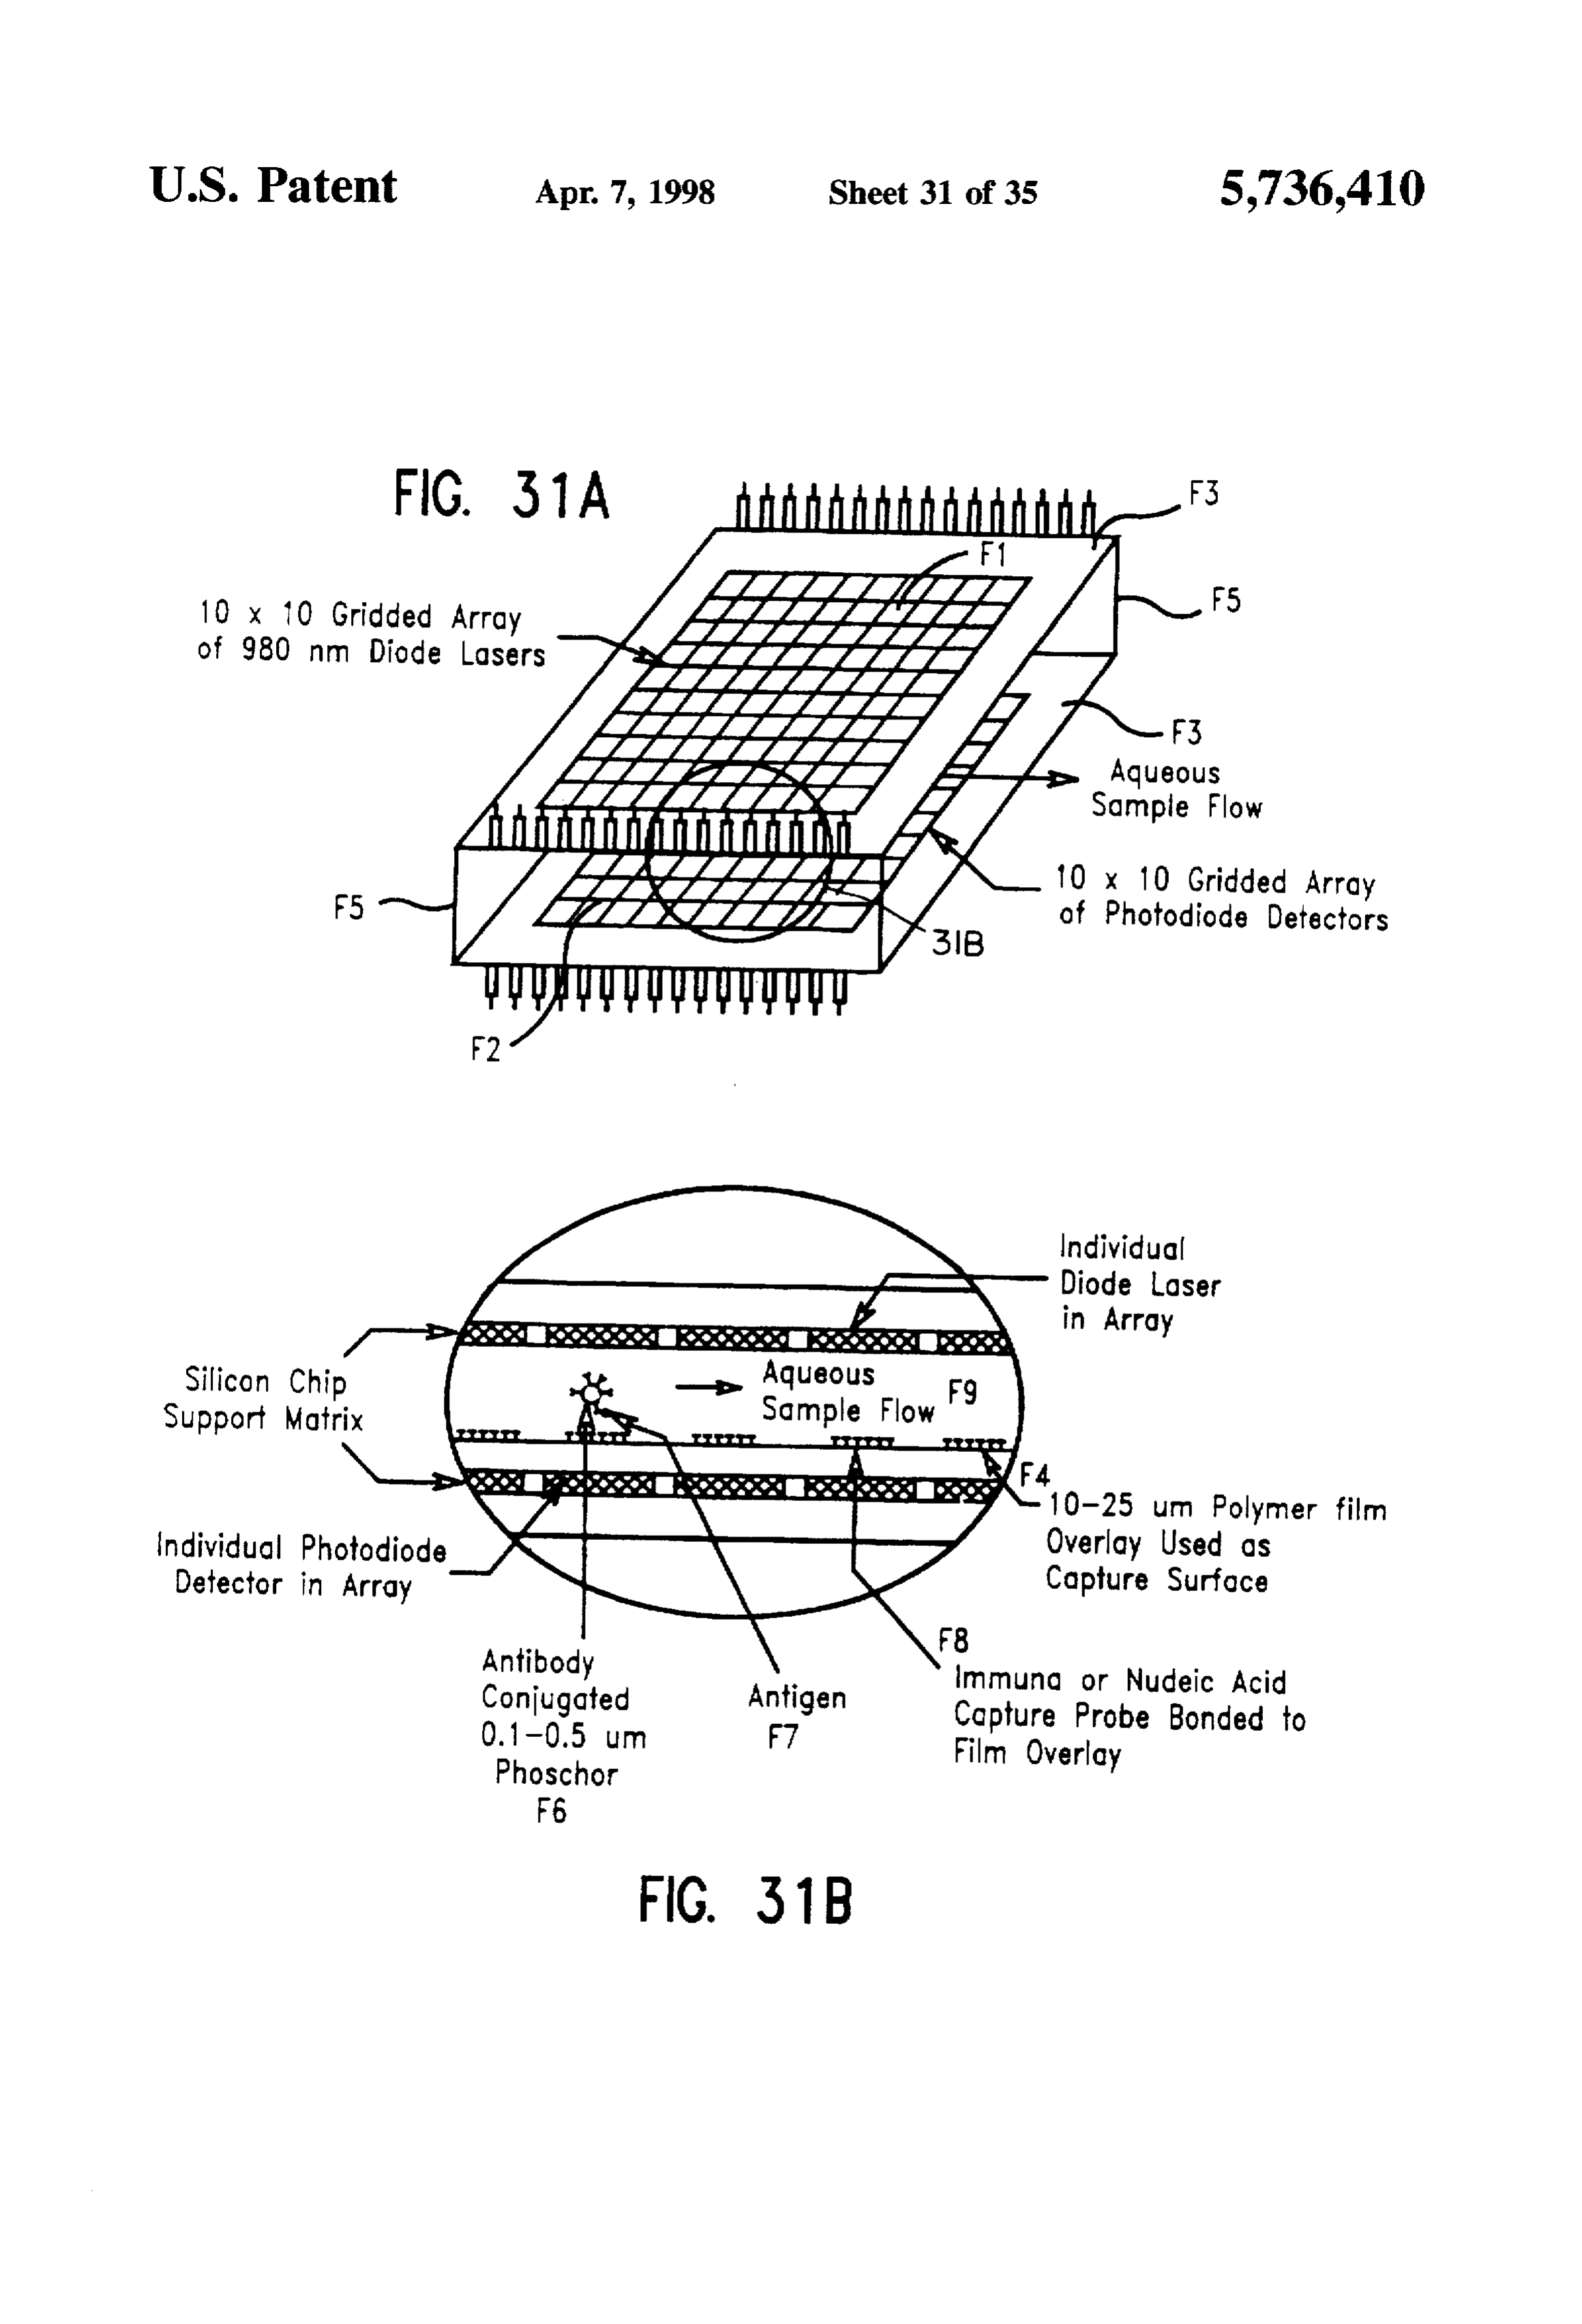
FIG. 31A is an illustration of an embodiment of the a label (e.g., multiple antibody molecules may be attached to a submicron-size inorganic up-converting phosphor bead).
invention in which a diode laser array F1 and a detector Various attachment chemistries can be employed to link a array F2 are combined in a single device. label to a probe, including, but not limited to, the formation FIG. 31B is a detailed view of a small section of the of: covalent bonds, hydrogen bonds, ionic bonds, electro device shown in FIG. 31A. 65 static interactions, and surface tension (phase boundary) FIG. 32 shows a fluorescence scan of a Nd-chelate excited interactions. Attachment of label can also involve incorpo with 577.7 nm laser illumination. ration of the label into or onto microspheres, microparticles,
Page 43
immunobeads, and superparamagnetic magnetic beads sponding to a particular mRNA sequence, a portion of a (Polysciences. Inc.. Warrington, Pa.; Bangs Laboratories, genomic clone, a synthetic oligonucleotide having sufficient Inc. 979 Keystone Way, Carmel. Ind. 46032). For example. sequence homology to a known target sequence (e.g., a inorganic up-converting phosphor particles can be encapsu telomere repeat TTAGGG or an Alu repetitive sequence) for lated in microspheres that are composed of polymer material specific hybridization, a transcribed RNA (e.g., from an SP6 that is essentially transparent or translucent in the wave cloning vector insert), or a polyamide nucleic acid (Nielsen length range(s) of the excitation and emitted electromagnetic et al. (1991) Science 254: 1497). Various target polynucle radiation (U.S. Pat. No. 5.132,242, incorporated herein by otides may be detected by hybridization of a labeled probe reference). Such microspheres can be functionalized by polynucleotide to the target sequence(s). For example but surface derivatization with one or more reactive groups (e.g. 10 not limitation, target polynucleotides may be: genomic carboxylate, amino. hydroxylate, or polyacrolein) for cova sequences (e.g., structural genes, chromosomal repeated lent attachment to a probe, such as a protein. Probe-label sequences, regulatory sequences, etc.). RNA (e.g., mRNA, conjugates can also comprise a phosphor chelate. hnRNA, rRNA, etc.), patbogen sequences (e.g. viral or As used herein, the term “target” and "target analyte” mycoplasmal DNA or RNA sequences), or transgene refer to the object(s) that is/are assayed for by the methods 15 sequences.
of the invention. For example but not limitation. targets can "Specific hybridization” is defined herein as the formation comprise polypeptides (e.g., hCH, insulin, albumin), glyco of hybrids between a probe polynucleotide and a target proteins (e.g. immunoglobulins, thrombomodulin, polynucleotide, wherein the probe polynucleotide preferen y-glutamyltranspeptidase; Goodspeed et al. (1989) Gene 76: tially hybridizes to the target DNA such that, for example, at 1), lipoproteins, viruses. microorganisms (e.g., pathogenic least one discrete band can be identified on a Southern blot bacteria. yeasts), polynucleotides (e.g., cellular genomic of DNA prepared from eukaryotic cells that contain the DNA, RNA in a fixed histological specimen for in situ target polynucleotide sequence, and/or a probe polynucle hybridization, DNA or RNA immobilized on a nylon or otide in an intact nucleus localizes to a discrete chromo nitrocellulose membrane, viral DNA or RNA in a tissue or somal location characteristic of a unique or repetitive biological fluid). and pharmaceuticals (i.e., prescribed or 25 Sequence. In some instances, a target sequence may be over-the-counter drugs listed in the Physicians Drug Refer present in more than one target polynucleotide species (e.g. ence and/or Merck Manual. or illegal substances such as a particular target sequence may occur in multiple members intoxicants or anabolic steroids). of a gene family or in a known repetitive sequence). It is As used herein. the term "antibody" refers to a protein evident that optimal hybridization conditions will vary consisting of one or more polypeptides substantially 30 depending upon the sequence composition and length(s) of encoded by immunoglobulin genes. The recognized immu the targeting polynucleotide(s) and target(s). and the experi noglobulin genes include the kappa, lambda. alpha, gamma mental method selected by the practitioner. Various guide (IgG, IgG, IgG, IgG), delta, epsilon and mu constant lines may be used to select appropriate hybridization con region genes. as well as the myriad immunoglobulin vari ditions (see, Maniatis et al. Molecular Cloning. A able region genes. Full-length immunoglobulin “light 35 Laboratory Manual (1989). 2nd Ed. Cold Spring Harbor. chains" (about 25 Kd or 214 amino acids) are encoded by a N.Y. and Berger and Kimmel. Methods in Enzymology, variable region gene at the NH2-terminus (about 110 amino Volume 152. Guide to Molecular Cloning Techniques acids) and a kappa or lambda constant region gene at the (1987), Academic Press. Inc.. San Diego, Calif. Dunn et al. COOH-terminus. Full-length immunoglobulin "heavy (1989) J. Biol. Chem. 264: 13057 and Goodspeed et al. chains" (about 50 Kod or 446 amino acids), are similarly (1989) Gene 76: 1.
encoded by a variable region gene (about 116 amino acids) As used herein, the term "label excitation wavelength" and one of the other aforementioned constant region genes. refers to an electromagnetic radiation wavelength that, when e.g., gamma (encoding about 330 amino acids). One form of absorbed by an up-converting label, produces a detectable immunoglobulin constitutes the basic structural unit of an antibody. This form is a tetramer and consists of two 45 fluorescent emission from the up-converting label, wherein identical pairs of immunoglobulin chains, each pair having higher frequencyemission the fluorescent is of a shorter wavelength (i.e., one light and one heavy chain. In each pair, the light and length. As used herein, thethat radiation) the label excitation wave heavy chain variable regions are together responsible for length" refers to a wavelength that"label term
emission wave emitted from an binding to an antigen, and the constant regions are respon up-converting label subsequent to, or contemporaneously sible for the antibody effector functions. In addition to 50 antibodies. immunoglobulins may exist in a variety of other with illumination of the up-converting label with one or more excitation wavelengths; label emission wavelengths of forms including, for example. Fv, Fab, and F(ab'), as well up-converting labels are shorter (i.e., higher frequency as bifunctional hybrid antibodies (e.g. Lanzavecchia et al. radiation) than the corresponding excitation wavelengths. Eur, J. Immunol. 17. 105 (1987)) and in single chains (e.g., Both label excitation wavelengths and label emission wave Huston et al., Proc. Natl. Acad. Sci. U.S.A., 85,5879-5883 55 lengths are characteristic to individual up-converting label (1988) and Bird et al., Science, 242. 423-426 (1988). (See, species, and are readily determined by performing simple generally. Hood et al., "Immunology". Benjamin. N.Y. 2nd excitation and emission scans. ed. (1984), and Hunkapiller and Hood, Nature, 323, 15-16 (1986)). Thus, not all immunoglobulins are antibodies. (See, Invention Overview U.S. Ser. No. 07/634.278, which is incorporated herein by reference, and Co. et al. (1991) Proc. Natl. Acad. Sci. The subject invention encompasses fluorescent labels that (U.S.A.) 88: 2869, which is incorporated herein by are excited by an excitation wavelength and subsequently reference). emit electromagnetic radiation at up-shifted frequencies As used herein, "probe polynucleotide" refers to a poly (i.e., at higher frequencies than the excitation radiation). nucleotide that specifically hybridizes to a predetermined 65 In accordance with the present invention, labels compris target polynucleotide. For example but not limitation, a ing up-converting inorganic phosphors and/or up-converting probe polynucleotide may be a portion of a cDNA corre organic dyes are provided for various applications. The
Page 44
up-converting labels of the invention may be attached to one invention. Such conversion efficiency data may be obtained or more probe(s) to serve as a reporter (i.e., a detectable from available sources (e.g., handbooks and published marker) of the location of the probe(s). The up-converting references) or may be obtained by generating a standard labels can be attached to various probes, such as antibodies. ization curve measuring quantum conversion efficiency as a streptavidin, protein. A polypeptide ligands of cellular function of particle size. In some applications, such as those receptors, polynucleotide probes, drugs, antigens, toxins, requiring highly sensitive detection of small phosphor and others. Attachment of the up-converting label to the particles, infrared laser diodes are preferably selected as an probe can be accomplished using various linkage excitation source.
chemistries, depending upon the nature of the specific probe. Although the properties of the up-converting phosphors For example but not limitation, microcrystalline O will be described in detail in a later section, it is useful to up-converting lanthanide phosphor particles may be coated outline the basic mechanisms involved. Up-conversion has with a polycarboxylic acid (e.g., Addition XW 330. Hoechst, been found to occur in certain materials containing rare Frankfurt, Germany) during milling and various proteins earth ions in certain crystal materials. For example, ytter (e.g. immunoglobulin. streptavidin or protein A) can be bium and erbium act as an activator couple in a phosphor host material such as barium-yttrium-fluoride. The ytter physically adsorbed to the surface of the phosphor particle 15 bium ions act as the absorber, and transfer energy non (Beverloo et al. (1991) op.cit., which is incorporated herein radiatively by reference). Alternatively, various inorganic phosphor characteristicto of excite the erbium ions. The emission is thus the erbium ion's energy levels.
coating techniques can be employed including, but not limited to: spray drying, plasma deposition, and derivatiza Up-Converting Microcrystalline Phosphors tion with functional groups (e.g., -COOH, -NH2. Although the invention can be practiced with a variety of -CONH2) attached by a silane coupling agent to -SiOH up-converting inorganic phosphors, it is believed that the moieties coated on the phosphor particle or incorporated into preferred embodiment(s) employ one or more phosphors a vitroceramic phosphor particle comprising silicon oxide(s) derived from one of several different phosphor host and up-converting phosphor compositions. Vitroceramic materials, each doped with at least one activator couple. phosphor particles can be aminated with, for example. 25 Suitable phosphor host materials include: sodium yttrium aminopropyltriethoxysilane for the purpose of attaching fluoride (NaYF), lanthanum fluoride (LaF), lanthanum amino groups to the vitroceramic surface on linker oxysulfide, yttrium oxysulfide, yttrium fluoride (YF). molecules, however other omega-functionalized silanes can yttrium gallate, yttrium aluminum garnet, gadolinium fluo be substituted to attach alternative functional groups. ride (GdF). barium yttrium fluoride (BaYF BaYF), and Probes, such as proteins or polynucleotides may then be gadolinium oxysulfide. Suitable activator couples are directly attached to the vitroceramic phosphor by covalent selected from: ytterbium/erbium, ytterbium/thulium. and linkage. for example through siloxane bonds or through ytterbium/holmium. Other activator couples suitable for carbon-carbon bonds to linker molecules (e.g. organofunc up-conversion may also be used. By combination of these tional silylating agents) that are covalently bonded to or host materials with the activator couples, at least three adsorbed to the surface of a phosphor particle. Covalent 35 phosphors with at least three different emission spectra (red, conjugation between the up-converting inorganic phosphor green. and blue visible light) are provided. Generally, the particles and proteins (e.g. avidin. immunoglobulin) can be absorber is ytterbium and the emitting center can be selected accomplished with heterobifunctional crosslinkers. For from: erbium, holmium, terbium, and thulium; however. example. surface slianization of the phosphors with tri other up-converting phosphors of the invention may contain (ethoxy)thiopropyl silane leaves a phosphor surface with a 40 other absorbers and/or emitters. The molar ratio of absorber: thiol functionality to which a protein (e.g., antibody) or any emitting center is typically at least about 1:1 more usually compound containing a primary amine can be grafted using at least about 3:1 to 5:1, preferably at least about 8:1 to 10:1. conventional N-succinimidyl(4-iodoacetyl)amino-benzoate more preferably at least about 11:1 to 20:1. and typically less (SIAB) chemistry (Weltman et al. (1983). Other silanization than about 250:1 usually less than about 100:1, and more and cross-linking methods compatible with the inorganic 45 usually less than about 50:1 to 25:1, although various ratios phosphors may be used at the discretion of the practitioner. may be selected by the practitioner on the basis of desired Microcrystalline up-converting phosphor particles are characteristics (e.g., chemical properties, manufacturing typically smaller than about 3 microns in diameter. prefer efficiency. absorption cross-section, excitation and emission ably less than about 1 micron in diameter (i.e. submicron). wavelengths, quantum efficiency, or other considerations). and more preferably are 0.1 to 0.3 microns or less in 50 The ratio(s) chosen will generally also depend upon the diameter. It is generally most preferred that the phosphor particular absorber-emitter couple(s) selected, and can be particles are as small as possible while retaining sufficient calculated from reference values in accordance with the quantum conversion efficiency to produce a detectable sig desired characteristics.
nal; however, for any particular application, the size of the The optimum ratio of absorber (e.g., ytterbium) to the phosphor particle(s) to be used should be selected at the 55 emitting center (e.g., erbium, thulium, or holmium) varies, discretion of the practitioner. For instance, some applica depending upon the specific absorber/emitter couple. For tions (e.g. detection of a non-abundant cell surface antigen) example, the absorber:emitter ratio for Yb:Er couples is may require a highly sensitive phosphor label that need not typically in the range of about 20:1 to about 100:1, whereas be small but must have high conversion efficiency and/or the absorber:emitter ratio for Yb:Tm and Yb:Ho couples is absorption cross-section. while other applications (e.g. typically in the range of about 500:1 to about 2000:1. These detection of an abundant nuclear antigen in a permeablized different ratios are attributable to the different matching cell) may require a very small phosphor particle that can energy levels of the Er, Tm, or Ho with respect to the Yb readily diffuse and penetrate subcellular structures, but level in the crystal. For most applications, up-converting which need not have high conversion efficiency. Therefore, phosphors may conveniently comprise about 10-30% Yb the optimal size of inorganic phosphor particle is application 65 and either: about 1-2%. Er, about 0.1-0.05% Ho, or about dependent and is selected by the practitioner on the basis of 0.1-0.05% Tm, although other formulations may be quantum efficiency data for the various phosphors of the employed.
Page 45
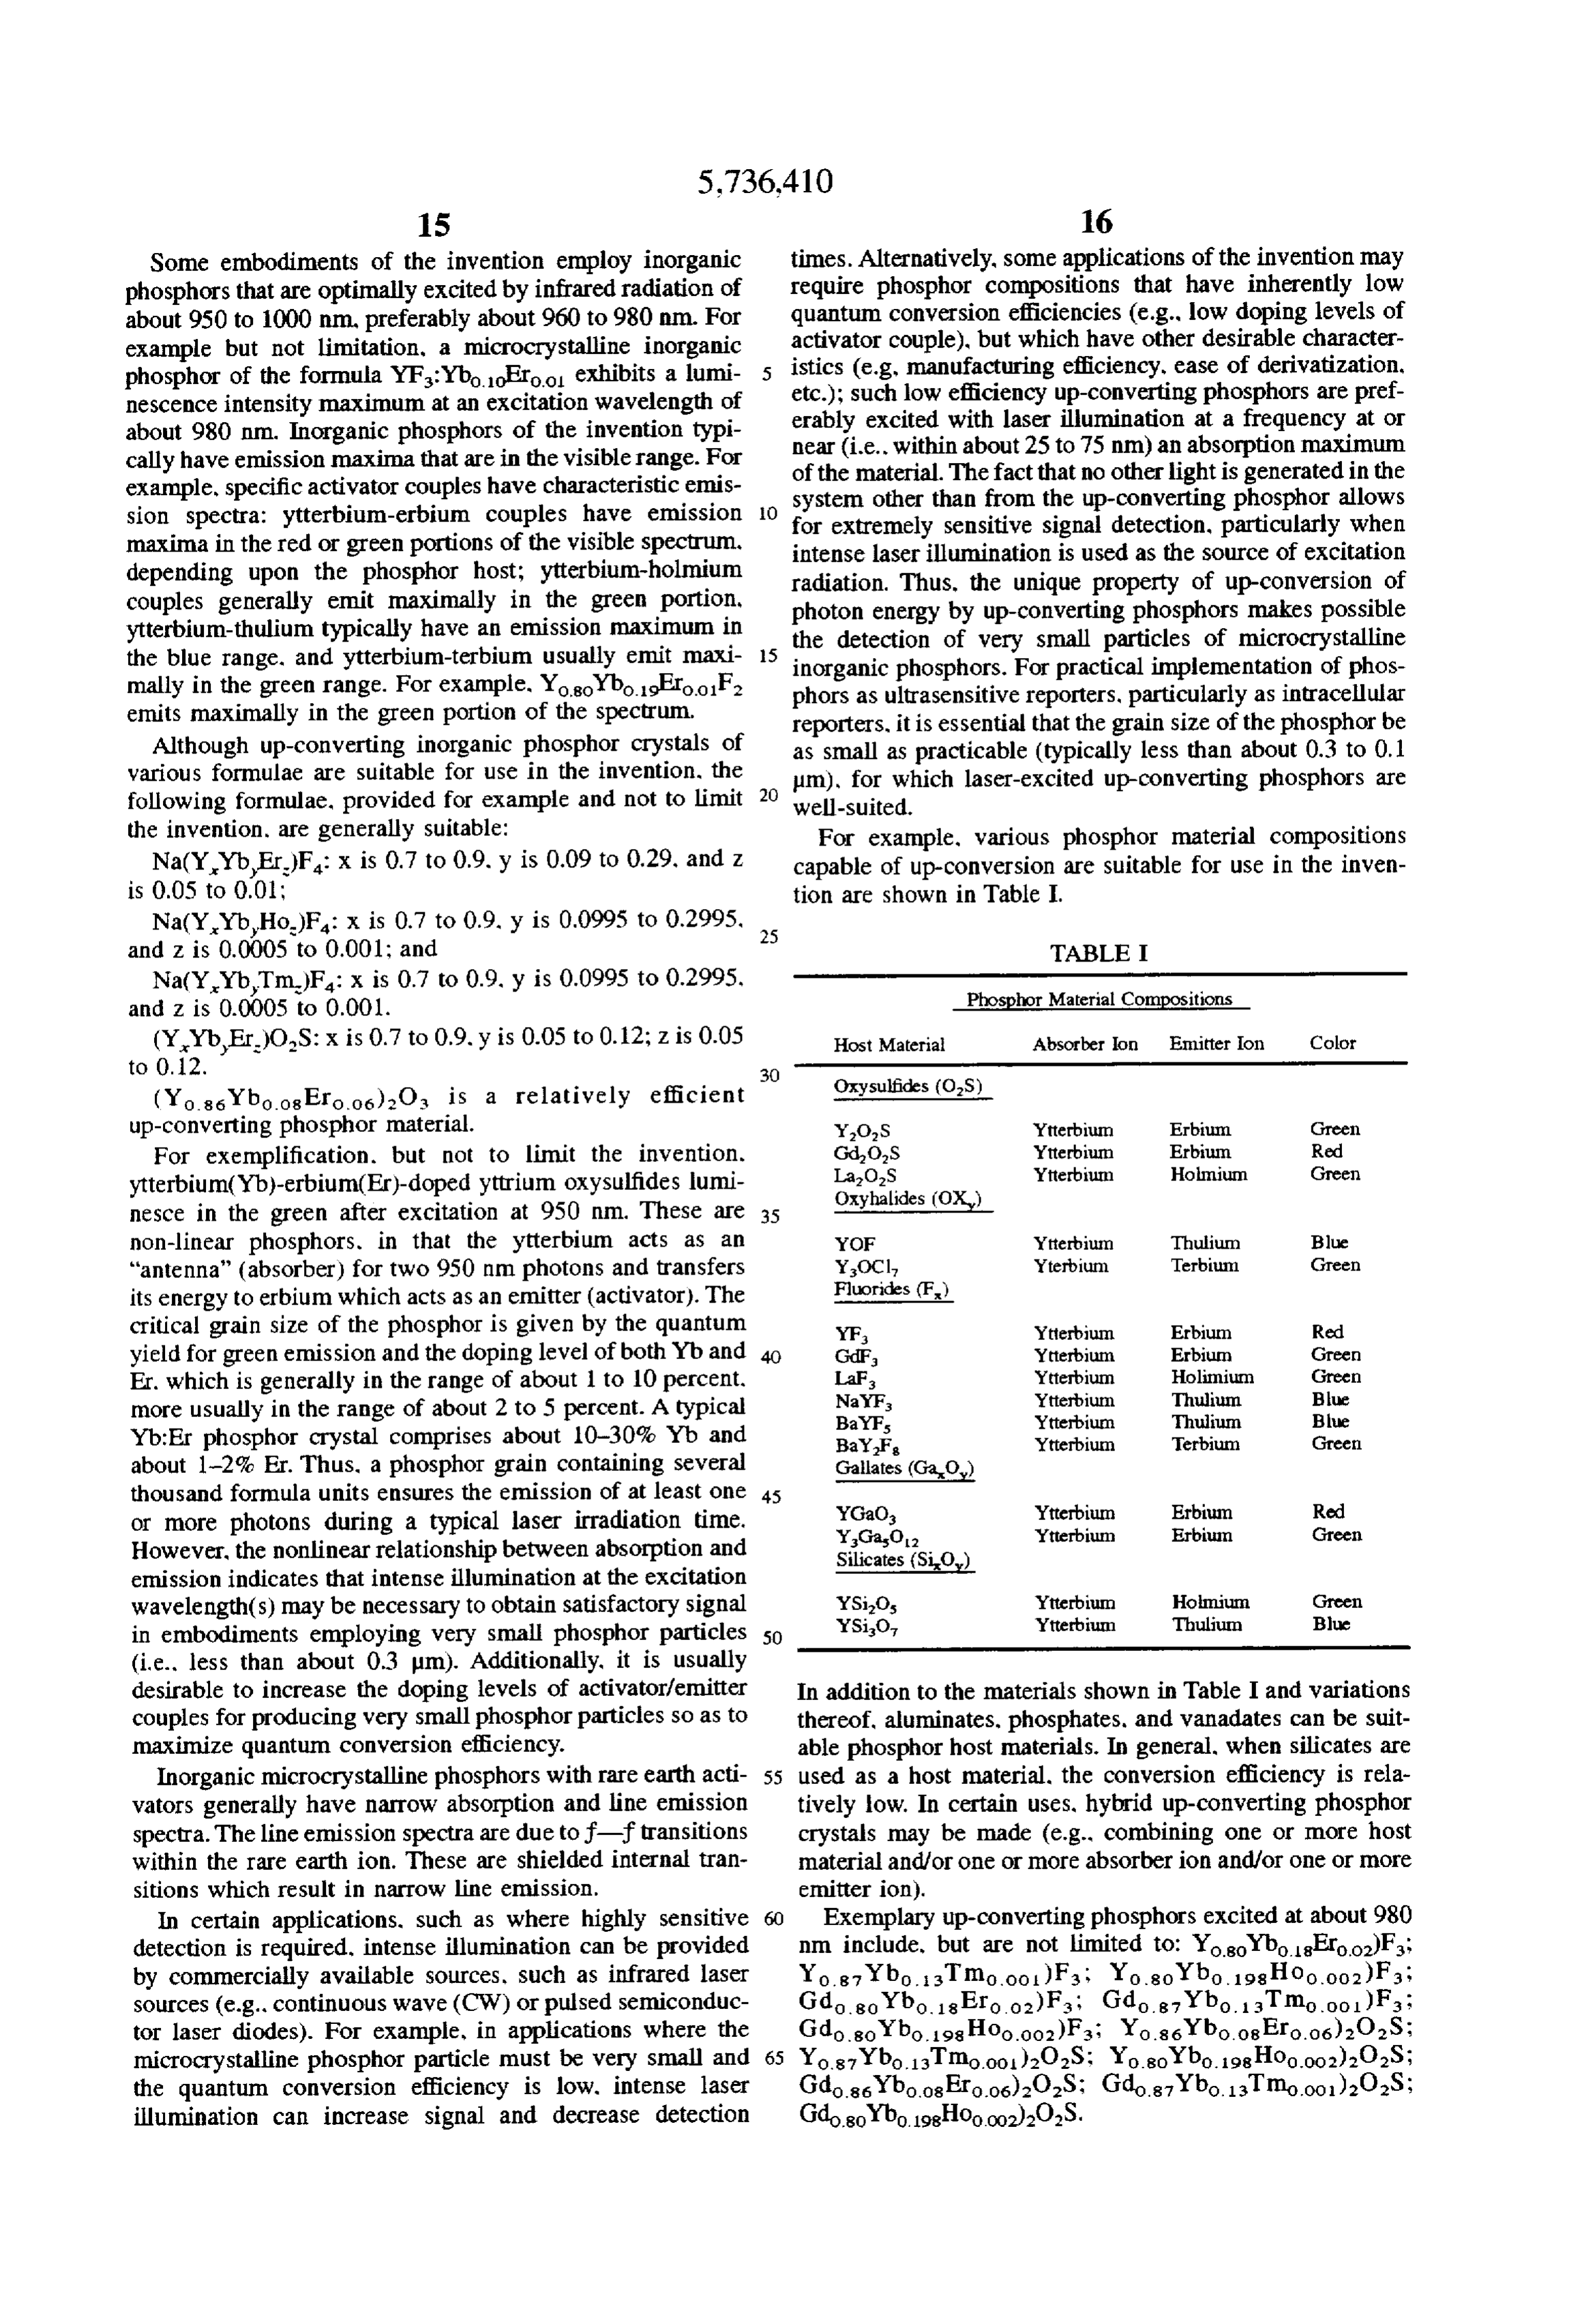
Some embodiments of the invention employ inorganic times. Alternatively, some applications of the invention may phosphors that are optimally excited by infrared radiation of require phosphor compositions that have inherently low about 950 to 1000 nm, preferably about 960 to 980 nm. For quantum conversion efficiencies (e.g., low doping levels of example but not limitation, a microcrystalline inorganic activator couple), but which have other desirable character phosphor of the formula YF:Ybo. Eroo exhibits a lumi istics (e.g., manufacturing efficiency, ease of derivatization, nescence intensity maximum at an excitation wavelength of etc.); such low efficiency up-converting phosphors are pref about 980 nm. Inorganic phosphors of the invention typi erably near excited with laser illumination at a frequency at or (i.e. within about 25 to 75 nm) an absorption maximum cally have emission maxima that are in the visible range. For of the material. The fact that no other light is generated in the example, specific activator couples have characteristic emis system other than from the up-converting phosphor allows sion spectra: ytterbium-erbium couples have emission for extremely sensitive
maxima in the red or green portions of the visible spectrum, intense laser illuminationsignal detection, particularly when is used as the source of excitation depending upon the phosphor host; ytterbium-holmium couples generally emit maximally in the green portion, radiation. Thus, the unique property of up-conversion of photon energy by up-converting phosphors makes possible ytterbium-thulium typically have an emission maximum in the detection of very small particles of microcrystalline the blue range. and ytterbium-terbium usually emit maxi 15 inorganic phosphors. For practical implementation of phos mally in the green range. For example, YosoYbo. Eroo F. phors as ultrasensitive reporters, particularly as intracellular emits maximally in the green portion of the spectrum. reporters, it is essential that the grain size of the phosphor be Although up-converting inorganic phosphor crystals of as small as practicable (typically less than about 0.3 to 0.1 various formulae are suitable for use in the invention, the um), for which laser-excited up-converting phosphors are following formulae, provided for example and not to limit 20 well-suited.
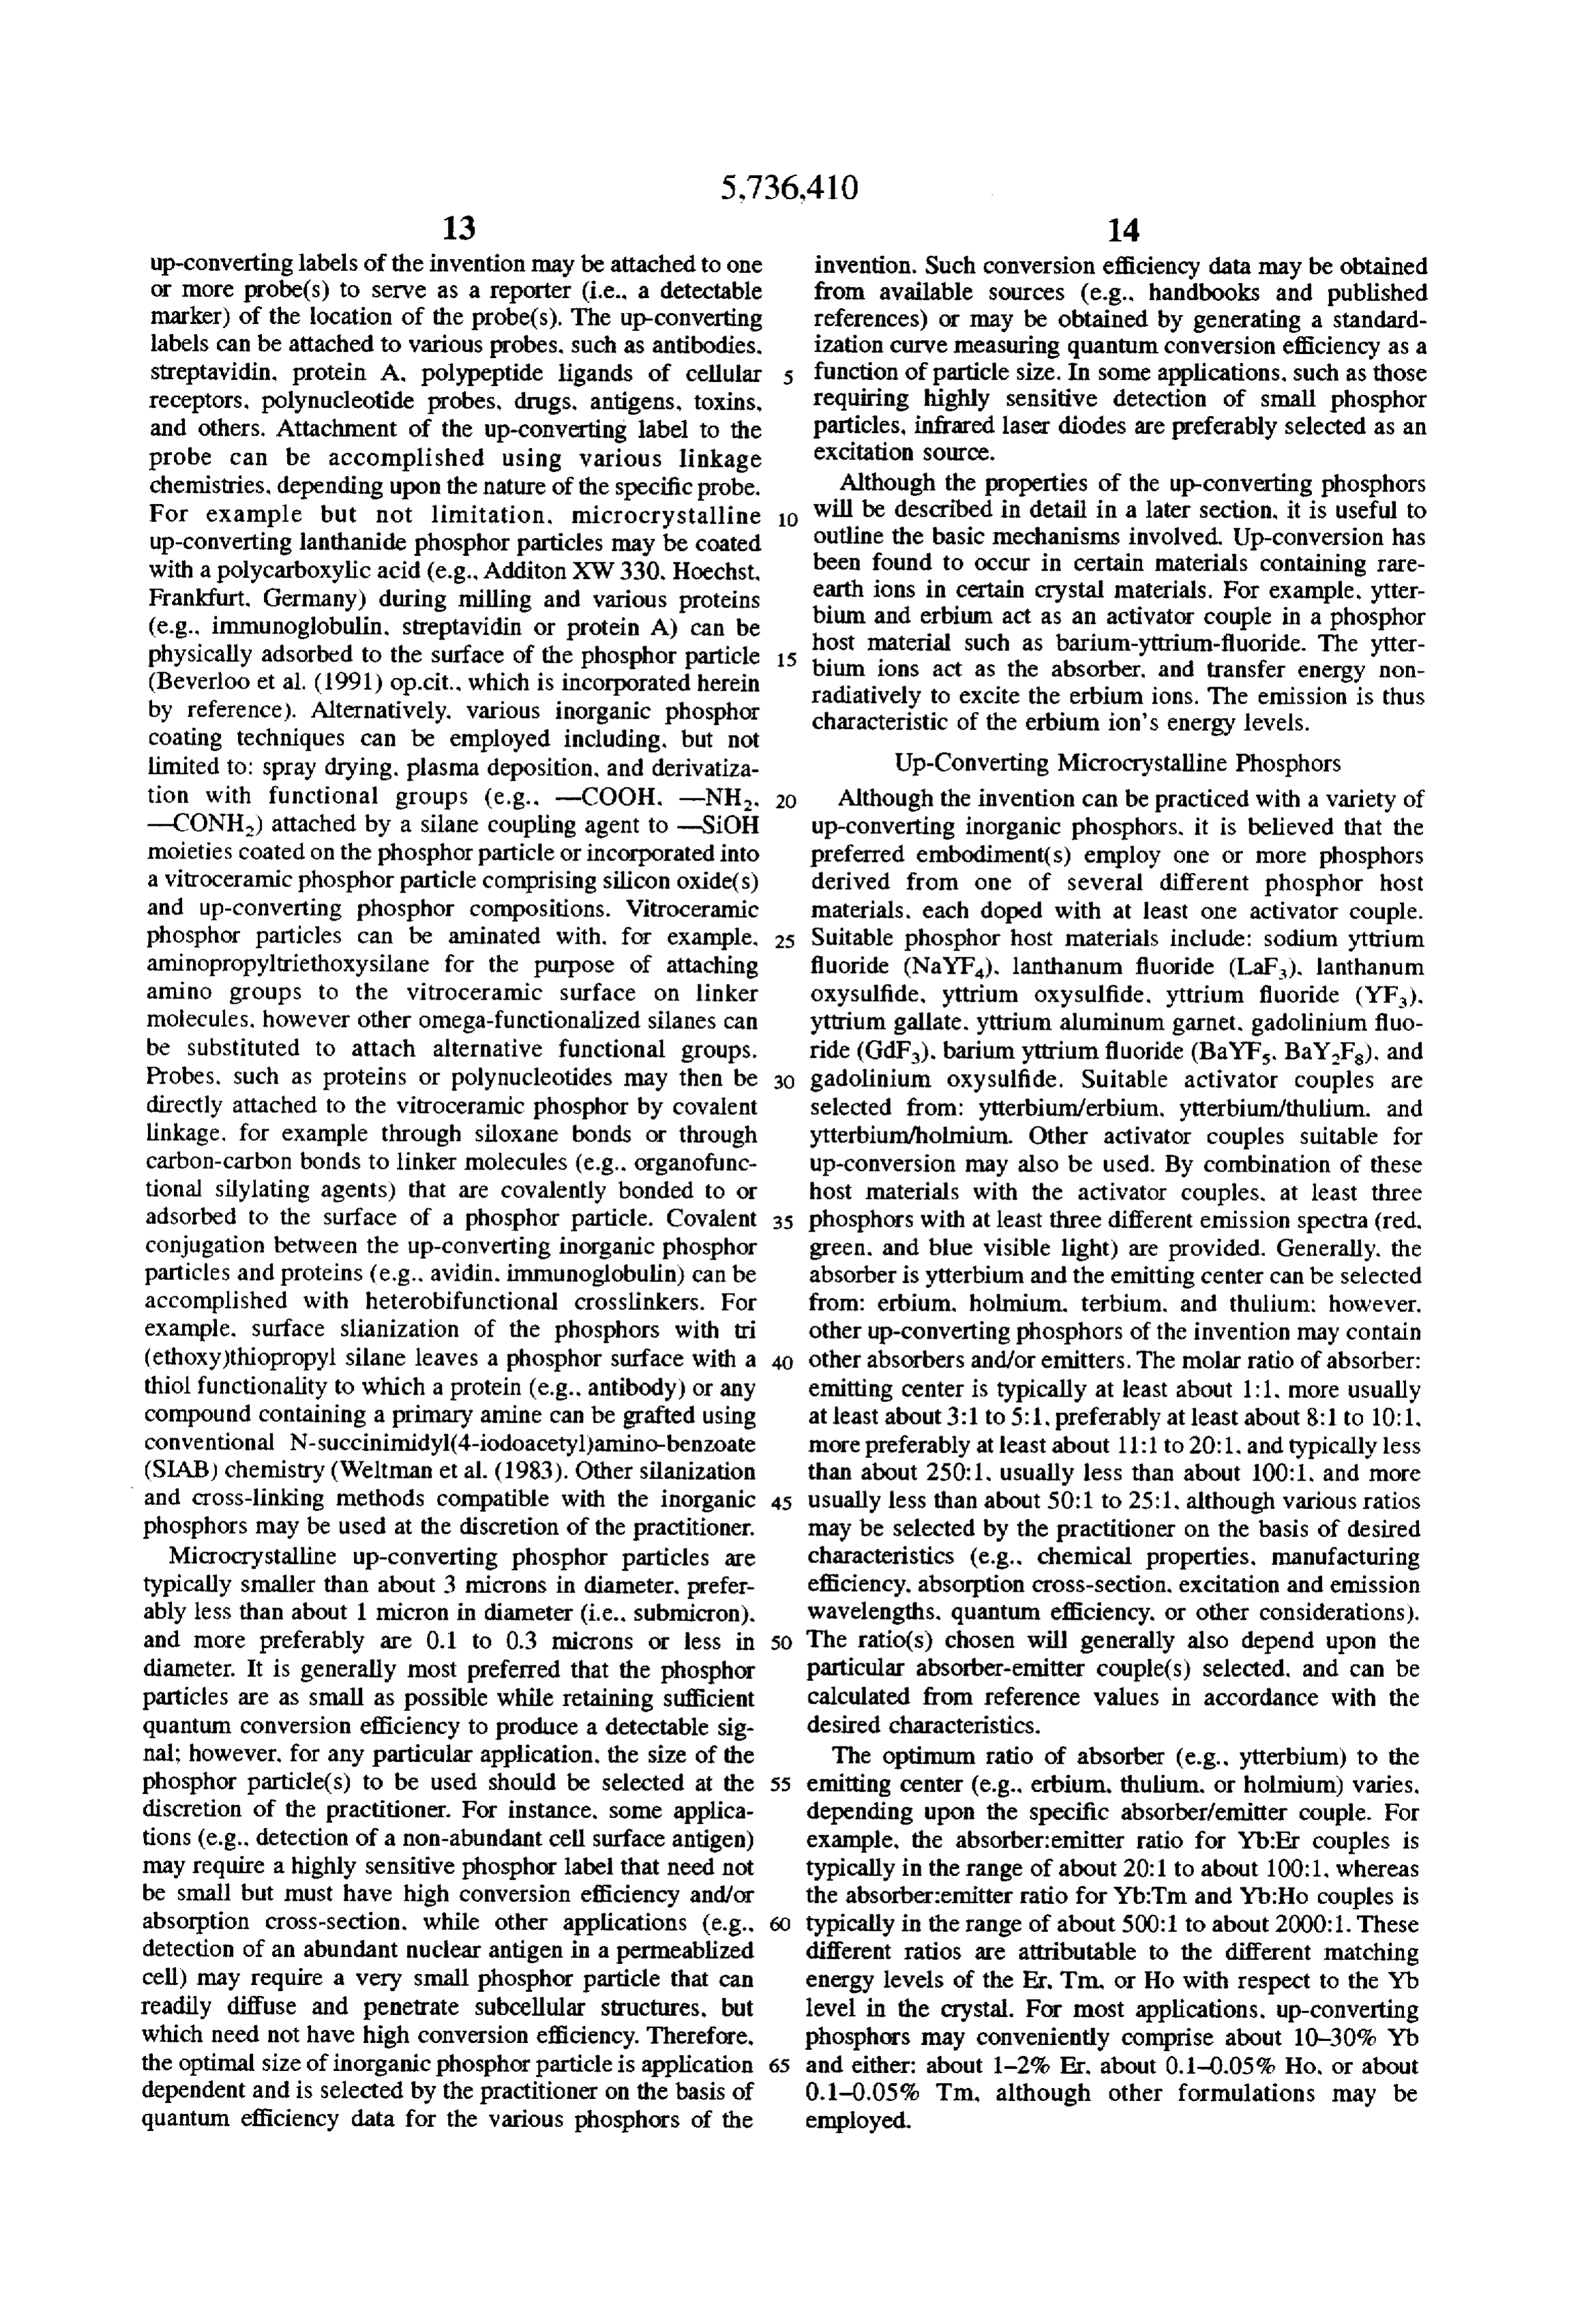
the invention. are generally suitable: For example, various phosphor material compositions Na(Y.Yb.Er.)F: x is 0.7 to 0.9. y is 0.09 to 0.29, and Z capable of up-conversion are suitable for use in the inven is 0.05 to 0.01; tion are shown in Table I.
and Z is 0.0005 to 0.001; and TABLE Na(YYb,Tm)F: x is 0.7 to 0.9, y is 0.0995 to 0.2995. Phosphor Material Compositions
(YYb.Er.).O.S: x is 0.7 to 09, y is 0.05 to 0.12; z is 0.05 Host Material Absorber on Emitter on Color
Oxysulfides (OS)
(Yoss Yboos Eroos)2O is a relatively efficient up-converting phosphor material. YOS Ytterbiun Erbium Green For exemplification. but not to limit the invention. GdOS
Ytterbiun
Ytterbium
Erbium
Holmium
Red
Green ytterbium(Yb)-erbium(Er)-doped yttrium oxysulfides lumi Oxyhalides (OX) nesce in the green after excitation at 950 nm. These are 35 non-linear phosphors, in that the ytterbium acts as an YOF Ytterbium Thulium Blue "antenna" (absorber) for two 950 nm photons and transfers YOCl, Yterbium Terbium Green its energy to erbium which acts as an emitter (activator). The Fluorides (F) critical grain size of the phosphor is given by the quantum YF, Ytterbium Erbium Red yield for green emission and the doping level of both Yb and GdF, Ytterbium Erbium Green Er. which is generally in the range of about 1 to 10 percent. LaF
NaYF,
Ytterbium
Ytterbiun
Holimium
Thulium
Green
Blue more usually in the range of about 2 to 5 percent. A typical BaYF. Ytterbium Thulium Blue Yb:Er phosphor crystal comprises about 10-30% Yb and BaYF Ytterbium Terbium Green about 1-2% Er. Thus, a phosphor grain containing several Gallates (Gao) thousand formula units ensures the emission of at least one 45 or more photons during a typical laser irradiation time. YGaO. Ytterbium Erbium Red
However, the nonlinear relationship between absorption and Silicates (SiO,) emission indicates that intense illumination at the excitation wavelength(s) may be necessary to obtain satisfactory signal YSiO. Ytterbium Holnium Green in embodiments employing very small phosphor particles 50 YSiO, Ytterbium Thulium Blue (i.e., less than about 0.3 um). Additionally, it is usually desirable to increase the doping levels of activator/emitter In addition to the materials shown in Table I and variations couples for producing very small phosphor particles so as to thereof, aluminates, phosphates, and vanadates can be suit maximize quantum conversion efficiency. able phosphor host materials. In general, when silicates are Inorganic microcrystalline phosphors with rare earth acti 55 used as a host material, the conversion efficiency is rela vators generally have narrow absorption and line emission tively low. In certain uses, hybrid up-converting phosphor spectra. The line emission spectra are due to f-f transitions crystals may be made (e.g., combining one or more host within the rare earth ion. These are shielded internal tran material and/or one or more absorber ion and/or one or more sitions which result in narrow line emission. emitter ion).
In certain applications, such as where highly sensitive Exemplary up-converting phosphors excited at about 980 detection is required. intense illumination can be provided nm include, but are not limited to: Yoo Ybo Eroo)F; by commercially available sources, such as infrared laser Yo. 87 Ybo. 13T mooo.) F3; Yo so Ybo.19s. Hoooo.2) F3; sources (e.g. continuous wave (CW) or pulsed semiconduc Gido, so Ybo.1s Eroo2)Fa; Gido. 87Ybo. 13T mooo..)F3: tor laser diodes). For example, in applications where the Gido, so Ybo.19s Hoo.o.o.2)Fa; Yoss Yboos Eroos)2O2S: microcrystalline phosphor particle must be very small and 65 Yos7Ybo.13Tmolool)2O2S: Yo soYbo.19s Hoooo.2)2O2S: the quantum conversion efficiency is low, intense laser Gdoss Yboos Eroos)2O2S: Gido. 87Ybo. 13Tmolool)2O2S: illumination can increase signal and decrease detection Gdo so Ybo 198Hooooz).O.S.
Page 46
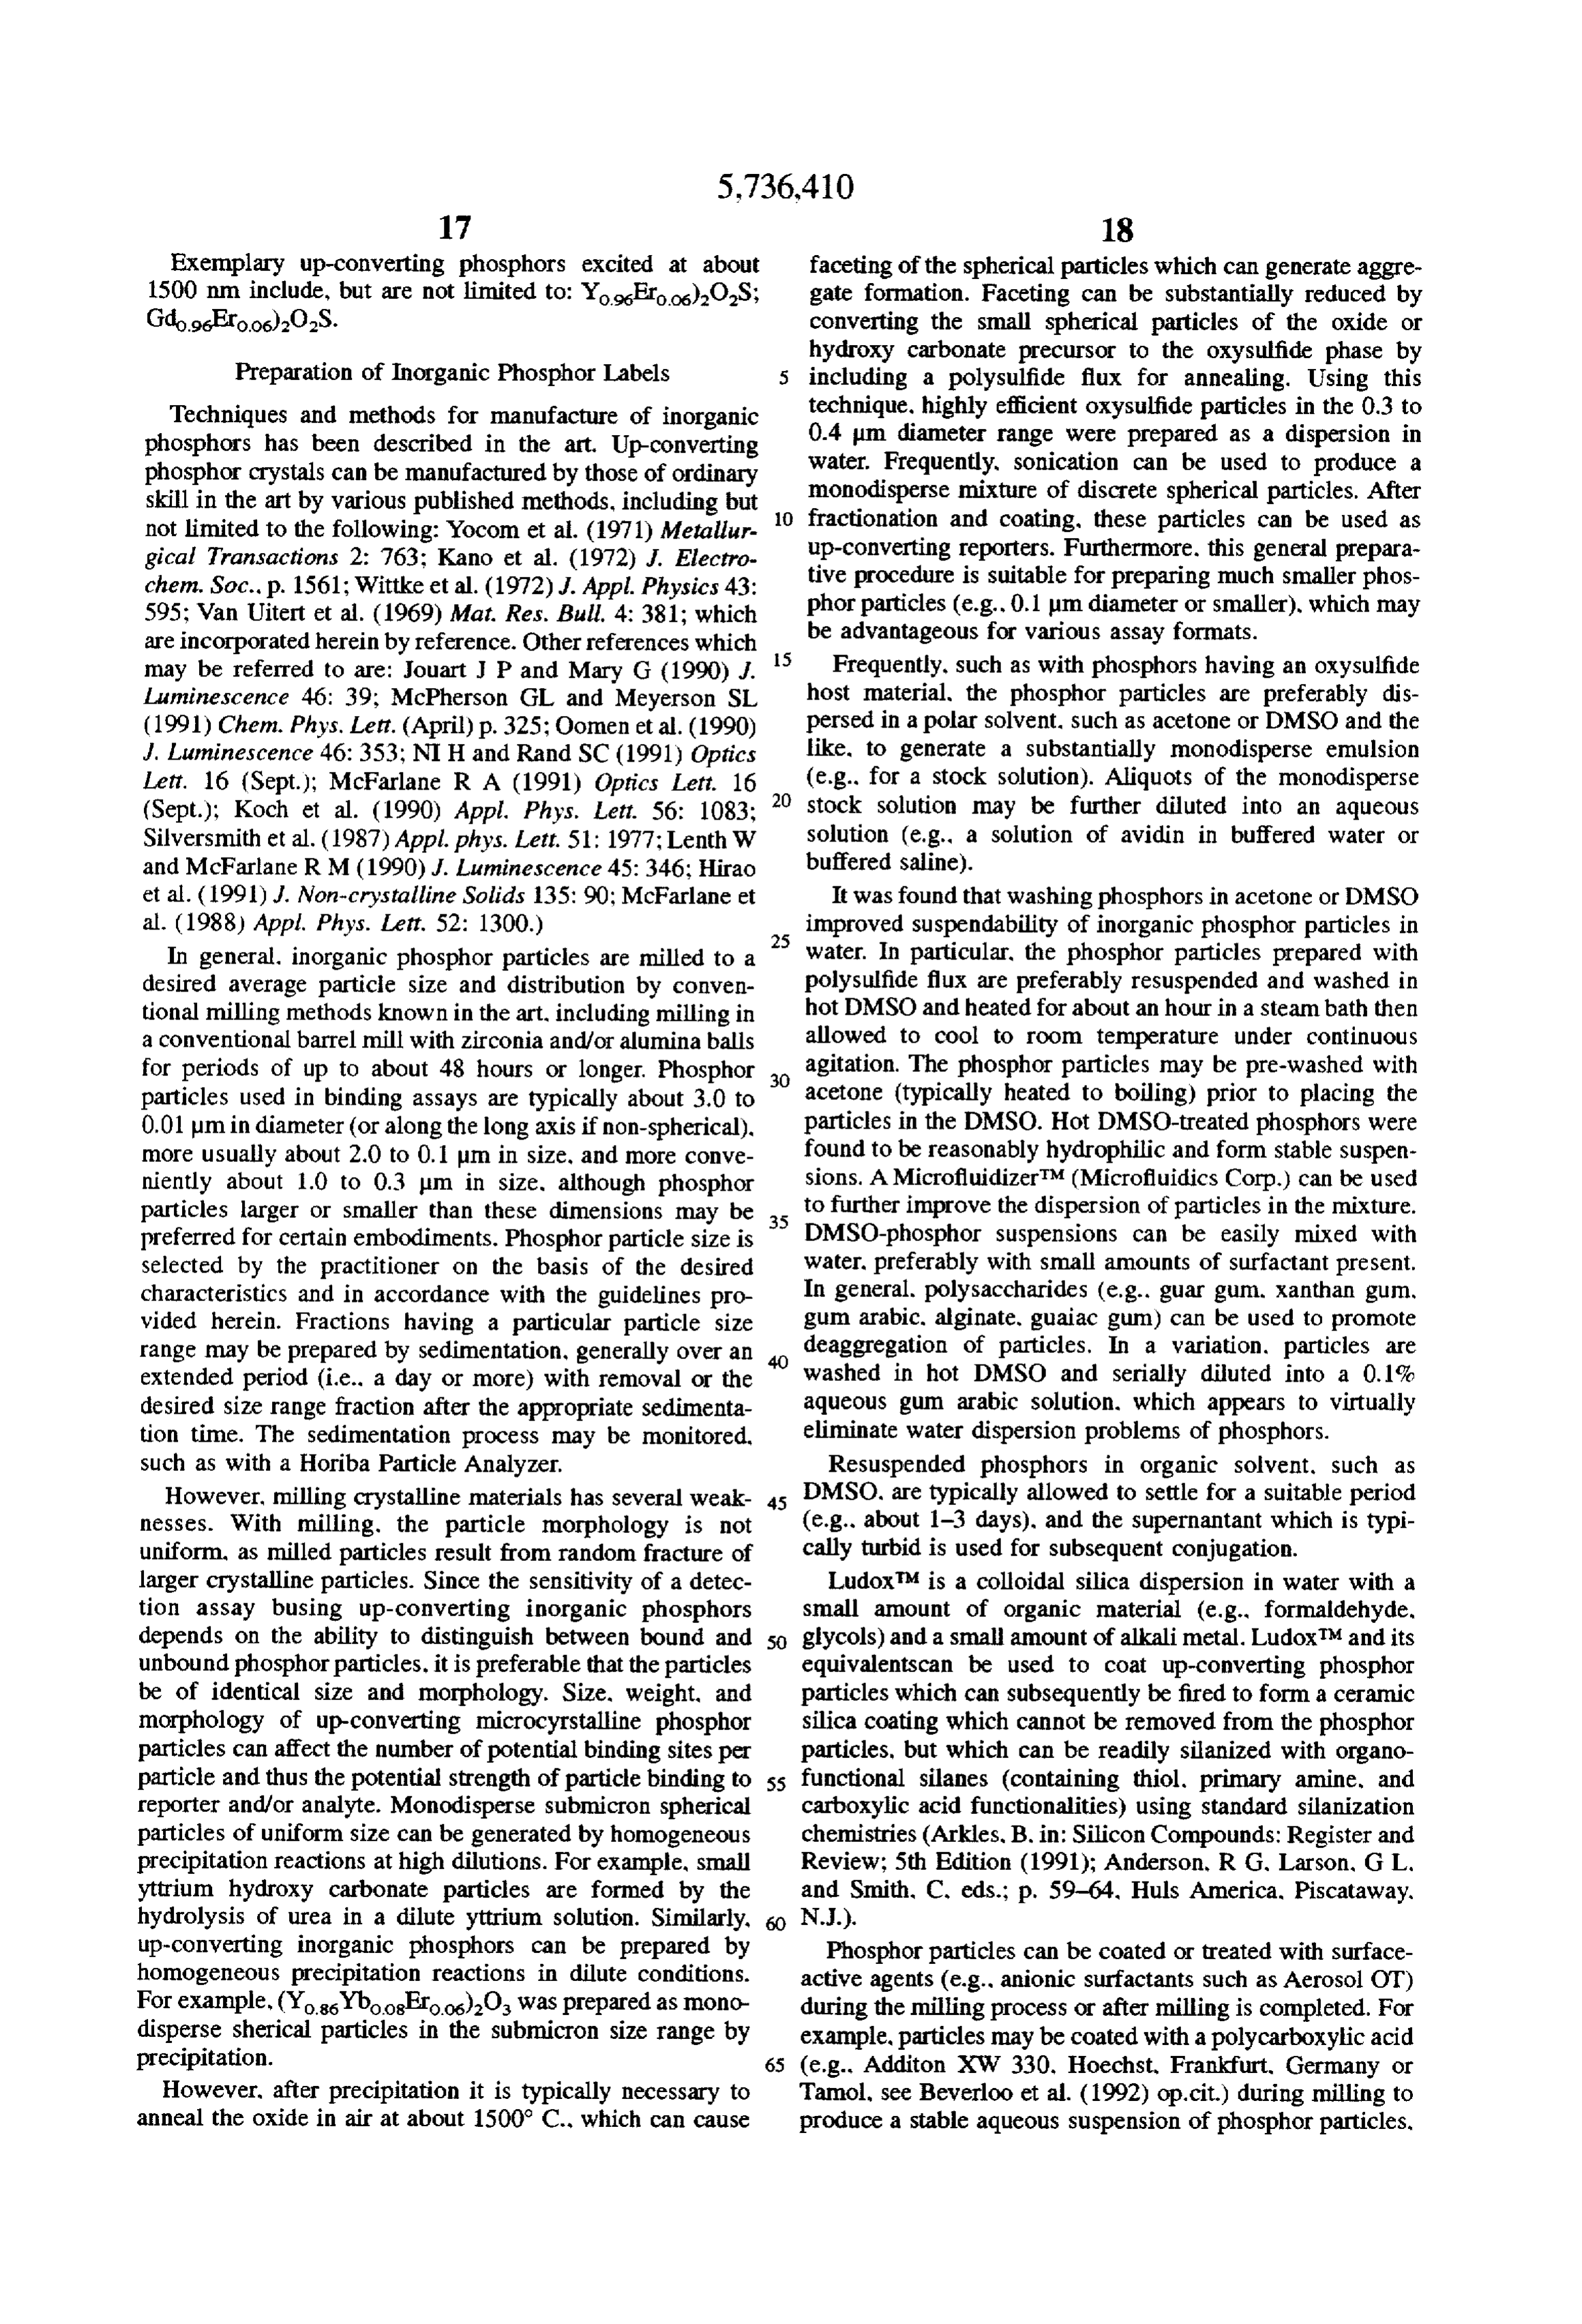
Exemplary up-converting phosphors excited at about faceting of the spherical particles which can generate aggre 1500 nm include, but are not limited to: YoEroo).OS; gate formation. Faceting can be substantially reduced by GdogsBroos).O.S. converting the small spherical particles of the oxide or hydroxy carbonate precursor to the oxysulfide phase by
Preparation of Inorganic Phosphor Labels including a polysulfide flux for annealing. Using this Techniques and methods for manufacture of inorganic technique, highly efficient oxysulfide particles in the 0.3 to phosphors has been described in the art. Up-converting 0.4 um diameter range were prepared as a dispersion in phosphor crystals can be manufactured by those of ordinary water. Frequently, sonication can be used to produce a skill in the art by various published methods, including but monodisperseand mixture of discrete spherical particles. After not limited to the following: Yocom et al. (1971) Metalur O fractionation coating, these particles can be used as gical Transactions 2: 763: Kano et al. (1972) J. Electro tive procedure is suitableFurthermore... up-converting reporters. this general prepara for preparing much smaller phos chem. Soc.. p. 1561; Wittke et al. (1972) J. Appl. Physics 43: phor particles (e.g., 0.1 um diameter or smaller), which may 595: Van Uitert et al. (1969) Mat. Res. Bull. 4: 381; which be advantageous for various assay formats. are incorporated herein by reference. Other references which 5 may be referred to are: Jouart J P and Mary G (1990) J. Frequently, such as with phosphors having an oxysulfide Luminescence 46: 39; McPherson GL and Meyerson SL host material, the phosphor particles are preferably dis (1991) Chem. Phys. Lett. (April) p. 325: Oomen et al. (1990) persed in a polar solvent, such as acetone or DMSO and the J. Luminescence 46:353; NIH and Rand SC (1991) Optics like, to generate a substantially monodisperse emulsion Lett. 16 (Sept.); McFarlane R A (1991) Optics Lett. 16 (e.g. for a stock solution). Aliquots of the monodisperse (Sept.); Koch et al. (1990) Appl. Phys. Lett. 56: 1083: 20 Stock solution may be further diluted into an aqueous Silversmith et al. (1987) Appl. phys. Lett. 51: 1977; Lenth W solution (e.g. a solution of avidin in buffered water or and McFarlane RM (1990) J. Luminescence 45: 346; Hirao buffered saline).
et al. (1991) J. Non-crystalline Solids 135:90; McFarlane et It was found that washing phosphors in acetone or DMSO al. (1988) Appl. Phys. Lett. 52: 1300.) 25 improved suspendability of inorganic phosphor particles in
In general. inorganic phosphor particles are milled to a water. In particular, the phosphor particles prepared with desired average particle size and distribution by conven polysulfide flux are preferably resuspended and washed in tional milling methods known in the art, including milling in hot DMSO and heated for about an hour in a steam bath then a conventional barrel mill with zirconia and/or alumina balls allowed to cool to room temperature under continuous for periods of up to about 48 hours or longer. Phosphor 30 agitation. The phosphor particles may be pre-washed with particles used in binding assays are typically about 3.0 to acetone (typically heated to boiling) prior to placing the 0.01 um in diameter (or along the long axis if non-spherical). particles in the DMSO. Hot DMSO-treated phosphors were more usually about 2.0 to 0.1 un in size, and more conve found to be reasonably hydrophilic and form stable suspen niently about 1.0 to 0.3 m in size, although phosphor sions. A MicrofluidizerTM (Microfluidics Corp.) can be used particles larger or smaller than these dimensions may be 35 to further improve the dispersion of particles in the mixture. preferred for certain embodiments. Phosphor particle size is DMSO-phosphor suspensions can be easily mixed with Selected by the practitioner on the basis of the desired water, preferably with small amounts of surfactant present. characteristics and in accordance with the guidelines pro In general polysaccharides (e.g. guar gum. xanthan gum, vided herein. Fractions having a particular particle size gum arabic, alginate, guaiac gum) can be used to promote range may be prepared by sedimentation, generally over an deaggregation of particles. In a variation, particles are extended period (i.e. a day or more) with removal or the washed in hot DMSO and serially diluted into a 0.1% desired size range fraction after the appropriate sedimenta aqueous gum arabic solution. which appears to virtually tion time. The sedimentation process may be monitored. eliminate water dispersion problems of phosphors. such as with a Horiba Particle Analyzer. Resuspended phosphors in organic solvent, such as However, milling crystalline materials has several weak 45 DMSO, are typically allowed to settle for a suitable period nesses. With milling, the particle morphology is not (e.g., about 1-3 days), and the supernantant which is typi uniform, as milled particles result from random fracture of cally turbid is used for subsequent conjugation. larger crystalline particles. Since the sensitivity of a detec Ludox M is a colloidal silica dispersion in water with a tion assay busing up-converting inorganic phosphors Small amount of organic material (e.g., formaldehyde, depends on the ability to distinguish between bound and 50 glycols) and a small amount of alkali metal. LudoxTM and its unbound phosphorparticles. it is preferable that the particles equivalentscan be used to coat up-converting phosphor be of identical size and morphology. Size, weight, and particles which can subsequently be fired to form a ceramic morphology of up-converting microcyrstalline phosphor silica coating which cannot be removed from the phosphor particles can affect the number of potential binding sites per particles, but which can be readily silanized with organo particle and thus the potential strength of particle binding to functional silanes (containing thiol. primary amine, and reporter and/or analyte. Monodisperse submicron spherical carboxylic acid functionalities) using standard silanization particles of uniform size can be generated by homogeneous chemistries (Arkles, B. in: Silicon Compounds: Register and precipitation reactions at high dilutions. For example, small Review; 5th Edition (1991); Anderson, R. G. Larson, G. L. yttrium hydroxy carbonate particles are formed by the and Smith, C. eds.; p. 59-64, Huls America, Piscataway, hydrolysis of urea in a dilute yttrium solution. Similarly, N.J.).
up-converting inorganic phosphors can be prepared by Phosphor particles can be coated or treated with surface homogeneous precipitation reactions in dilute conditions. active agents (e.g., anionic surfactants such as Aerosol OT) For example, (Yoss Ybooroos).O. was prepared as mono during the milling process or after milling is completed. For disperse sherical particles in the submicron size range by example, particles may be coated with a polycarboxylic acid precipitation. 65 (e.g. Addition XW 330. Hoechst, Frankfurt, Germany or However, after precipitation it is typically necessary to Tamol, see Beverloo et al. (1992) op.cit.) during milling to anneal the oxide in air at about 1500° C., which can cause produce a stable aqueous suspension of phosphor particles,
Page 47
typically at about pH 6-8. The pH of an aqueous solution of binding reagents, either directly or indirectly, for use in phosphor particles can be adjusted by addition of a suitable binding assays to detect and quantitate the presence of buffer and titration with acid or base to the desired pH range, analyte(s) in a sample. Binding reagents are labeled directly Depending upon the chemical nature of the coating, some by attachment to up-converting reporters (e.g., surface minor loss in conversion efficiency of the phosphor may adsorption, covalent linkage). Binding reagents which can occur as a result of coating, however the power available in be directly labeled include, but are not limited to: primary a laser excitation source can compensate for such reduction antibodies (i.e., which bind to a target analyte), secondary in conversion efficiency and ensure adequate phosphor emis antibodies (i.e., which bind to a primary antibody or pros SO. thetic group, such as biotin or digoxygenin). Staphlococcus In general, preparation of inorganic phosphor particles aureus Protein A. polynucleotides, streptavidin. and receptor and linkage to binding reagents is performed essentially as ligands. Binding reagents can also be indirectly labeled; described in Beverloo et al. (1992) op.cit., and Tanke U.S. thus. a primary antibody (e.g., a rabbit anti-erb-B antibody) Pat. No. 5,043.265. Alternatively, a water-insoluble poly can be indirectly labeled by noncovalent binding to a functional polymer which exhibits glass and melt transition directly labeled second antibody (e.g., a goat anti-rabbit temperatures well above room temperature can be used to 15 antibody linked to an up-converting inorganic phosphor). coat the up-converting phosphors in a nonaqueous medium. Quantitative detection of the analyte-probe complex may be For example, such polymer functionalities include: carboxy lic acids (e.g. 5% aminoethyl acrylate/95% methyl acrylate conducted in conjunction with proper calibration of the copolymer), reducible sulfonates (e.g. 5% sulfonated assay for each probe employed. A probe is conveniently polystyrene), and aldehydes (e.g. polysaccharide detected under saturating excitation conditions using for copolymers). the phosphor particles are coated with water example. a laser source or focused photodiode source for insoluble polyfunctional polymers by coacervative encap 20 excitation illumination.
sulation in nonaqueous media, washed, and transferred to a Specific binding assays are commonly divided into homo suitable aqueous buffer solution to conduct the heterobifunc geneous and heterogeneous assays. In a homogeneous assay, tional crosslinking to a protein (e.g. antibody) or polynucle the signal emitted by the bound labeled probe is different otide probe molecule. An advantage of using water insoluble polymers is that the polymer microcapsule will not 25 from the signal emitted by the unbound labeled probe. hence migrate from the surface of the phosphor upon aging the the two can be distinguished without the need for a physical encapsulated phosphors in an aqueous solution (i.e., separation step. In heterogeneous assays, the signal emitted improved reagent stability). Another advantage in using from the bound and unbound labeled probes is identical. copolymers in whicht he encapsulating polymer is only hence the two must be physically separated in order to partially functionalized is that one can control the degree of 30 distinguish between them. The classical heterogeneous spe functionalization, and thus the number of biological probe cific binding assay is the radioimmunoassay (RIA) (Yalow et molecules which can be attached to a phosphor particle. on al. (1978) Science 200: 1245, which is incorporated herein average. Since the solubility and coacervative encapsulation by reference). Other heterogeneous binding assays include process will depend on the dominant nonfunctionalized the radioreceptor assay (Cuatrecasas et al. (1974) Ann. Rev. component of the copolymer, the functionalized copolymer ratio can be varied over a wide range to generate a range of 35 Biochem, 43: 109). the sandwich radioimmunoassay (U.S. potential crosslinking sites per phosphor, without having to Pat. No. 4.376.110, which is incorporated herein by Substantially change the encapsulation process. reference), and the antibodyflectin sandwich assay (EPO 166 A preferred functionalization method employs heterobi 623. which is incorporated herein by reference). Heteroge functional crosslinkers that can be made to link the biologi neous assays are usually preferred, and are generally more cal macromolecule probe to the insoluble phosphor particle sensitive and reliable than homogeneous assays. in three steps: (1) bind the crosslinker to the polymer coating Whether a tissue extract is made or a biological fluid on the phosphor, (2) separate the unbound crosslinker from the coated phosphors. and (3) bind the biological macro sample is used, it is often desirable to dilute the sample in molecule to the washed, linked polymer-coated phosphor. one or more diluents that do not substantially interfere with This method prevents undesirable crosslinking interactions subsequent assay procedures. Generally, suitable diluents between biological macromolecules and so reduces irrevers 45 are aqueous solutions containing a buffer system (e.g., 50 ible aggregation as described by Tanke et al. Examples of mM NaH2PO, or 5-100 mM Tris. pH4-pH10), non suitable heterobifunctional crosslinkers, polymer coating interfering ionic species (5-500 mM KCl or NaCl, or functionalities, and linkable biological macromolecules sucrose), and optionally a nonionic detergent such as Tween. include, but are not limited to: When the sample to be analyzed is affixed to a solid support, 50 it is usually desirable to wash the sample and the solid support with diluent prior to contacting with probe. The
Coating Heterobifunctional Biological sample, either straight or diluted. is then analyzed for the Functionality Crosslinker Macromolecule diagnostic analyte.
carboxylate N-hydroxysuccimide Proteins (e.g., In the general method of the invention, an analyte in a Ab, avidin) 55 sample is detected and quantified by contacting the sample 1-ethyl-3-(3-dimethylamino with a probe-label conjugate that specifically or preferen propyl)-carbodiimide (EDC) primary N-5-azido-2-nitrobenzoyl tially binds to an analyte to form a bound complex, and then All having 1° amine amine oxysuccimide (ANB-NOS)
detecting the formation of bound complex, typically by aminobenzoate (SIAB) measuring the presence of label present in the bound com thiol N-succinimidyl (4-iodoacetyl) Proteins plexes. A probe-label conjugate can include a directly (reduced aminobenzoate (SIAB) labeled analyte-binding reagent (e.g. a primary antibody sulfonate) linked to an up-converting phosphor) and/or an indirectly labeled analyte-binding reagent (e.g. a primary antibody that is detected by a labeled second antibody, or a biotiny
Binding Assays 65 lated polynucleotide that is detected by labeled streptavidin). Up-converting phosphors and up-converting organic dyes The bound complex(es) are typically isolated from unbound are used as reporters (i.e., detectable markers) to label probe-label conjugate(s) prior to detection of label, usually
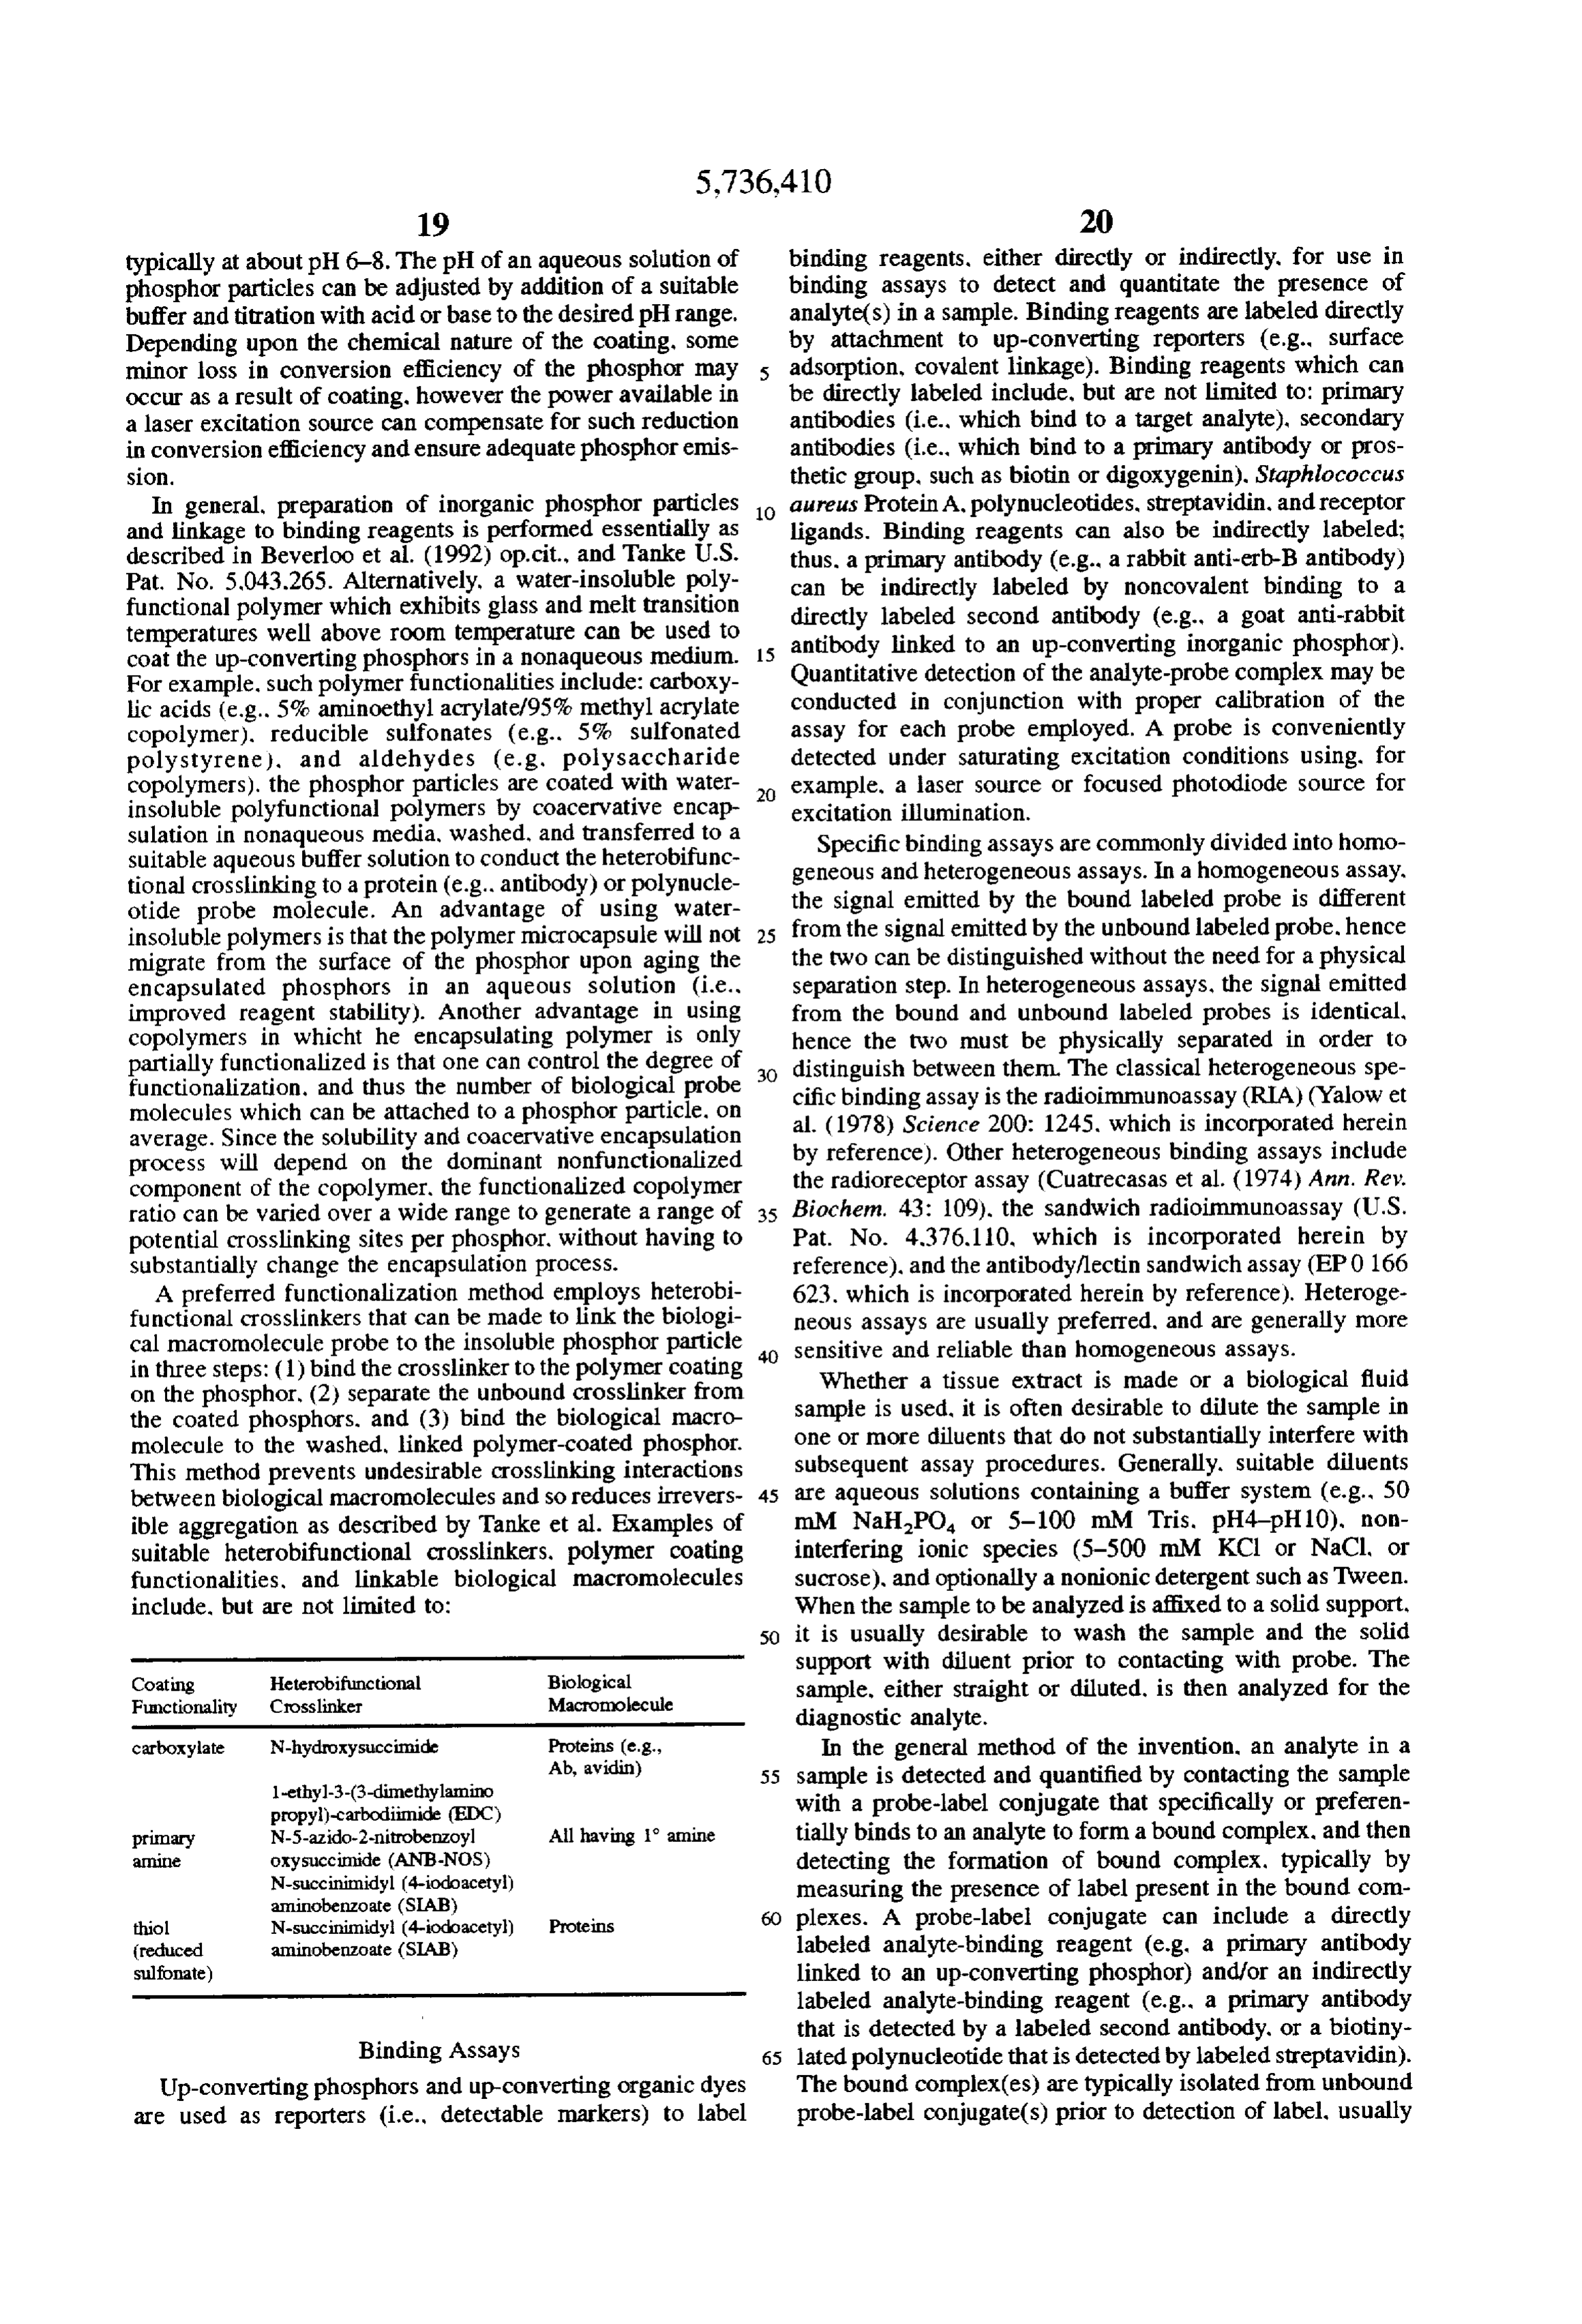
Page 48
by incorporating at least one washing step, so as to remove suitable binding period, followed by washing or otherwise background signal attributable to label present in unbound removing unbound probe, and finally by detecting the probe-label conjugate(s). Hence, it is usually desirable to presence, quantity, and/or location of bound probe. The step incubate probe-label conjugate(s) with the analyte sample of detecting bound probe can be accomplished by detecting under binding conditions for a suitable binding period. label, if the probe is directly labeled, or by incubating the Binding conditions vary, depending upon the nature of the bound complex(es) with a second binding reagent (e.g. probe-label conjugate, target analyte, and specific assay streptavidin) that is labeled and which binds to the probe, method. Thus, binding conditions will usually differ if the thus accomplishing indirect labeling of the probe. probe is a polynucleotide used in an in situ hybridization, in Up-converting labels are attached to probe(s) or second a Northern or Southern blot, or in solution hybridization 10 binding reagents that specifically or preferentially bind to assay. Binding conditions will also be different if the probe probe(s) by any of the various methodologies discussed is an antibody used in an in situ histochemical staining herein. Additionally, up-converting phosphor particles can method or a Western blot (Towbin et al. (1979) Proc. Natl. be encapsulated in microspheres and coated with a probe Acad. Sci. (U.S.A.) 76: 4350, incorporated herein by (e.g. a specific antigen or antibody) for use as a labeled reference). In general, binding conditions are selected in 15 probe in an immunodiagnostic assay or nucleic acid hybrid accordance with the general binding methods known in the ization assay to detect an analyte in a sample, such as the art. For example, but not for limitation, the following presence of an antibody, virus, or antigen in a blood serum binding conditions are provided for general guidance: sample, according to the method of Hari et al. (1990) For antibody probes: Biotechniques 9; 342, which is incorporated herein by 10-200 mM Tris. pH 6-8; usually 100 mM Tris pH 7.5 reference. Microencapsulation of phosphor can be accom
15-250 mM. NaCl; usually 150 mM NaCl 0.01-0.5 percent, plished in several ways known in the art, including coating by volume. Tween 20 1 percent bovine serum albumin monomer the phosphor with a monomer solution and polymerizing the 4°-37° C.; usually 4° to 15° C. to generate a polymer shell encasing the phosphor For polynucleotide probes: particle. Phosphor particles embedded in a polymer coating. 25 such as a gel coating, can be functionalized (e.g., with amino 3-10x SSC. pH 6-8; usually 5x SSC. pH 7.5 0-50 percent groups) for covalent attachment to a binding component. deionized formamide 1-10x Denhardt's solution 0-1 per Similarly, up-converting phosphor particles can be coated cent sodium dodecyl sulfate 10-200 ug/ml sheared dena with probe directly, either by surface adsorption, by multiple tured salmon sperm DNA 20°-65° C., usually 37-45° C. hydrogen bonding by electrostatic interaction, by van der for polynucleotide probes longer than 50 bp, usually Waals binding. or by covalent linkage to a functional group 55°-65° C. for shorter oligonulceotide probes on a functionalized inorganic phosphor particle (e.g. a Additional examples of binding conditions for antibodies vitroceramic phosphor), for example, by linking an amino and polynucleotides are provided in several sources, includ acid side-chain amine or carboxylate group of a probe ing: Maniatis et al. Molecular Cloning: A Laboratory protein to a carboxylate or amine group, respectively, on a Manual (1989), 2nd Ed. Cold Spring Harbor, N.Y. and 35 functionalized phosphor particle.
Berger and Kimmel. Methods in Enzymology, Volume 152. In certain embodiments, such as where steric and/or Guide to Molecular Cloning Techniques (1987). Academic charge interference of a bulky up-converting phosphor par Press, Inc.. San Diego. Calif.; Young and Davis (1983) Proc. ticle inhibits binding of the linked binding reagent to a Natl. Acad. Sci. (U.S.A.) 80: 1194, which are incorporated target, it is desirable to incorporate a molecular spacer herein by reference. When the probe is a receptor ligand. between the phosphor particle and the binding reagent. For such as IL-2, B-interferon, or other polypeptide hormones. example, a derivatized microencapsulated phosphor or vit cytokines, or lymphokines, suitable binding conditions gen roceramic phosphor may be conjugated to a heterobifunc erally are those described in the art for performing the tional reagent having a -(CH2)- spacer, where n is respective receptor-ligand binding assay. usually an integer from about 2 to about 50, between Various examples of suitable binding conditions useful in 45 terminal functional groups. Similarly, phosphors may be immunoassays and immunohistochemistry are discussed, directly derivatized with derivatizing agents (e.g., omega for example. in Harlow and Lane, Antibodies: A Laboratory functionalized silanes) having long intramolecular spacer Manual, Cold Spring Harbor, N.Y. (1988), which is incor chains, wherein a functional group reactive with a desired porated herein by reference. In general, suitable binding binding reagent is separated from the surface of the phos conditions for immunological reactions include an aqueous 50 phor by a spacer of usually at least about 15 A (i.e., the binding buffer containing a salt (e.g. 5-500 mM NaCl or equivalent of about 10 -CH2-straight-chain groups). In KCl), a buffer (e.g. Tris or phosphate buffer at pH 4-10). some embodiments, labels are attached by spacer arms of and optionally a nonionic detergent (e.g., Tween). In some various lengths to reduce potential steric hindrance. Multiple embodiments, proteinase inhibitors or stabilizers may be layers of spacer arms may also be used (e.g., multiple layers included. The binding reactions are conducted for a suitable 55 of streptavidin-biotin linkages). binding period, which, for antibody reactions, are typically Multiple Analyte Detection at least about 1 to 5 minutes, preferably at least about 30 minutes to several hours, although typically less than about Since up-converting phosphors can be differentiated on 24 hours, more preferably less than about a few hours or the basis of the excitation and/or emission wavelength less. Binding reactions (including washes) are typically spectra, up-converting phosphors can be used to detect and carried out a temperature range of about 0°C. to about 45° discriminate multiple analyte targets, such as for example, C., preferably about 4° C. to about 20°-25° C. cell surface antigens or soluble macromolecules. Binding assays, which include in situ hybridization, in For example, streptavidin, avidin, or another linker mac situ binding assays, and immunohistochemical staining, are romolecule (e.g. antidigoxigenin antibody) are attached usually performed by first incubating the sample with a 65 respectively, to each of two different phosphors (for blocking or prehybridization solution, followed by incubat illustration, designated here as Phosphorf1 and Phosphorf2) ing the sample with probe under binding conditions for a which differ in their absorption and/or emission spectra so as
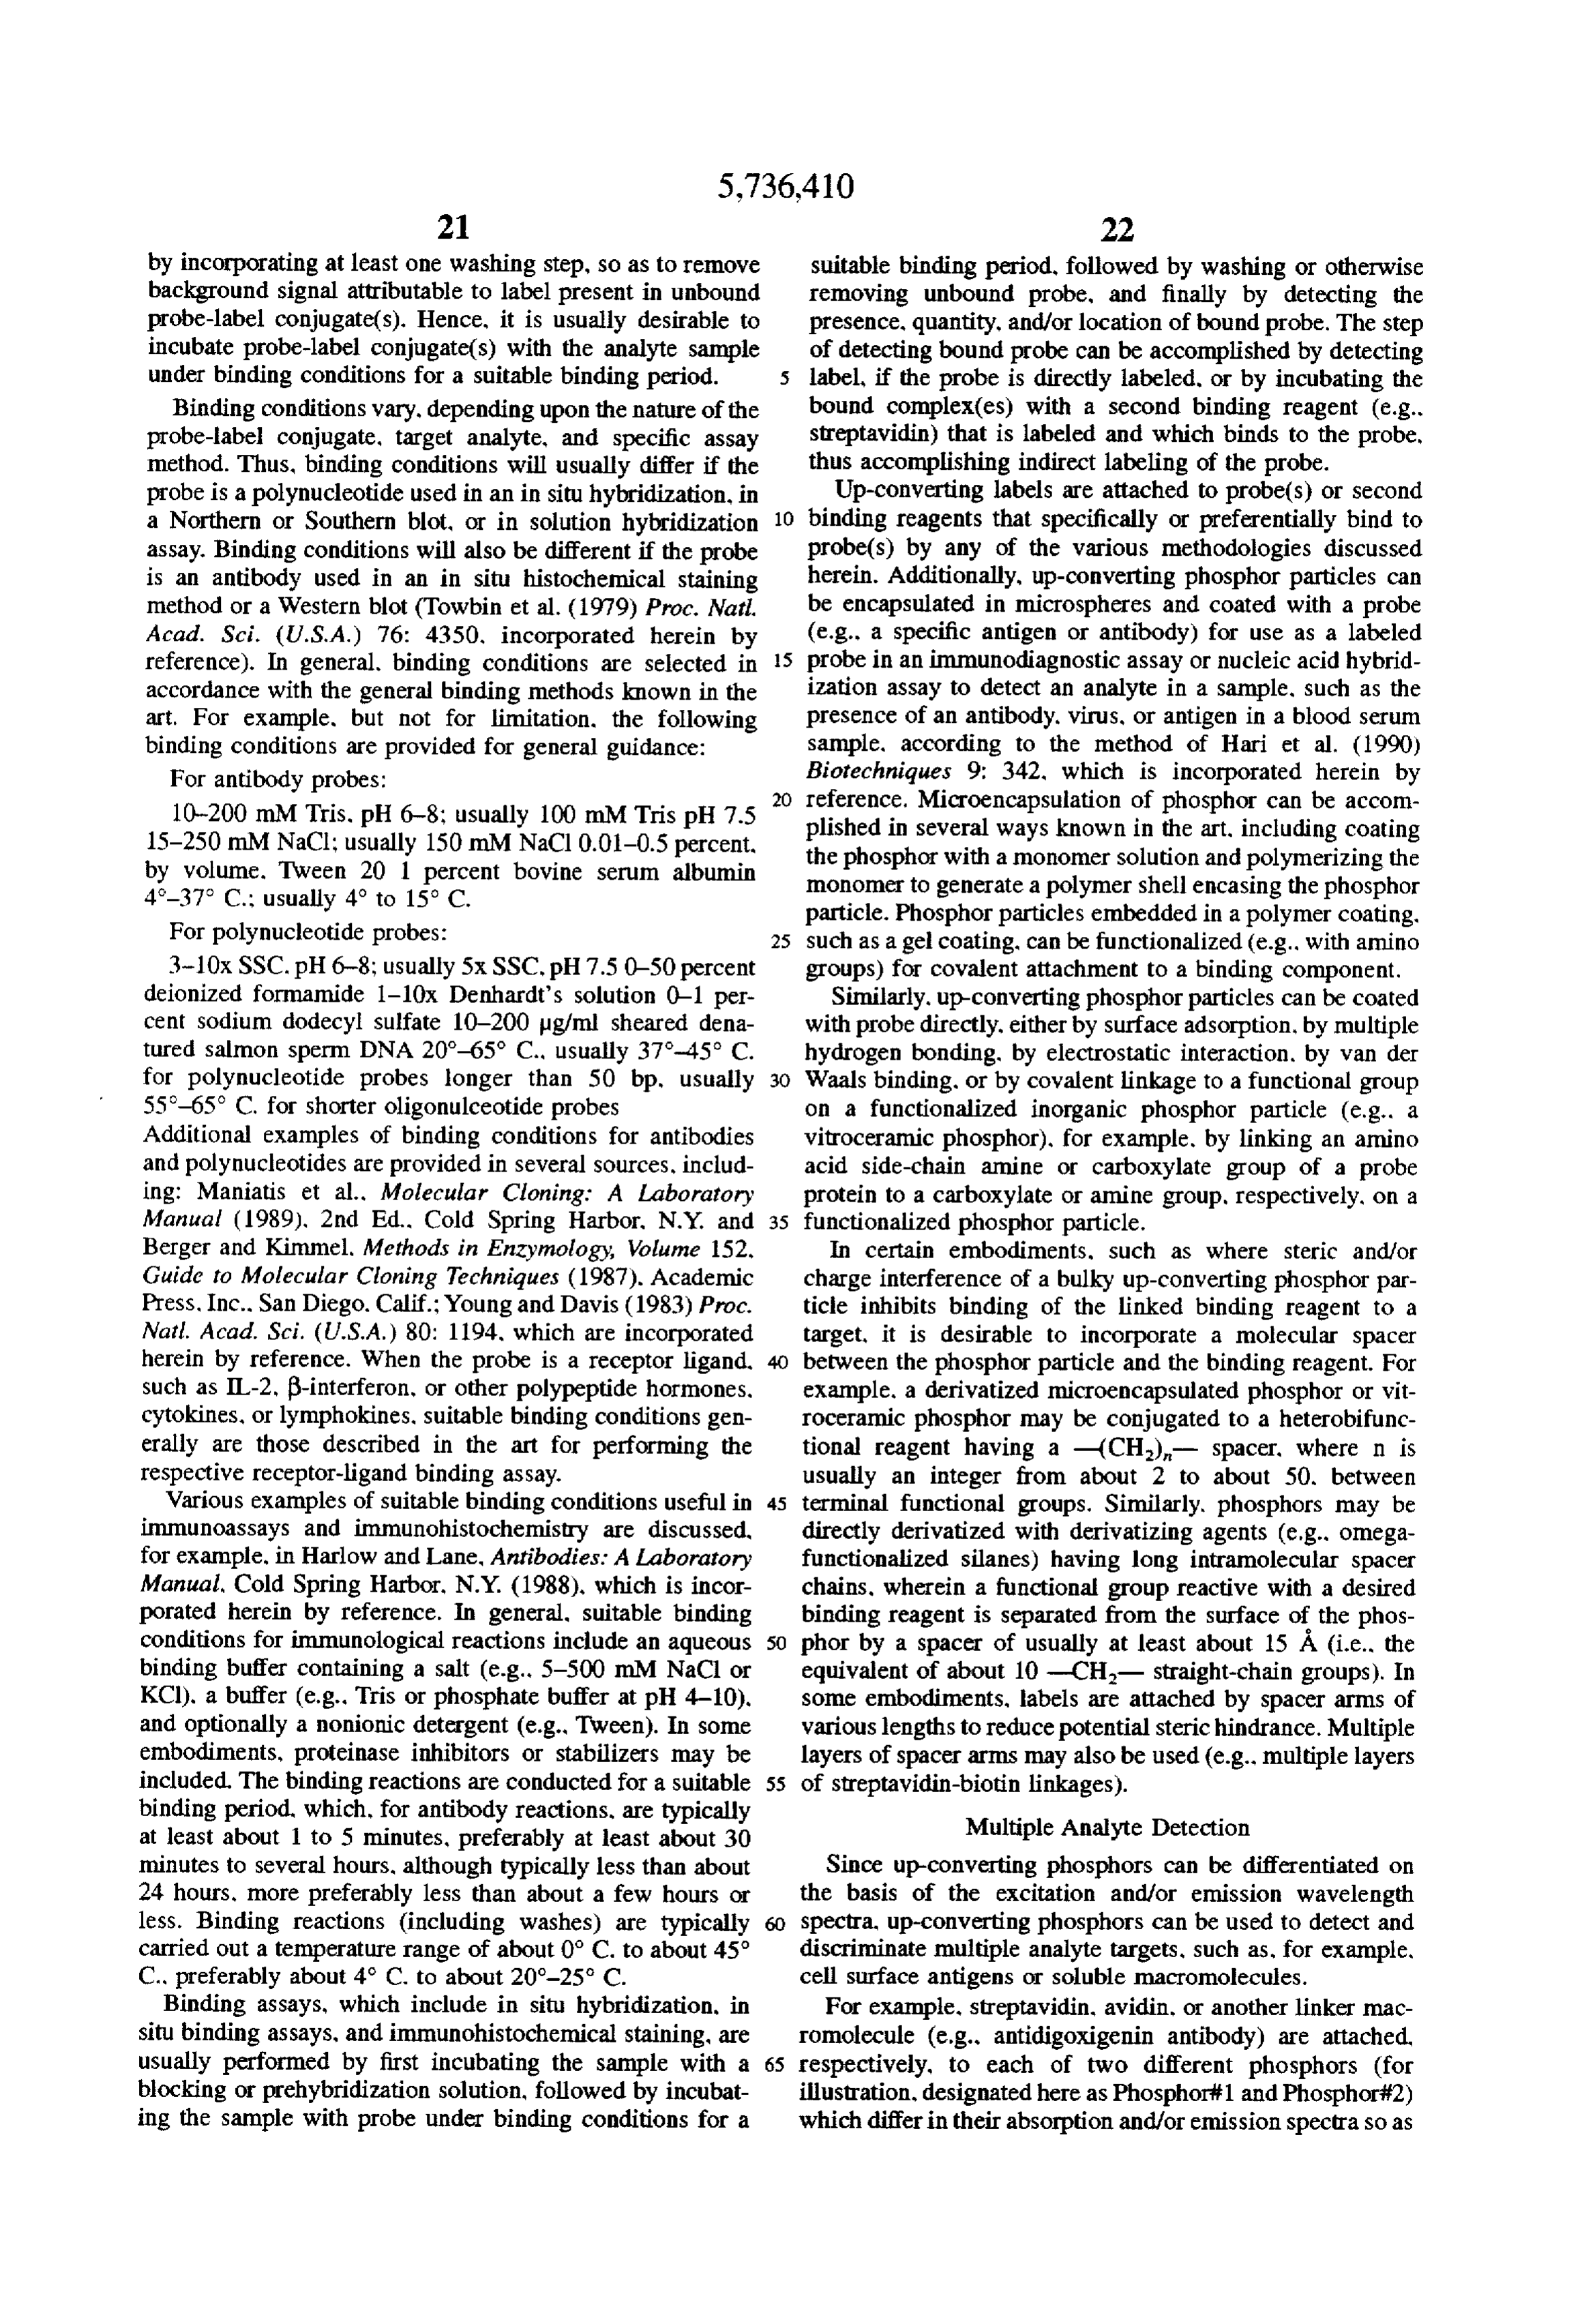
Page 49
to facilitate discrimination of the two phosphors based on more of the species of first binding component may bind to absorption and/or emission wavelengths; e.g. one phosphor a particular analyte (e.g., a muscarinic receptor) in an may emit in the blue and the other may emit in the green. For analyte solution that is in contact with the solid support. example and not limitation, Na(YosoYbossroo)P emits component Binding of the analyte to one or more of the first binding predominantly in the green, and Na(Yo-YbozTmoo)F species may then be detected with a second emits predominantly in the blue, and thus these two phos antibody) binding component (e.g. an anti-muscarinic receptor phors may be discriminated on the basis of their phospho directly orlabeled through with an up-converting phosphor (either a biotinylated secondary antibody).
rescent emissions. Alternatively, two phosphors may pro
Solid substrates duce essentially similar emission spectra but may have ponent which can bind more can be attached to a first binding com different excitation wavelengths which provide a basis for may be immunocrossreactive than 10 one distinct analyte (e.g.
or polyspecific) and/or can be their discrimination in multiple analyte detection. A first attached binding component (e.g., an antibody) that binds specifically can bind tomultiple multiple first binding component species which distinct analytes. Similarly, multiple sec to a first analyte species (e.g., a lymphocyte CD4 antigen) ond binding component species with binding specificities and incorporates biotinyl moieties which may be bound by for particular analytes can be employed. When multiple streptavidin-Phosphorf1 conjugates can be used to quanti 15 second binding component species are employed, it is typi tatively detect the presence of a first analyte in a sample cally desirable to label each second (e.g. a serum sample) by measuring phosphorescence of species with a unique up-converting binding component label that can be
Phosphorif 1 in analyte-binding component complexes. A distinguished on the basis of its absorption and/or emission second binding component (e.g. a probe polynucleotide) properties.
that binds specifically to a second analyte species (e.g., an It is possible to use different absorbers in combination HIV-1 sequence) and incorporates digoxygenin moieties (e.g., 11-UTP-digoxygenin) which may be bound by with various emitters to produce a collection of phosphors antidigoxigenin-Phosphorf2 conjugates can be used to emissionseveral having differentiable combinations of excitation and spectra. For example but not limitation. six differ quantitatively detect the presence of a second analyte in the entiable phosphors may be generated from two absorbers sample by measuring phosphorescence of Phosphorf2 in 25 analyte-binding component complexes. Thus, by simulta wavelength and three emitters. A first absorber. A has an excitation neously or contemporaneously detecting the presence of wavelength of , a second absorber. A has an excitation of Wa, a first emitter. E. has an emission line multiple phosphor reporters having differentiable signal characteristics, multiple analytes may be quantitatively ata third Wei, a second emitter. E. has an emission line at A. and emitter, E. has an emission line at . The six detected in a single sample. phosphors may be differentiated and the signal from each Sandwich Binding Assays individually quantitated by illuminating the sample with an Up-converting phosphors labels can be used as reporters excitation wavelength A1 and detecting separately the for sandwich binding assays (U.S. Pat. No. 4,376,110, which emitted radiation at A. We, and A. and separately illu is incorporated herein by reference). For example, a mag 35 minating the sample with A2 and detecting separately the netic bead, such as a superparamagnetic immunobead or emitted radiation at W. A. and A. Table II shows the functionalized magnetizable polymer particle (Polysciences, various absorber:emitter combinations and their excitation Inc.. Warrington, Pa.), can serve as the solid substrate which and emission wavelengths.
has an immobilized first binding component (e.g. an antibody, a polynucleotide, or a lectin) that binds to a first 40 TABLE I epitope (i.e. a binding locus: an antigenic determinant, Absorber:Emitter Combination Excitation Emission . sugar moiety. chemical substituent, or nucleotide sequence) of an analyte. The analyte binds to the first binding com Al:El
ponent and also to a second binding component (e.g., an AE3 Al E3 antibody, a lectin, or a polynucleotide) which binds to a 45 A2:El A2 El second epitope of the analyte. Thus, the analyte bridges the A2:E2 A2 AE2 two binding components to form a sandwich complex which A2:E3 A2 AE3 is immobilized with respect to the solid substrate. The second binding component typically has an attached or Of course, additional absorber:emitter combinations are incorporated label, such as a biotinyl group which can be 50 possible to provide more than six differentiable phosphor bound to a streptavidin-coated up-converting phosphor. labels.
Alternatively, the second binding component can be linked It is also possible to utilize solid substrates of different directly to an up-converting phosphor, such as through a types which may be distinguished (e.g. by size, color, covalent linkage with a functionalized vitroceramic density, magnetic properties, shape, charge) so that a par up-converting phosphor. 55 ticular type of solid substrate is associated with a particular The sandwich complex comprises the first binding species of first binding component.
component, an analyte, and the second binding component, For example and not limitation, the following three brief which is labeled, either directly or indirectly, with an examples are provided to explicate further possible appli up-converting reporter. The sandwich complex is thus cations of multiple analyte sandwich assay methods. immobilized on the solid substrate, although the solid sub Substrate Differentiation strate itself may be mobile (e.g., a superparamagnetic bead circulating in a sample slurry). The presence and amount of The following example describes the use of distinguish analyte(s) can be quantitatively measured by detecting the able substrate types to detect the presence of specific immu presence of up-converting reporter in sandwich complexes. noglobulin idiotypes in a sample (e.g. a blood serum sample For example, a solid substrate may have a plurality of 65 taken from a patient) which can provide diagnostic infor distinct species of first binding component (e.g. an array of mation about the immune status of a patient (e.g., is a patient different oligopeptides affixed to a solid support). One or seroreactive with a particular antigen).
Page 50
Large superparamagnetic beads are conjugated to an identical. The standarized relative intensities of the two immunogenic Herpesvirus Type II envelope glycoprotein. phosphors provides a measure of the relative abundance of medium-sized superparamagnetic beads are conjugated to the APP isoform(s) containing the Y or Z epitopes. HIV gp120 glycoprotein, and small superparamagnetic beads are conjugated to an immunogenic cytomegalovirus Phosphor and Substrate Differentiation envelope glycoprotein. A serum sample is taken from a The following example describes the use of differentiable patient and is incubated with a mixture of the superpara up-converting phosphors in conjunction with distinguish magnetic beads under binding conditions to permit specific able substrate types to detect the presence and relative binding of immunoglobulins in the sample with the three abundance of particular T lymphocyte immobilized viral glycoprotein species. The superparamag O blood sample taken from an individual. subpopulations Although
described netic beads are separated from the sample to remove non here with reference to detecting T cell subpopulations. specifically bound immunoglobulin and incubated with analyte up-converting phosphor particles coated with Staphylococ multiplemultiplexing analytes in a (i.e., detecting and/or characterizing sample by using various solid sub cus aureus Protein A, which binds to IgG, under binding strate types and/or up-converting phosphor labels) is conditions. Superparamagnetic beads having specifically 15 believed to be a generally applicable method. bound IgG are thus labeled with the phosphor-Protein A Large superparamagnetic beads are conjugated to an conjugate. Large. medium. and small superparamagnetic anti-CD4 antibody, medium-sized superparamagnetic beads are then separately illuminated with phosphor exci are conjugated to anti-CD8 antibody, and small superpara beads tation electromagnetic radiation and time-gated emitted phosphorescence is detected. Background attributable to magnetic beads are conjugated to an anti-CD28 antibody. An non-specific binding. if any. is determined and subtracted antibody that specifically binds to the CD2 antigen is labeled using internal standard beads (bovine serum albumin coated with an up-converting phosphor that has an excitation wave superparamagnetic beads) and positive and negative control length and emits in the red. An antibody that specifically serum samples. The intensity of phosphorescence associated binds to the CD45R antigen is labeled with an up-converting with the large. medium, and small beads provides a measure 25 phosphor the green.
that has an excitation wavelength and emits in
An antibody that specifically binds to the CDwó0 of the amount of antibodies in the sample which are reactive with the Herpesvirus Type II envelope glycoprotein. HIV antigen is labeled with an up-converting phosphor that has gp120 glycoprotein, and cytomegalovirus envelope an excitation wavelength A and emits in the blue. glycoprotein, respectively. This information can be used to A blood (or serum, sputum. urine, feces, biopsy tissue. determine whether an individual patient has been infected 30 etc.) sample is taken from a patient and is incubated with a with the HIV-1. human CMV, and/or Herpes Simplex Type mixture of the superparamagnetic beads and phosphor II viruses. labeled antibodies under binding conditions to permit spe cific binding of cells in the blood sample with the three
Phosphor Differentiation bead-immobilized antibody species and the three phosphor The following example describes the use of differentiable 35 labeled antibody species. After antigen-antibody binding up-converting phosphors to detect the presence and relative occurs, the superparamagnetic beads are segregated and abundance of particular isoforms of human APP (amyloid examined, either sequentially or simultaneously, by illumi precursor protein) in a serum or brain biopsy sample. nation with . . and a. and quantitative detection of red, Various isoforms of APP arise in the brain as a consequence green, and blue emissions, respectively. For example, the of alternative exon usage and/or alternative proteolytic pro 40 intensity of A-induced red light emission associated with cessing pathways. Thus, although all APP isoforms may the large beads is a rough measure of the amount of cells share a common, hypothetical epitope (X), a particular APP having both CD4 and CD2 surface antigens and/or the isoform may have a unique epitope (Y), while another APP relative abundance of those surface antigens (e.g. there may isoform has a unique epitope (Z). It is possible that the be very few CD4" cells that have CD2, but those few cells relative abundance of a particular APP isoform in a sample 45 may have a large amount of CD2 antigen, and hence a large may be of predictive value or may be pathognomonic for CD2 phosphorescent signal). Similarly, the intensity of Alzheimer's Disease. -induced green light associated with the large beads is a Superparamagnetic beads are conjugated to an antibody rough measure of the amount of cells having both CD4 and that binds specifically to a common APP epitope (X) shared CD45R surface antigens and/or the relative abundance of by all isoforms. A specific antibody reactive with the unique 50 those surface antigens in a sample. Y epitope is labeled with Phosphor #1, which is excited by In this manner, an analyte sample. Such as a blood sample, wavelength and emits in a wavelength spectrum centered can be "fingerprinted" for the presence and relative in the blue. A specific antibody reactive with the unique Z distribution(s) (e.g., cosegregation and/or correlation) of epitope is labeled with Phosphor #2, which is excited by a various analyte species. Such an analyte fingerprint may be wavelength and emits in a wavelength spectrum centered 55 used for providing diagnostic or therapeutic information, for in the green. A sample containing APP isoforms is incubated example, as to measuring a patient's immune status or with the Superparamagnetic beads and labeled specific anti measuring response to chemotherapy directed against a bodies under binding conditions. The superparamagnetic particular blood cell subset. Similar analyte fingerprints can beads are retrieved from the sample, either individually or in be used to type pathogenic organisms and viruses, as well as bulk. The beads are illuminated with wavelength A and blue to order polynucleotide sequences for gene mapping and/or light emission is detected and measured, and illuminated sequencing.
with W and green light emission is detected and measured. Superparamagnetic beads which can be differentiated The intensity of A-induced blue emission is a measure of based on size. shape, color, or density can be magnetically the APP isoform(s) having the Y epitope, while the intensity trapped individually and scanned with appropriate excitation of the A-induced green emission is a measure of the APP 65 illumination(s) and phosphor emission(s) characteristic of isoform(s) having the Z epitope. If the emissions from two particular analytes detected. For example, a unitary detector phosphors are readily distinguishable, W and A may be can simultaneously or contemporaneously trap the super
Page 51
paramagnetic bead from a suspension, determine the bead file through an illumination Zone (e.g., as in a fluorescence type (size, shape, and/or color), and scan for presence and activated cell sorter or the like). Thus, an up-converting abundance of particular phosphors (by illuminating with phosphor linked to an anti-CD8" antibody can be used to excitation wavelength(s) and detecting emitted selectively damage CD8" lymphocytes in a lymphocyte wavelengths). sample, where (1) the phosphor emits at a wavelength that By performing binding assays under dilute conditions is either directly cytotoxic and/or (2) the phosphor emits at wherein an average of one analyte or less (e.g., lymphocyte) a wavelength that produces reactive chemical species by is bound per microbead, it is possible to type cells individu photocatalysis of a compound present in the sample (e.g., a ally (e.g., determine the abundance of CD45R on each sample can be doped with buckminsterfullerene). individual CD4" cell) and thus generate more precise lym 10 Instead of using the emitted radiation directly for photo phocyte subpopulation definitions. catalytic action on tissue or tumors, an excited form of Biotinylated magnetic beads can also be used to monitor oxygen, so called singlet excited oxygen (OAg) can be the kinetics of binding streptavidin to phosphor particles generated by energy transfer from a dye sensitizer to dis and/or to segregate or purify streptavidin-coated solved molecular oxygen. This scheme makes use of the up-converting phosphor particles from a reaction. Thus, 15 tissue penetrating power of near-infrared radiation (red and streptavidin and up-converting phosphor particles are mixed ultrared region light, including 970 nm) which reaches the in a reaction vessel under binding conditions for forming inorganic up-converting phosphor. Two of the infrared pho streptavidin-coated phosphor particles. After a suitable bind tons are converted either into a red, green, or blue photon ing period, unbound streptavidin may be removed (e.g. by depending on the absorption spectrum of the sensitizer dye. centrifugation wherein phosphor particles are collected as 20 The dye is excited by the up-converted radiation into a triplet the pellet, unbound streptavidin in the supernatant is state which transfers its energy to a dissolved molecular decanted, and the pellet is resuspended), biotinylated mag oxygen molecule to yield an excited (singlet) oxygen mol netic beads are added to the remaining phosphor suspension ecule. The cytotoxic activity of singlet oxygen is well in binding conditions, and streptavidin-coated phosphor documented in photodynamic therapy and other biomedical particles are recovered bound to the biotinylated magnetic 25 applications (see. Wagnieres et al. (19–21 Jan. 1990) Future beads. Directions and Applications of Photodynamic Therapy, pp. Photophysical Catalysis by Up-Converting Phosphors 249, SPIE Institutes for Advanced Optical Technologies. Other applications of the invention employ phosphors as Society of Photo-Optical Instrumentation Engineers. Box a photophysical catalyst linked to a probe. where the radia 10, Bellingham, Wash. 98277; Pelegrin et al. (1991) Cancer tion emitted by the phosphor is used, typically in conjunc 30 67: 2529; Wagnieres et al. (24-25 May 1991) Future Direc tion with a dye molecule, to produce localized intense tions and Applications of Photodynamic Therapy, pp. 219; electromagnetic radiation in an area adjacent to the probe for Folli et al. (17 Dec. 1991) Fluoresceine Clinique 4; Bra various purposes other than detection (e.g., cytotoxicity, ichotte et al. (May 1991) ENT-Clinic, Lausanne. ionization of chemical species. mutagenesis. etc.). For Switzerland).
example, an antibody that specifically binds to a cell surface 35 In this application the up-converting phosphor is mixed or antigen, such as a CD8 antigen on a CD8" lymphocyte, may laced with a sensitizing dye such as methylene blue, rose be used as a probe linked to a up-converting phosphor to bengal or phthalocyanine derivatives, such as localize the phosphor to CD8" lymphocytes. A sample Zn-phthalocyanine. In the first and third case a red-emitting containing CD8" lymphocytes can be incubated with the phosphor is used, whereas for rose bengal a green-emitting anti-CD8 probe-phosphor conjugate and irradiated with an 40 phosphor is best suited. The phthalocyanine derivatives are excitation wavelength (e.g. from an infrared laser diode). ideally suited for this purpose because of their total insolu resulting in emission of up-shifted photons (i.e., higher bility in aqueous or biological solutions. These dyes there frequency electromagnetic radiation) in the vicinity of CD8" fore stay in close proximity to the emitters so that the lymphocytes to which the anti-CD8' probe-phosphor con specificity of the cell surface-reporter/probefdye complex jugate has bound. The emitted radiation may be of a wave 45 becomes the limiting factor. In this case, specialized com length that is directly mutagenic and/or cytotoxic (e.g. binations of reporter/probe/dye formulations preferably in ultraviolet radiation that can lead to formation of thymine the 0.1 to 0.3-micron size range must be synthesized in order dimers, 760-765 nm light is also believed to produce to enable efficient energy transfer: first, up-converted radia chromosomal damage) or may be of a wavelength that can tion is absorbed by the dye as completely as possible; and cause a photolytic decomposition of a chemical present in 50 second, the dye excited energy (triplet state) is transferred to the environment, leading to local formation of reactive dissolved molecular oxygen. Both processes are very effi species that may damage adjacent cells (e.g., photodecom cient if the absorption spectrum of the sensitizer dye is position of buckminsterfullerene, Co. to Css and C may matched to the up-converted radiation.
produce free radicals that may cause lipid peroxidation of This scheme presents a step beyond the traditional pho cell membranes). 55 todynamic therapy methods in that the red light can be used Since phosphor-emitted radiation is isotropic, it is gener both for tracking and diagnostic as well as for therapeutic ally desirable to physically separate targets (e.g., CD8" purposes after up-converting thus necessitating only one lymphocytes) from non-targets (e.g. CD8 lymphocytes) (infrared) light source at about 1000 nm. A further advantage prior to excitation irradiation, so that undesirable damage to is the greater range within biological samples of the infrared non-targets by isotropic emission(s) (i.e., "secondary radiation compared to other known photodynamic therapy damage") is avoided. Physical separation may be accom excitation schemes (750-850 nm).
plished by various means, including but not limited to: (1) For embodiments employing up-converting phosphors as performing excitation irradiation on a dilute suspension of photophysical catalysts, it is generally desirable that: (1) the target and non-target cells, wherein the mean distance sepa wavelength(s) of the excitation radiation do not produce rating individual cells is sufficient to reduce secondary 65 significant photocatalysis of the substrate compound, (2) the damage to non-targets, and (2) employing hydrodynamic wavelength(s) of the excitation radiation are not directly focusing to pass cells (both targets and non-targets) single cytotoxic or mutagenic, and (3) the emitted radiation is
Page 52
directly cytotoxic and/or is of an appropriate wavelength to Penzkofer and W. Leupacher, Optical and Quantum Elec produce a biologically effective amount of photodecompo tronics 19 (1987). 327-349; C. H. Chen and M. P. McCann, sition of a substrate compound (e.g., buckminsterfullerene, Optics Commun. 63 (1987). 335; J. P. Hermann and J. psoralen, compounds containing azide substituents or other Duculing, Optics Commun, 6 (1972), 101; B. Foucault and J. photoactivated groups). Alternatively, histidine side chains 5 P. Hermann. Optics Commun, 15 (1975), 412; Shichun Li of polypeptides can be oxidized by light in the presence of and C. Y. She, Optica Acta 29 (1982), 281-287; D. J. dye sensitizers, such as methylene blue or rose bengal Bradley, M. H. R. Hutchinson and H. Koetser. Proc. R. Soc. (Proteins, Structures and Molecular Principles, (1984) Lond. A 329 (1972), 105-119.
Creighton (ed.). W. H. Freeman and Company, New York; Resonant Multiphoton Ionization
Introduction to Protein Structure, (1991), C. Branden and J. At very high laser intensities the up-converting organic Tooze. Garland Publishing, New York, N.Y., which are dyes are induced to absorb an additional exciting photon in incorporated herein by reference). Thus, for example, the field of focussed laser radiation. At those high laser up-converting phosphors linked to anti-CD8 antibodies can intensities the fluorescence is suppressed in favor of absorp be used as photophysical catalysts to produce selective. tion of an additional photon. This process usually brings the localized damage to CD8" lymphocytes. In accordance with 5 organic dye molecules above the ionization limit in solution the invention, essentially any antibody can be linked to an and they stabilize by emitting an electron into the solvent appropriate up-converting phosphor. either directly or by shell. The result of this three-photon interaction is a molecu conjugation to protein A which may then bind the immu lar ion and an attached or solvated electron. When this noglobulin. Thus, the up-converting photophysical catalysts charge separation is taking place in an electric field, the of the invention may be used to target essentially any desired 20 charges drift and generate a voltage that can be detected in antigen or cell type that can be distinguished by the presence an extremely sensitive manner. This amounts to the mea of an identified antigen. surement of the transient conductivity in the solvent system Up-Converting Organic Dyes and is usually more sensitive than light detection. The Similar to the up-converting inorganic phosphor reporters disadvantage of this method is that it necessitates electrodes we propose to use "molecular" labels whose fluorescence 25 that sense the moving charges. In that sense it is not as will be detected by optoelectronic means. Infrared or red non-invasive a method as light detection. On the other hand light is exciting the probe-reporter complex bound to a it bypasses the conversion of light into a photoelectric signal target, after which light is emitted at shorter wavelengths which represents an enormous advantage. Every optical with respect to the illuminating source. This up-converted system has a restricted viewing angle that reduces efficiency. light is free of scattered light from the source or autofluo 30 whereas photoionization "senses" always close to 100% of rescence by virtue of its higher energy. Furthermore. autof the charges generated. Effectively, the non-linear interaction luorescence is greatly reduced by virtue of the excitation in of the laser field converts every excited organic dye mol the infrared or red spectral range. The light source is a pump ecule into an electric pulse at sufficiently high field inten laser whose pump pulses are short in order to achieve high sities that can be routinely achieved using commercial laser powers and low energy in order to enable nonlinear optical 35 sources. Specific examples are the excitation of Rhodamine processes in the dye. The goal is to excite the second excited around 650 to 700 nm, or BBQ excitation around 480 nm. singlet state (S) in a dye with a ps pulse from a tunable dye Organic dyes absorbing in the red have to absorb two laser using two red or infrared photons. After pumping the additional photons after being excited into S thus making S. state the dye relaxes within a few ps to the fluorescing the whole process a four-photon excitation process. which is state (S) which can be detected by optoelectronic means. slower than a three-photon non-linear process. There may, The goal of reaching the S. state using two photons enables however. be circumstances where such a four-photon pro one to take advantage of the increasing two-photon cross cess is desirable.
sections as one approaches the S2 state using two-photon Detection Apparatus absorption. The non-resonant two-photon absorption cross Detection and quantitation of inorganic upconverting sections are on the order of 10' to 10 cms, whereas the 45 phosphor(s) is generally accomplished by: (1) illuminating a cross sections corresponding to S absorption are larger by sample suspected of containing up-converting phosphors two to three orders of magnitude. A few specific examples with electromagnetic radiation at an excitation wavelength. will be mentioned: in general cyanines, xanthenes, and (2) detecting phosphorescent radiation at one or more rhodamines, acridines and oxazines are well suited for this emission wavelength band(s). purpose. Blue dyes can also be used, but the excitation 50 Illumination of the sample is produced by exposing the wavelength will be in the red. Rhodamine can be excited at sample to electromagnetic radiation produced by at least one 650 to 700 nm using two photons, and fluorescence is excitation source. Various excitation sources may be used, expected around 555 nm. Many IR dyes such as IR-140, including infrared laser diodes and incandescent filaments, IR-132 and IR-125 can be excited at 1060 nm using two as well as other suitable sources. Optical filters which have photons of the Nd:YAG fundamental, and fluorescence is 55 high transmissibility in the excitation wavelength range(s) expected in the 850 to 950 nm range. An example of a blue and low transmissibility in one or more undesirable wave dye is BBQ excited at 480 nm to reach the S. state at 240 length band(s) can be employed to filter out undesirable nm, and fluorescence is expected at 390 nm. Many of these wavelengths from the source illumination. Undesirable dyes are only slightly soluble in aqueous solution and are wavelength ranges generally include those wavelengths that either polar in nature (cyanines) or have polar substituents. produce detectable sample autofluoresence and/or are within Depending on the nature of the probe, no or only minimal about 25-100 nm of excitation maxima wavelengths and attachment chemistry needs to be undertaken because of the thus are potential sources of background noise from scat abundance of functional groups on the dye chromophore. tered excitation illumination. Excitation illumination may Several companies sell entire lines of dyes: examples are also be multiplexed and/or collimated; for example. beams KODAK, Exciton and Lambda Physik. The scientific foun 65 of various discrete frequencies from multiple coherent dations of two-photon laser excitation in organic dye mol sources (e.g., lasers) can be collimated and multiplexed ecules have been treated in a few experimental papers: A. using an array of dichroic mirrors. In this way, samples
Page 53
containing multiple phosphor species having different exci wherein prompt signals (i.e. occurring within about 0.1 to tation wavelength bands can be illuminated at their excita 0.3 us of termination of illumination) are rejected (e.g., an tion frequencies simultaneously. Illumination may be con electronic-controlled, solid-state optical shutter such as tinuous or pulsed, or may combine continuous wave (CW) Pockell's or Kerr cells). Up-converting phosphors and and pulsed illumination where multiple illumination beams up-converting delayed fluorescent dyes typically have emis are multiplexed (e.g. a pulsed beam is multiplexed with a sion lifetimes of approximately a few milliseconds (perhaps CW beam), permitting signal discrimination between phos as much as 10 ms, but typically on the order of 1 ms). phorescence induced by the CW source and phosphores whereas background noise usually decays within about 100 cence induced by the pulsed source, thus allowing the ns. Therefore, when using a pulsed excitation source. it is discrimination of multiple phosphor species having similar O generally desirable to use time-gated detection to reject emission spectra but different excitation spectra. For prompt signals.
example but not limitation, commercially available gallium Since up-converting phosphors are not subject to arsenide laser diodes can be used as an illumination source photobleaching. very weak emitted phosphor signals can be for providing near-infrared light. collected and integrated over very long detection times The ability to use infrared excitation for stimulating 15 (continuous illumination or multiple pulsed illumination) to up-converting phosphors provides several advantages. First. increase sensitivity of detection. Such time integration can inexpensive IR and near-IR diode lasers can be used for be electronic or chemical (e.g. photographic film). When sustained high-intensity excitation illumination, particularly non-infrared photographic film is used as a means for in IR wavelength bands which are not absorbed by water. detecting weak emitted signals, up-converting reporters pro This level of high-intensity illumination would not be suit vide the advantage as compared to down-converting phos able for use with conventional labels, such as ordinary phors that the excitation source(s) typically provide illumi fluorescent dyes (e.g. FTTC), since high-intensity UV or nation in a wavelength range (e.g., infrared and near visible radiation produces extensive photobleaching of the infrared) that does not produce significant exposure of the label and, potentially, damage to the sample. The ability to film (i.e. is similar to a darkroom safelight). Thus, use higher illumination intensities without photobleaching 25 up-converting phosphors can be used as convenient ultra or sample damage translates into larger potential signals, and sensitive labels for immunohistochemical staining and/or in hence more sensitive assays. situ hybridization in conjunction with fluorescence micros The compatibility of up-converting labels with the use of copy using an infrared source (e.g. a infrared laser diode) diode lasers as illumination sources provide other distinct and photographic film (e.g. Kodak Ektachrome) for signal advantages over lamp sources and most other laser sources. 30 and image detection of visible range luminescence (with or First. diode laser intensity can be modulated directly through without an infrared-blocking filter). modulation of the drive current. This allows modulation of Instrumentation Overview the light for time-gated or phase-sensitive detection The basic purpose of the instrumentation is to expose the techniques, which afford sensitivity enhancement without up-converting phosphor particles of an assay sample to the use of an additional modulator. Modulators require 35 near-infrared (NIR) light and to measure the amount of high-voltage circuitry and expensive crystals, adding both visible light that is emitted.
cost and additional size to apparatus. The laser diode or FIG. 1 is an optical and electronic block diagram illus light-emitting diode may be pulsed through direct current trating representative apparatus 10 for performing diagnos modulation. Second, laser illumination sources provide illu tics on a sample 15 according to the present invention. The mination that is exceptionally monochromatic and can be 40 invention may be carried out with one or a plurality of tightly focused on very small spot sizes, which provides reporters. For purposes of illustration, the apparatus shows advantages in signal-to-noise ratio and sensitivity due to a system wherein two diagnostics are performed on a single reduced background light outside of the desired excitation sample in which two phosphor reporters are used. The first spectral region and illuminated volume. A diode laser affords reporter has an excitation band centered at A and an these significant advantages without the additional expense 45 emission band centered at A" while the second reporter has and size of other conventional or laser sources. respective excitation and emission bands centered at A and Detection and quantitation of phosphorescent radiation A. Since the reporters of the present invention rely on from excited up-converting phosphors can be accomplished multiphoton excitation, wavelengths and 2 are longer by a variety of means. Various means of detecting phospho than wavelengths A" and . The former are typically in the rescent emission(s) can be employed, including but not near infrared and the latter in the visible. limited to: photomultiplier devices, avalanche photodiode, A pair of light sources 2001) and 2002), which may be charge-coupled devices (CCD). CID devices, photographic laser diodes or light-emitting diodes (LEDs), provide light at film emulsion, photochemical reactions yielding detectable the desired excitation wavelengths. while respective detec products, and visual observation (e.g., fluorescent light tors 22(1) and 22(2), which may be photodiodes, detect light microscopy). If the reporters are organic dyes, resonant 55 at the desired emission wavelengths. The emitted radiation multiphoton ionization can be sensed using electrostatic is related to the incident flux by a power law, so efficiency position-sensitive detectors. Detection can employ time can be maximized by having the incident beam sharply gated and/or frequency-gated light collection for rejection of focused on the sample. To this end, light from the two residual background noise. Time-gated detection is gener sources is combined to a single path by a suitable combi ally desirable, as it provides a method for recording long nation element 25, is focused to a small region by a lens or lived emission(s) after termination of illumination; thus, other focusing mechanism 27, and encounters the sample. signal(s) attributable to phosphorescence or delayed fluo Light emitted by the phosphor reporters is collected by a lens rescence of up-converting phosphor is recorded, while short 30, and components in the two emission bands are separated lived autofluoresence and scattered illumination light, if any. by a suitable separation element 32 and directed to the is rejected. Time-gated detection can be produced either by 65 respective detectors.
specified periodic mechanical blocking by a rotating blade There are a number of possible regimes for driving the (i.e., mechanical chopper) or through electronic means laser diodes and detecting the emitted light in the different
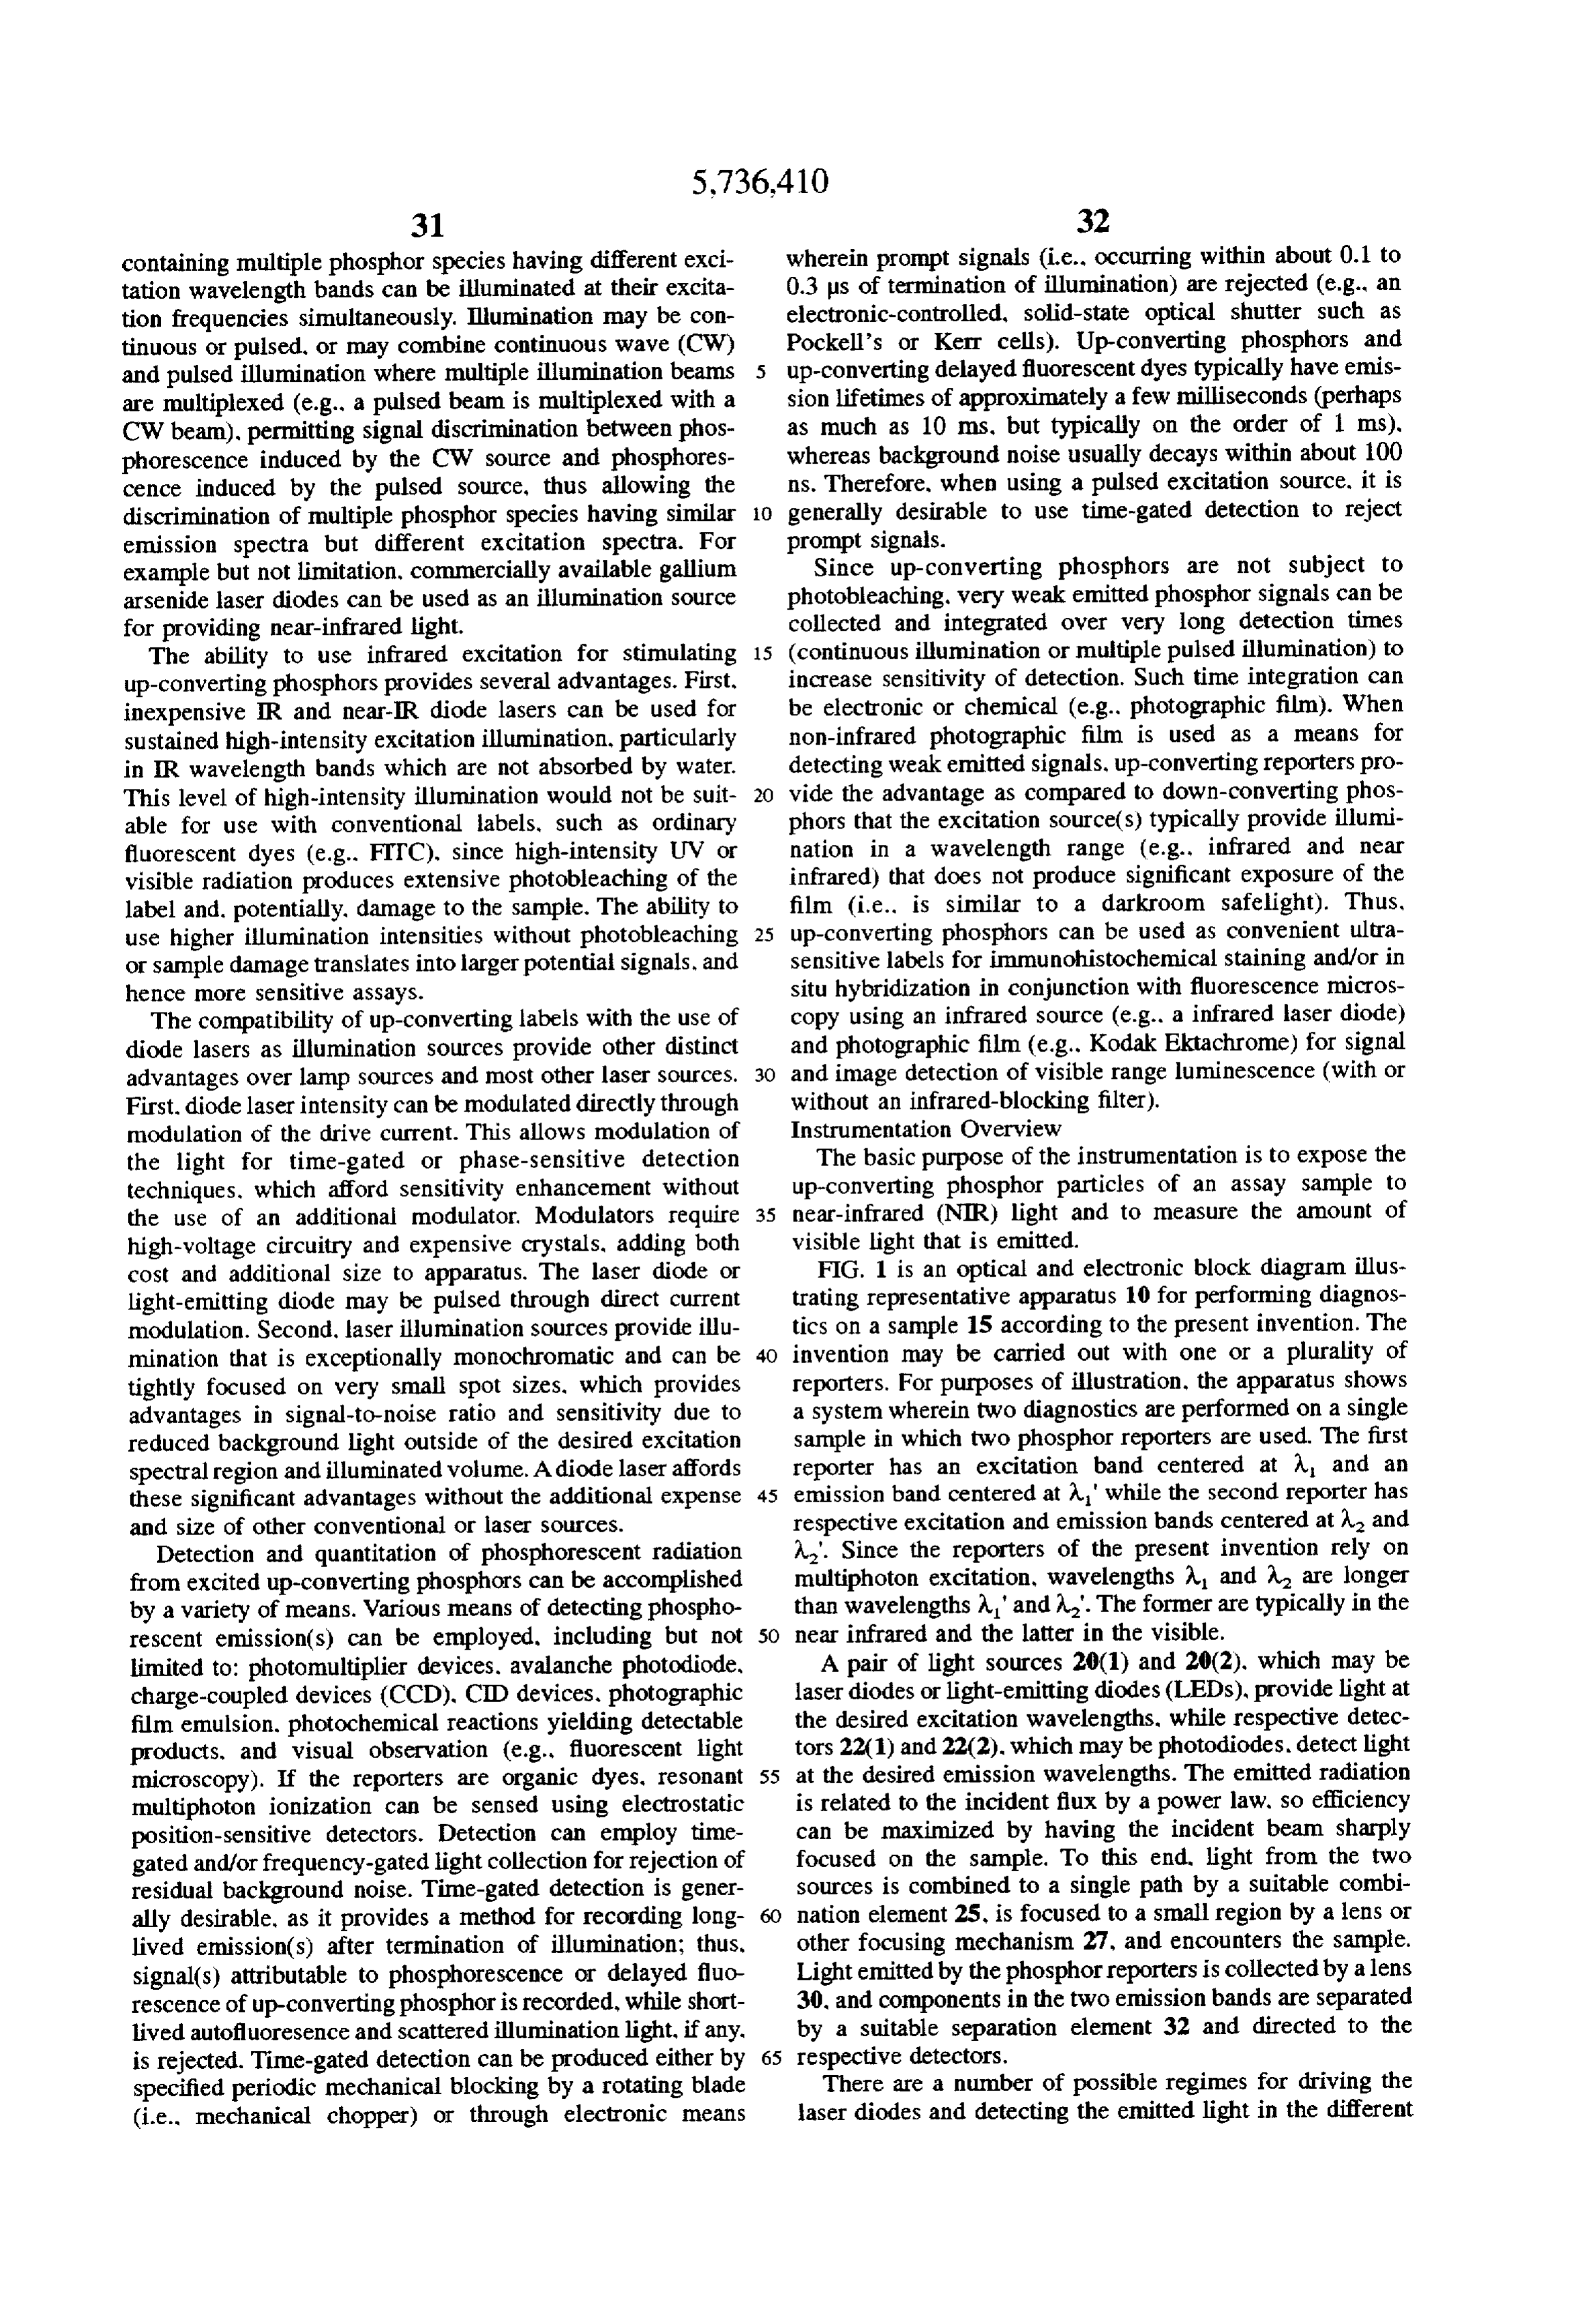
Page 54
wavelength bands. This is shown generically as a control laser diode 20(1) at a frequency f. and provides a signal at electronics block 35 communicating with the laser diodes f to the frequency mixer. The frequency mixer also receives and detectors. The particular timing and other characteristics the signal from detector 22(1) and a phase control input of the control electronics will be described below in con signal. This circuitry provides additional background dis nection with specific embodiments. crimination because the background has a much shorter There may be a plurality of reporters having distinct lifetime than the signal sought to be measured (nanoseconds emission bands but a common excitation band. In such a or microseconds compared to milliseconds). This causes the case, the system would include multiple detectors for a signal and background to have different phases (although single laser diode. Similarly, there may be a plurality of they are both modulated at the characteristic frequency of reporters having distinct excitation bands but a common the waveform generator). For a discussion of the lifetime emission band. In such a case, the system would include dependent phase shift, see Demtroder, Laser Spectroscopy. multiple laser diodes for a single detector, and would use Springer-Verlag. New York, 1988, pp. 557-559, incorpo time multiplexing techniques or the like to separate the rated herein by reference). The phase input signal is con wavelengths. trolled to maximize the signal and discriminate against the Light from the two sources is shown as being combined 15 background. This background discrimination differs from so as to be focused at a single location by a common that typical for phase sensitive detection where the signal is focusing mechanism. This is not necessary, even if it is modulated and the background is not. Discrimination desired to illuminate the same region of the sample. against unmodulated background is also beneficial here. Similarly, the collection need not be via a single collection leading to two types of discrimination. mechanism. If it is necessary to preserve all the light, the Because the signal relies on two-photon excitation, it is combination and separation elements can include a wave possible to use two modulated laser diodes and to detect the length division multiplexer and a demultiplexer using dich signal at the sum or difference of the modulation frequen roic filters. If loss can be tolerated. 50% beam splitters and cies. FIG. 2B shows such an arrangement where first and filters can be used. second laser diodes 2001) and 2001)" (emitting at the same The schematic shows the light passing through the sample 25 wavelength, or possibly different wavelengths) are modu and being detected in line. As a general matter, the emission lated by signals from waveform generators 37a and 37b from the phosphor reporters is generally isotropic. and it operating at respective frequencies f and f. The waveform may be preferred to collect light at an angle from the generator output signals are communicated to a first fre direction of the incident light to avoid background from the quency mixer 42. and a signal at f-f is communicated to excitation source. However, since the excitation and the 30 a second frequency mixer 45. The signal from detector 22(1) emission bands are widely separated, such background is and a phase input signal are also communicated to frequency unlikely to be an issue in most cases. Rather, other consid mixer 45.
erations may dictate other geometries. For example, it may FIG. 3 shows apparatus for performing gated detection. be desired to detect light traveling back along the path of the Since the background is shorter-lived than the signal, delay incident radiation so that certain elements in the optical train 35 ing the detection allows improved discrimination. To this are shared between the excitation and the detection paths. end, the laser diode is driven by a pulse generator 50, a A typical type of instrument with shared elements is a delayed output of which is used to enable a gated integrator microscope where the objective is used to focus the excita or other gated analyzer 55.
tion radiation on the sample and collect the emitted radia FIG. 4 shows an apparatus for performing diagnostics on tion. A potentially advantageous variation on such a con a sample using first and second, reporters having excitation figuration makes use of the phenomenon of optical trapping. bands centered at A and A. and having overlapping emis In a situation where the reporter is bound to a small bead, it sion bands near A. The sample is irradiated by light from may be possible to trap the bead in the region near the beam laser diodes 2001) and 2002) as discussed above in connec focus. The same source, or a different source, can be used to tion with FIG. 1. First and second waveform generators excite the reporter. The use of an infrared diode laser to trap 45 37(1) and 37(2) drive the laser diodes at respective frequen small particles is described in Sato et al. "Optical trapping cies f and f. and further provide signals at f and f, to of small particles using a 1.3 pum compact InGaAsP laser." respective frequency mixers 60(1) and 60(2), The signal Optics Letters. Vol. 16, No. 5 (Mar. 1, 1991). incorporated from detector 22(3) is communicated to both frequency herein by reference. mixers, which also receive respective phase input signals. Specific Detection Techniques 50 Thus, frequency mixer 60(1) provides an output signal As outlined above, multichannel detection uses optical corresponding to the amount of emitted light modulated at devices such as filters or dichroic beam splitters where the frequency f. which provides a measure of the presence of emission bands of the phosphor reporters are sufficiently the first reporter in the sample. Similarly, frequency mixer separated. Similarly, it was pointed out that multiple report 60(2) provides an output signal corresponding to the amount ers having a common emission band could be detected using 55 of emitted light modulated at frequency f. which provides electronic techniques. These electronic techniques will be a measure of the presence of the second reporter in the described below in connection with multiple sources. sample.
However, the techniques will be first described in the context The use of two different wavelengths was discussed above of a single channel. The techniques are useful in this context in the context of two reporters having different excitation since there are sources of background that are in the same bands. However, the discussion is germane to a single wavelength range as the signal sought to be measured. reporter situation as well. Since the excitation is a two FIG. 2A shows an apparatus for implementing phase photon process, there is no requirement that the two photons sensitive detection in the context of a single channel. Cor have the same energy. Rather, it is only necessary that the responding reference numerals are used for elements corre total energy of the two photons fall within the excitation sponding to those in earlier described figures. In this context. 65 band. Thus, since it is relatively straightforward and inex control electronics 35 comprises a waveform generator 37 pensive to provide different wavelengths with laser diodes. and a frequency mixer 40. Waveform generator 37 drives there are more possible combinations. i.e., more possible
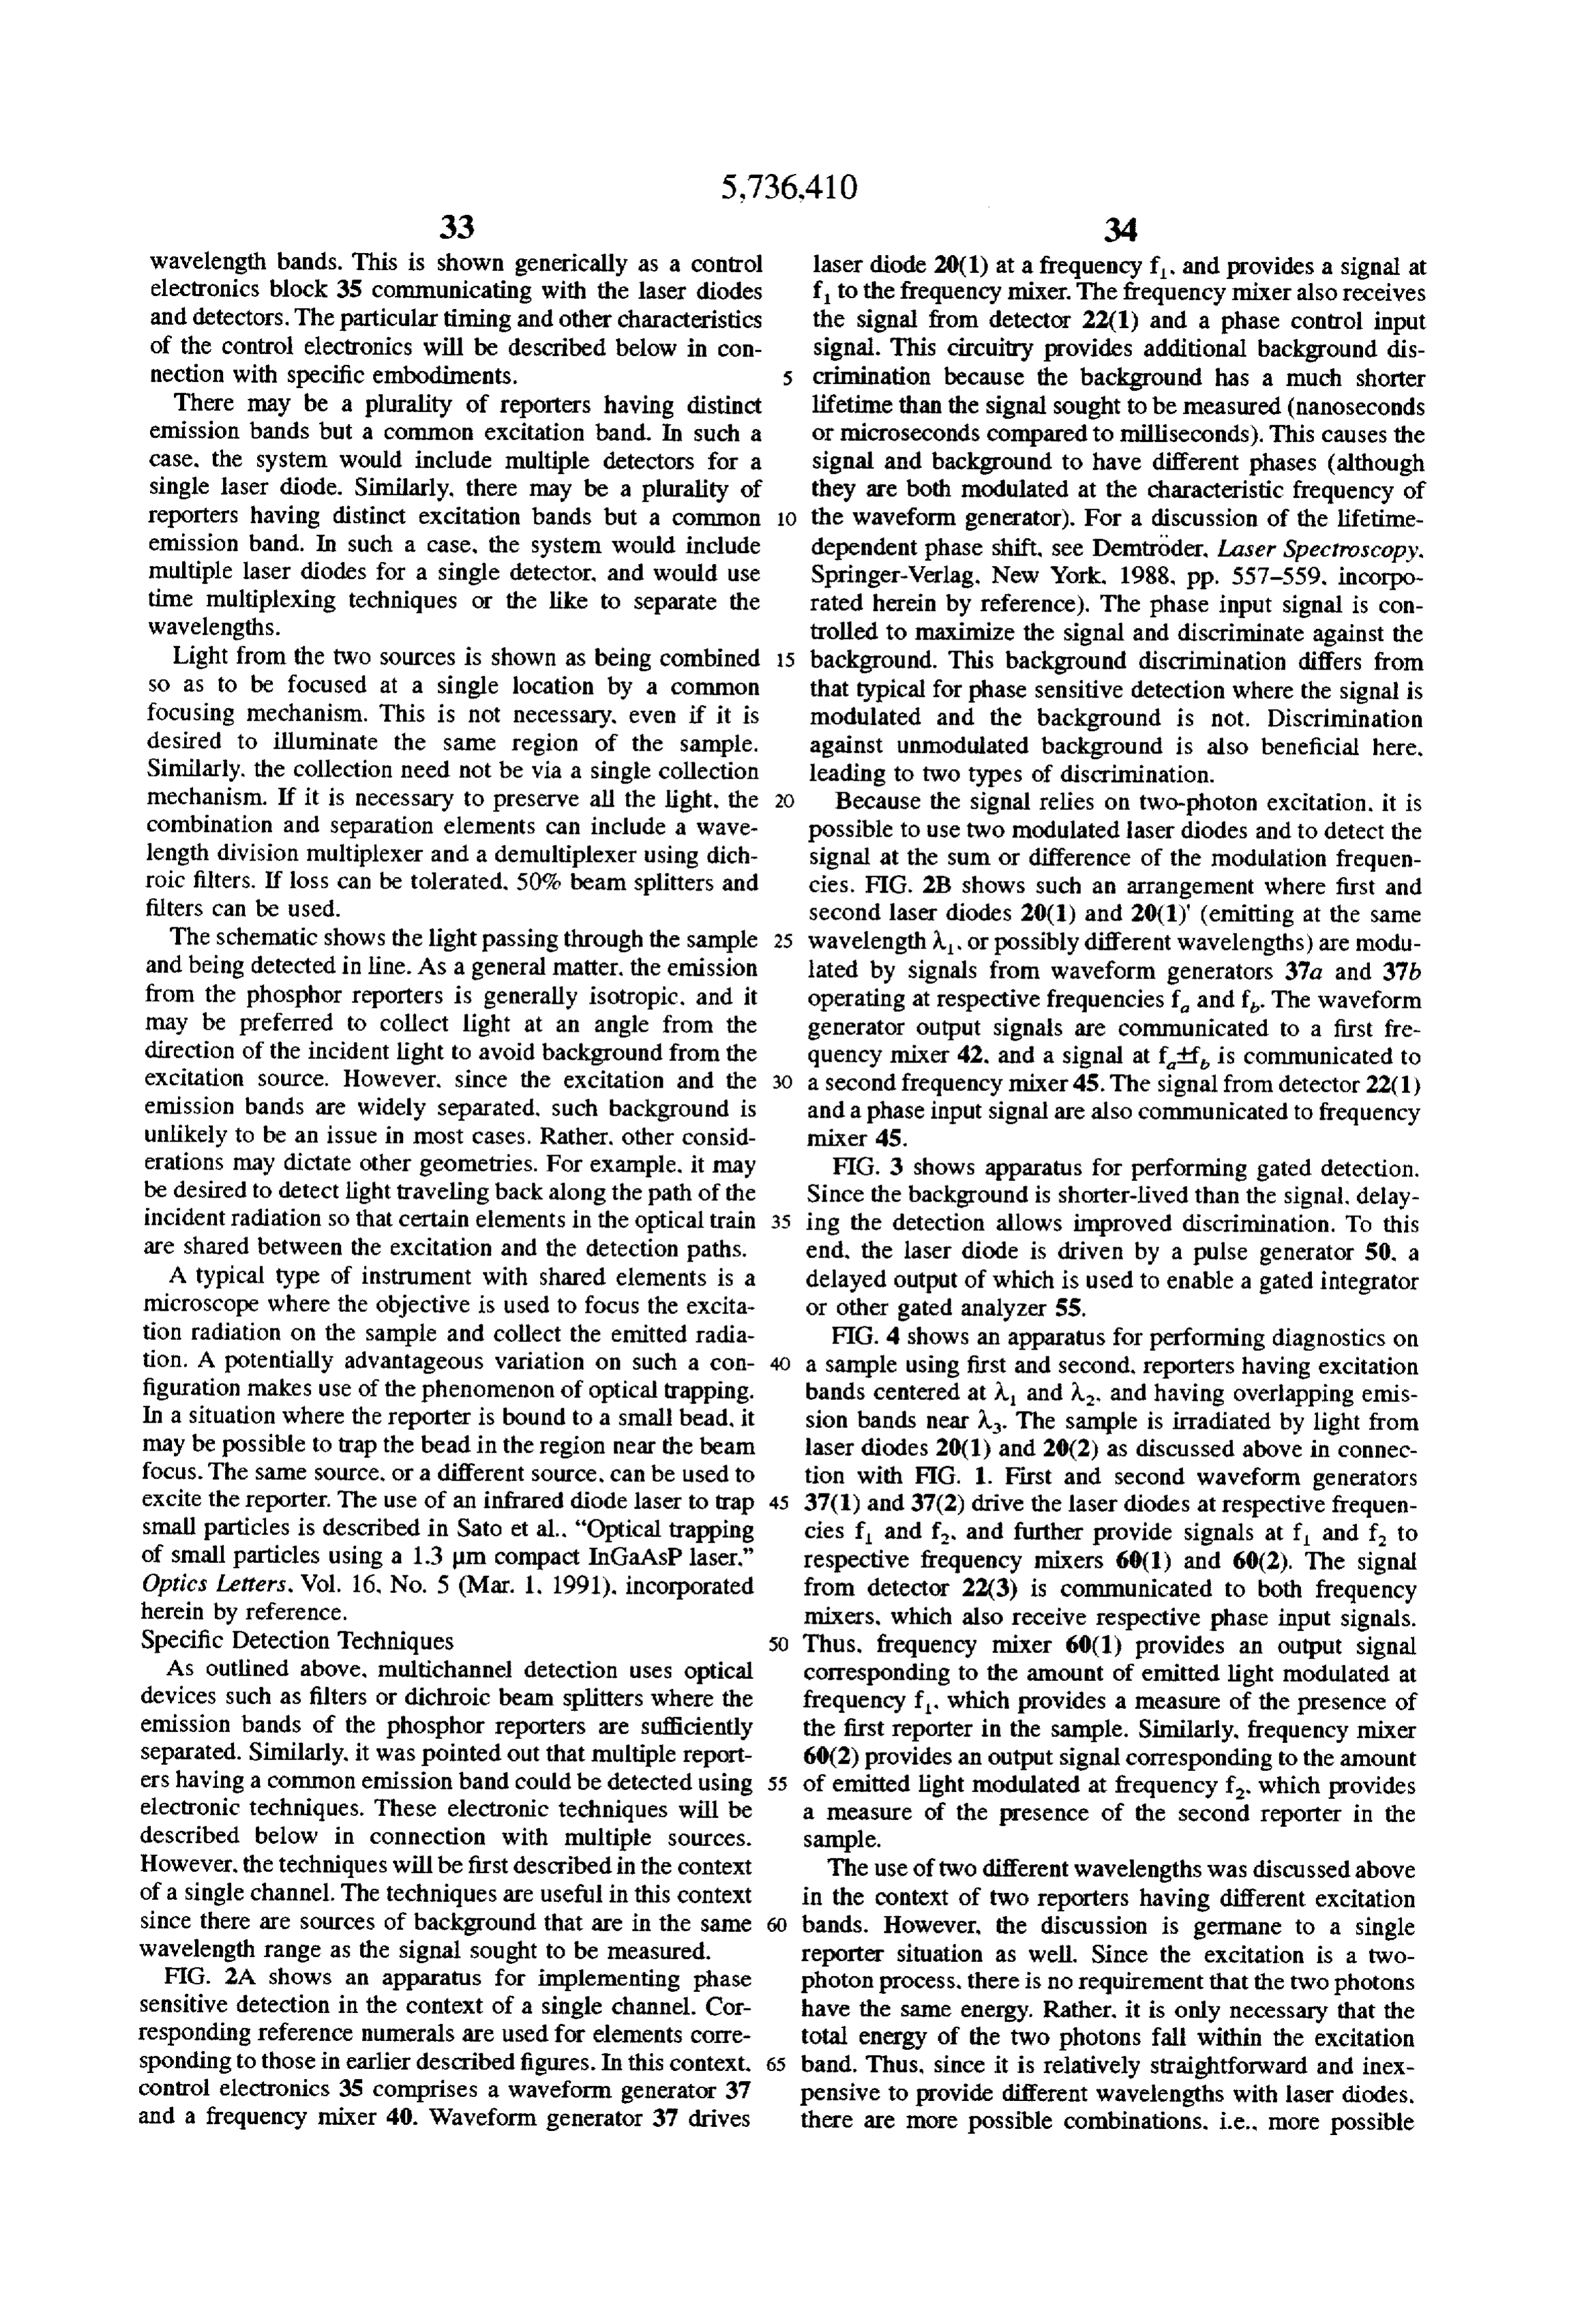
Page 55
choices of total excitation energy. This allows more latitude The alignment tip is brought into proximity with the test tube in the choice of rare earth ions for up-converters since the holding the sample so that focus point 115 is in the sample. excitation steps need not rely on energy transfer coinci It is assumed that the test tube is transmissive to the laser dences involving a single photon energy. Further, it may be radiation.
possible to achieve direct stepwise excitation of the emitting A portion of the light emanating from the region of focus ion (the erbium ion in the example outlined above) without point 115 in the sample is collected by GRIN lens 105, using energy transfer from another absorbing ion (the ytter focused into fiber 82, collimated by GRIN lens 100, and bium ion in the example) while taking advantage of resonant reflected at dichroic beam splitter 97. This light may contain enhancement of intermediate levels. Additionally, the use of wavelengths in up to the three emission bands. Optical filters different wavelengths for a single reporter can provide 10 120a-c direct the particular components to respective pho additional options for excitation-dependent multiplexing todetectors 125a-c. A particular filter arrangement is shown and background discrimination techniques. where each filter reflects light in a respective emission band, Multiple wavelength excitation of a single phosphor may but other arrangements would be used if, for example, one occur in a number of ways, as shown in FIGS. 5A through or more of the filters were bandpass filters for the emission 5C. Two lasers may cause stepwise excitation of a single ion, 15 bands.
as shown in FIG. 5A. A first laser stimulates excitation from The control electronics are not shown, but could incor level 1 to level 2, and a second laser stimulates excitation porate the time-multiplexed or heterodyne techniques dis from level 2 to level 3, at which level emission occurs. cussed above. Such techniques would be necessary, for Single ion excitation can also occur using energy transfer as example, if the emission bands were not distinct. shown in FIG. 5B. In this case, a first laser stimulates 20 FIG. 7A is a schematic of an embodiment of the invention excitation from level 1 to level 2. energy transfer occurs in which a charge coupled device (CCD) imaging array 150 from level 2 to level 3, and a second laser stimulates is used as a detector in combination with a two dimensional excitation from level 3 to level 4. In a variation of the latter array 152 of peptides or other biologically active species process. levels 1 and 2 can be in a first ion (i.e. a sensitizer deposited on a glass or plastic substrate. The CCD array has ion) and levels 3 and 4 in a second ion (i.e., activator ion) 25 a number of individually addressable photosensitive detec as shown in FIG. 5C. tor elements 155 with an overlying passivation layer 157 In a stepwise excitation scheme shown in FIG.5A, energy while the peptide array has a number of individual binding transfer is not required, and thus information on the polar sites 160. The probe containing the phosphor would be ization of the excitation lasers may be preserved and cause reaction specific to one or more of the elements in this polarization of the emitted radiation. In this case, depolar 30 peptide array and would therefore become physically ization of the light may allow for enhanced discrimination attached to those elements and only those elements. The between signal and background noise. peptide array is shown as having a one-to-one geometric For the multi-ion multi-laser excitation scheme shown in relation to the imaging array in which one pixel corresponds FIG. 5C, there may be several phosphors that share a to each element in the peptide array. However, it is also common excitation wavelength. In this case, discrimination 35 possible to have larger peptide elements that cover a group between different phosphors may be performed on the basis of detector elements should such be necessary. of different emission wavelengths and/or through time Various of the techniques described above can be used to gated. frequency-modulated, and/or phase-sensitive detec enable the detector array to distinguish the emissions of the tion utilizing modulation of the excitation wavelength(s). phosphor from the infrared laser stimulation. Specific Instrument Embodiments First, it is possible to use a phosphor that responds to IR FIG. 6 is a schematic view showing the optical train of a stimulation beyond the sensitivity range of the detector particular embodiment of apparatus for carrying out the array. An example of such a phosphor would be Gadolinium present invention on a sample using a hand-held probe. This oxysulfide: 10% Erbium. This phosphor is stimulated by embodiment takes the form of a miniaturized instrument 1.5-micron radiation and emits at 960 nm and 520 nm. The comprising a housing 75 (shown in phantom), a hand-held 45 detector array is insensitive to 1.5-micron radiation but is probe 80, with a fiber optic connecting cable 82. The optical sensitive to the up-converted radiation. and electronics components are located within the housing. Further, since the phosphor emission is relatively slow in For purposes of illustration, the optical components of a rise and fall time it could be time resolved from a pulsed 3-channel system are shown. The sample may contain up to laser stimulation source by the CCD detector array. The three reporters having distinct emission bands. for example. 50 decay time for the upconversion process is a variable in the blue, green, and red portions of the visible spectrum. dependent on the particular emitting transition and the It is also assumed that the reporters have distinct excitation phosphor host; however, it is normally in the range 500 us bands in the near infrared. seconds to 10 ms. This is very slow compared to the laser The output beams from three laser diodes 85a-c are excitation pulse and the capability of the detector array. communicated through graded index (GRN) lenses 87a-c, 55 The techniques for fabricating the CCD array are well focused onto the ends of respective fiber segments 88a-c known since CCD imaging arrays have been commercially and coupled into a single fiber 90 by a directional coupler 92 available for many years. A variety of such devices can be or other suitable device. The light emerging from the end of obtained from David Sarnoff Research Center, Princeton, fiber 90 is collimated by a GRIN lens 95. passes through a N.J.
dichroic beam splitter 97, and is refocused by a GRIN lens The techniques for fabricating the peptide array are 100 onto the end of fiber optic cable 82. The beam splitter described in a paper by Fodor et al., "Light-Directed, is assumed to pass the infrared radiation from the laser Spatially Addressable Parallel Chemical Synthesis." diodes but reflect visible light. Science, Vol. 251, pp. 767-773 (Feb. 15, 1991), incorporated Hand-held probe 80 includes a handpiece 102, an internal herein by reference. The particular array described contains GRIN lens 105, and a frustoconical alignment tip 110. The 65 1024 discrete elements in a 1.28 cmx1.28 cm area. light emerging from fiber 82 is focused by GRIN lens 105 The embodiment of FIG. 7A shows the peptide array in at a focus point 115 that is slightly beyond alignment tip 110. intimate contact with the CCD array. Indeed it may be
Page 56
possible to deposit the peptides directly on the passivation FIG. 27 is a block diagram of a microtiter plate reader for layer without a separate substrate. However, there may be use with the present invention. Within a light-tight test situations where spatially separated arrays are preferred chamber B1 is a near IR laser excitation source B2, a FIG. 7B shows an embodiment where the peptide array and photomultiplier tube (PMT) detector B3. and a sample assay the CCD array are separated. An array of lenses 165 collect plate B4. In the preferred embodiment of this apparatus, the light from respective binding sites and focus it on assay plate B4 is a Terasaki HLA plate. This plate is respective detector elements. This arrangement facilitates preferred due to its small tapered sample wells which tend the use of filters to the extent that other techniques for to concentrate the sample material into a relatively small rejecting the excitation radiation are not used.
Optical trapping may be used to transiently immobilize a targetthe area. The target area in this configuration is still larger sample particle for determination of the presence or absence 10 than diameter of the laser beam. Furthermore, it is possible that the distribution of the assay material across the of phosphor on the particle. Conveniently, the wavelength bottom of the well is not even. Because of these two factors, range used to trap sample particles may be essentially identical to an excitation wavelength range for the surface simply aiming the laser at the center of the bottom well up-converting phosphor(s) selected. so that optical trapping is unlikely to provide accurate readings. There are and excitation illumination is performed with the same 15 several approaches that can be used to circumvent this source. FIG. 8 shows a block diagram of an apparatus used problem. The first approach is to defocus the laser beam for single-beam gradient force trapping of small particles. sufficiently to allow a larger amount of the target area to be FIG. 26 is a block diagram of one embodiment of appa interrogated. However, depending upon the output of laser ratus for carrying out the present invention on a sample B2, defocussing the beam may lower the sensitivity of the using a microscope. In this embodiment a standard micro 2 apparatus to an unacceptable level. Another approach is to Scope is modified to accept infrared scanning optics and raster scan the laser beam across the bottom of target well. image processing electronics. A suitable microscope for A third and preferred approach is to simply automate the modification is the Zeiss model CLSM-10. Scanning and data collection system. The microscope is fitted with a HeNe laser A1 for visible Light from laser B2 passes through a filter B5 and is imaging and an argon laser A2 for both visible and UV 25 focussed by a lens B6 onto an individual sample well of imaging. Both lasers are mounted internally and are indi assay plate B4. Plate B4 is mounted on a pair of translators vidually selectable through a series of motorized shutters B7 which allow positioning in the horizontal and vertical A3. The upconverting phosphors are excited with an exter directions. In the present configuration translators B7 allow nally mounted IR laser diode. In the preferred embodiment, approximately 2.5 centimeters of travel; sufficient to address two IR laser diodes A4 and A5, operating at two different IR 3 sample wells in each direction. Translators B7 are con wavelengths, are coupled to the microscope thereby allow trolled by an x-y controller B8. Controller B8 allows for ing two different phosphor reporters to be identified. Laser either manual or computerized control. diodes A4 and A5 are individually selectable using motor Asample well on plate B4, when containing upconverting ized shutters A6. When an IR beam is selected, it is routed phosphors. will emit visible light which is collected by a lens through the microscope's galvanometrically controlled 35 B9, passed through a filter B10, and focussed through a lens Scanning mirrors A7 which scan the beam in a raster fashion. B11 and a shutter B12 onto PMT B3. PMT B3 outputs a The beam passes through the objective lens (not shown) current which is measured by a picoammeter B13. The PMT onto a sample A8 and is reflected back through the objective signal is proportional to the phosphor emission intensity. lens to a set of galvanometrically controlled receiving mir Shutter B12. controlled by a shutter driver B14, provides rors A7. Receiving mirrors A7 reflect the light onto pinhole exposure protection to PMTB3, thereby preventing damage optics A9. If the confocal mode is selected, pinhole A9 limits which may result from exposure to very intense light the detected image to the light collected from the focal sources. Furthermore, overexposure of PMT B3 to light plane. The light is imaged on a photomultiplier tube (PMT) causes high dark currents which require several hours to A10. The thickness of the focal plane is proportional to the decrease. PMT B3 is cooled for lower dark current and size of the pinhole. In the preferred embodiment of this 45 noise. Associated with the PMT cooler is a water-cooled apparatus. a 20 micrometer diameter pinhole is used which power supply B15. A power supply B16 supplies high results in a depth of field of about 1 micrometer. If the voltage to PMT B3.
confocal mode is not selected, the beam is deflected around When the apparatus is operated in a computerized mode. pinhole optics A9 directly to PMT A10. a computer B17 regulates controller B8 through an interface Once the optical signal is converted into an electronic one. 50 box B18, Picoammeter B13 can also be connected to com a standard, composite video signal can be developed and puter B17, thereby allowing automated data acquisition to displayed as an image on a television monitor All. The image be performed. The data acquisition procedure moves trans can be manipulated and enhanced through standard image lator B7 in the x direction to a first position at which location processing software. In the preferred embodiment of this a specified number of current readings are taken and the apparatus the software runs on an IBM 486 PC A12. The 55 average is calculated. Translator B7 then moves sample B4 Software can be used to perform averaging, filtering, edge a predetermined distance in the x direction to a new location detection and overlaying the images received from each of where new data is collected. During this process, the data is the different light sources. plotted in order to provide the user with an immediate visual In the confocal mode, it is possible to reconstruct a 3 evaluation. After the scan is completed, the data can be dimensional view of sample AS. The reconstruction is saved or further data processing can be performed. FIG. 28 formed by stepping through sample A8 at small intervals, is an illustration of the data for upconverting phosphors in making an image of the sample at each interval. The multiple three test wells.
sequential images are transferred to an external graphics FIG. 29 is a schematic view of a second embodiment of machine (not shown) for reconstruction of the sample in 3 a hand-held probe for carrying out the present invention. dimensions. These 3-D images can then be rotated to give 65 This embodiment is comprised of a housing D1 and a different perspectives of the data sets, leading to a better capillary wick D2. Within housing D1 is a diode excitation understanding of the samples. laser D3, a lens assembly D4, a photodiode detector D5, and
Page 57
a battery supply D6. A display D7 mounted to one surface easily fabricated in gridded array patterns using conven of housing D1 communicates the results of the test to the tional photolithography techniques. Each individual laser in user. In the preferred embodiment, laser D3 operates in the array F1 has a columnar beam designed to strike only the 960-980 nanometer range. adjacent portion of capture surface F4. The required power In use, wick D2 wicks up a portion of a sample fluid D8 5 density of the individual lasers is dependent upon the which is suspected of containing the target antigens. Target efficiencies of the phosphors being used as well as the antigens bind to the antibodies present at a capture surface required detection efficiency. The detectors comprising array D9. Capture surface D9 is positioned at the focal point of F2 are chosen to have an extremely low sensitivity in the source D3. The target antigens can be labeled with wavelength region in which laser array F1 operates. If phosphor-antibody cenjugates either before or after capture. O additional discrimination between the excitation and emis In the preferred embodiment wick D2 is formed of glass. In sion wavelengths is required, a cutoff filter can be used, this configuration capture surface D9 is prepared simply by preferably incorporated directly into capture surface F3. filling the inside of the capillary with a bubble containing the Upconverting phosphors F6 are conjugated by any of a antibodies of interest. By silanizing the inner surface with variety of conventional biochemical crosslinking chemis organofunctional silanes. conventional chemistries can be 15 tries to antibody. nucleic acid probes, or other biological used to covalently link the antibodies or other biological macromolecules (e.g. carbohydrates, lectins. Streptavidin. macromolecule(s) to the inner tube wall at the site of the MHC complexes), as well as to biological or chemical liquid bubble. The surface energy of the capillary is also antigens (F7). Bonded to overlay F3 is a grid array F8 of easy to modify by silanization. which will help prevent complementary probes or antigens which are bound to nonspecific reagent and antigen adherence to the walls of the 20 capture surface F3 using the same crosslinking chemistries. tube. In use. a sample fluid F9 flows between arrays F1 and F2. In the preferred embodiment of this apparatus. the lower target probes or antigens are captured by grid array F8 and portion of wick D2 is impregnated with up-converting excited by laser array F1. and the emissions detected by phosphors that are conjugated to the target analytes or a detector array F2.
crossreactive epitope for the capture probe. In use. the 25 Typically, the upconverting phosphors to be used with this phosphor conjugates chromatograph towards capture sur apparatus are approximately 0.1 to 0.5 micrometers. Since face D9 as sample fluid D8 is drawn up wick D2. As the size of the individual phosphor particles is of the order phosphors accumulate at capture surface D9. they will begin of the excitation wavelength, the power of the emission from to emit visible light upon excitation by diode laser D3. The the phosphors can be approximated by: visible light emitted by the phosphors is detected by detector 30
D5. The output of detector D5 is displayed on display D7. P=fND",
The amount of upconverted light reaching the detector is directly proportional to the concentration of labeled target where f is the phosphorescence efficiency (generally less antigen captured at the capture surface. than or equal to 10 cm'W'um particle'). N is the The apparatus of FIG. 29 can be designed to simulta 35 number of phosphor particles in the light path. D is the neously detect more than one target antigen. FIG. 30 illus diameter of the phosphor particles, and I is the power trates a three channel configuration using interference filters. density of the excitation source. In this configuration capillary wick D2 is placed at the focus Since the emitted power scales as the square of the of a small parabolic reflector D10 capable of collecting excitation intensity, diagnostics using upconverting phos approximately half of the emitted phosphorescence. The phors perform better in a microassay format. Assuming a beam from diode laser D3 is directed onto capillary wick D2 constant power output from the excitation source, the exci at capture surface D9 along a direction perpendicular to the tation power density increases proportionally with the optical axis of reflector D10. Phosphorescent light from decrease in detection area. and the number of phosphor capture surface D9 is collected and collimated by mirror particles in the light path decreases linearly with a decrease D10, directed through a notch filter D11 to reject the pump 45 in the detection area. Since the power of the light emitted light, and onto three detectors D5 using three dichroic beam from the phosphors scales with the square of the excitation splitters D12. The reflectance bands of dichroic beamsplit power density, but linearly with the number of phosphors, ters D12 are matched to the emission bands of the three P will increase in inverse proportion to the detection area. phosphors used in the detection process. Therefore, a 100x100 array will actually be 100 times more In an alternate embodiment of this apparatus, dichroic 50 sensitive than a 10x10 array.
beamsplitters D12 could be replaced with three bandpass Fluorescence-activated Cell Sorting filters used in the transmission mode. By placing the three The up-converting phosphors described herein can be filters on a rotation wheel, a single detector D5 could be used as phosphorescent labels in fluorescent cell sorting by used. Another alternative is to use a diffraction grating and flow cytometry. Unlike conventional fluorescent dyes, a linear detector array to obtain an actual emission spectrum. 55 up-converting phosphors possess the distinct advantage of FIG. 31A is an illustration of an embodiment of the not requiring excitation illumination in wavelength ranges invention in which a diode laser array F1 and a detector (e.g. UV) that damage genetic material and cells. Typically, array F2 are combined in a single device. In the preferred up-converting phosphor labels are attached to a binding embodiment. arrays F1 and F2 are fabricated on a pair of reagent. such as an antibody, that binds with high affinity and silicon chips F3 with array dimensions of approximately 1 specificity to a cell surface protein present on a subset of square centimeter. FIG. 31B is a detailed view of a small cells in a population of cells in suspension. The phosphor section of the device shown in FIG. 31A. Overlaying labeled binding component is contacted with the cell sus detector array F2 is a polymer film F4 of approximately 10 pension under binding conditions, so that cells having the to 25 micrometers thickness which is used as the capture cell surface protein bind to the labeled binding reagent, surface. Arrays F1 and F2 are separated by a spacer F5. 65 whereas cells lacking the cell surface protein do not sub Array F1 is comprised of Fabrey-Perot diode lasers, pref stantially bind to the labeled binding reagent. The suspended erably tuned to 980 nanometers. Lasers of this type are cells are passed across a sample detector under conditions
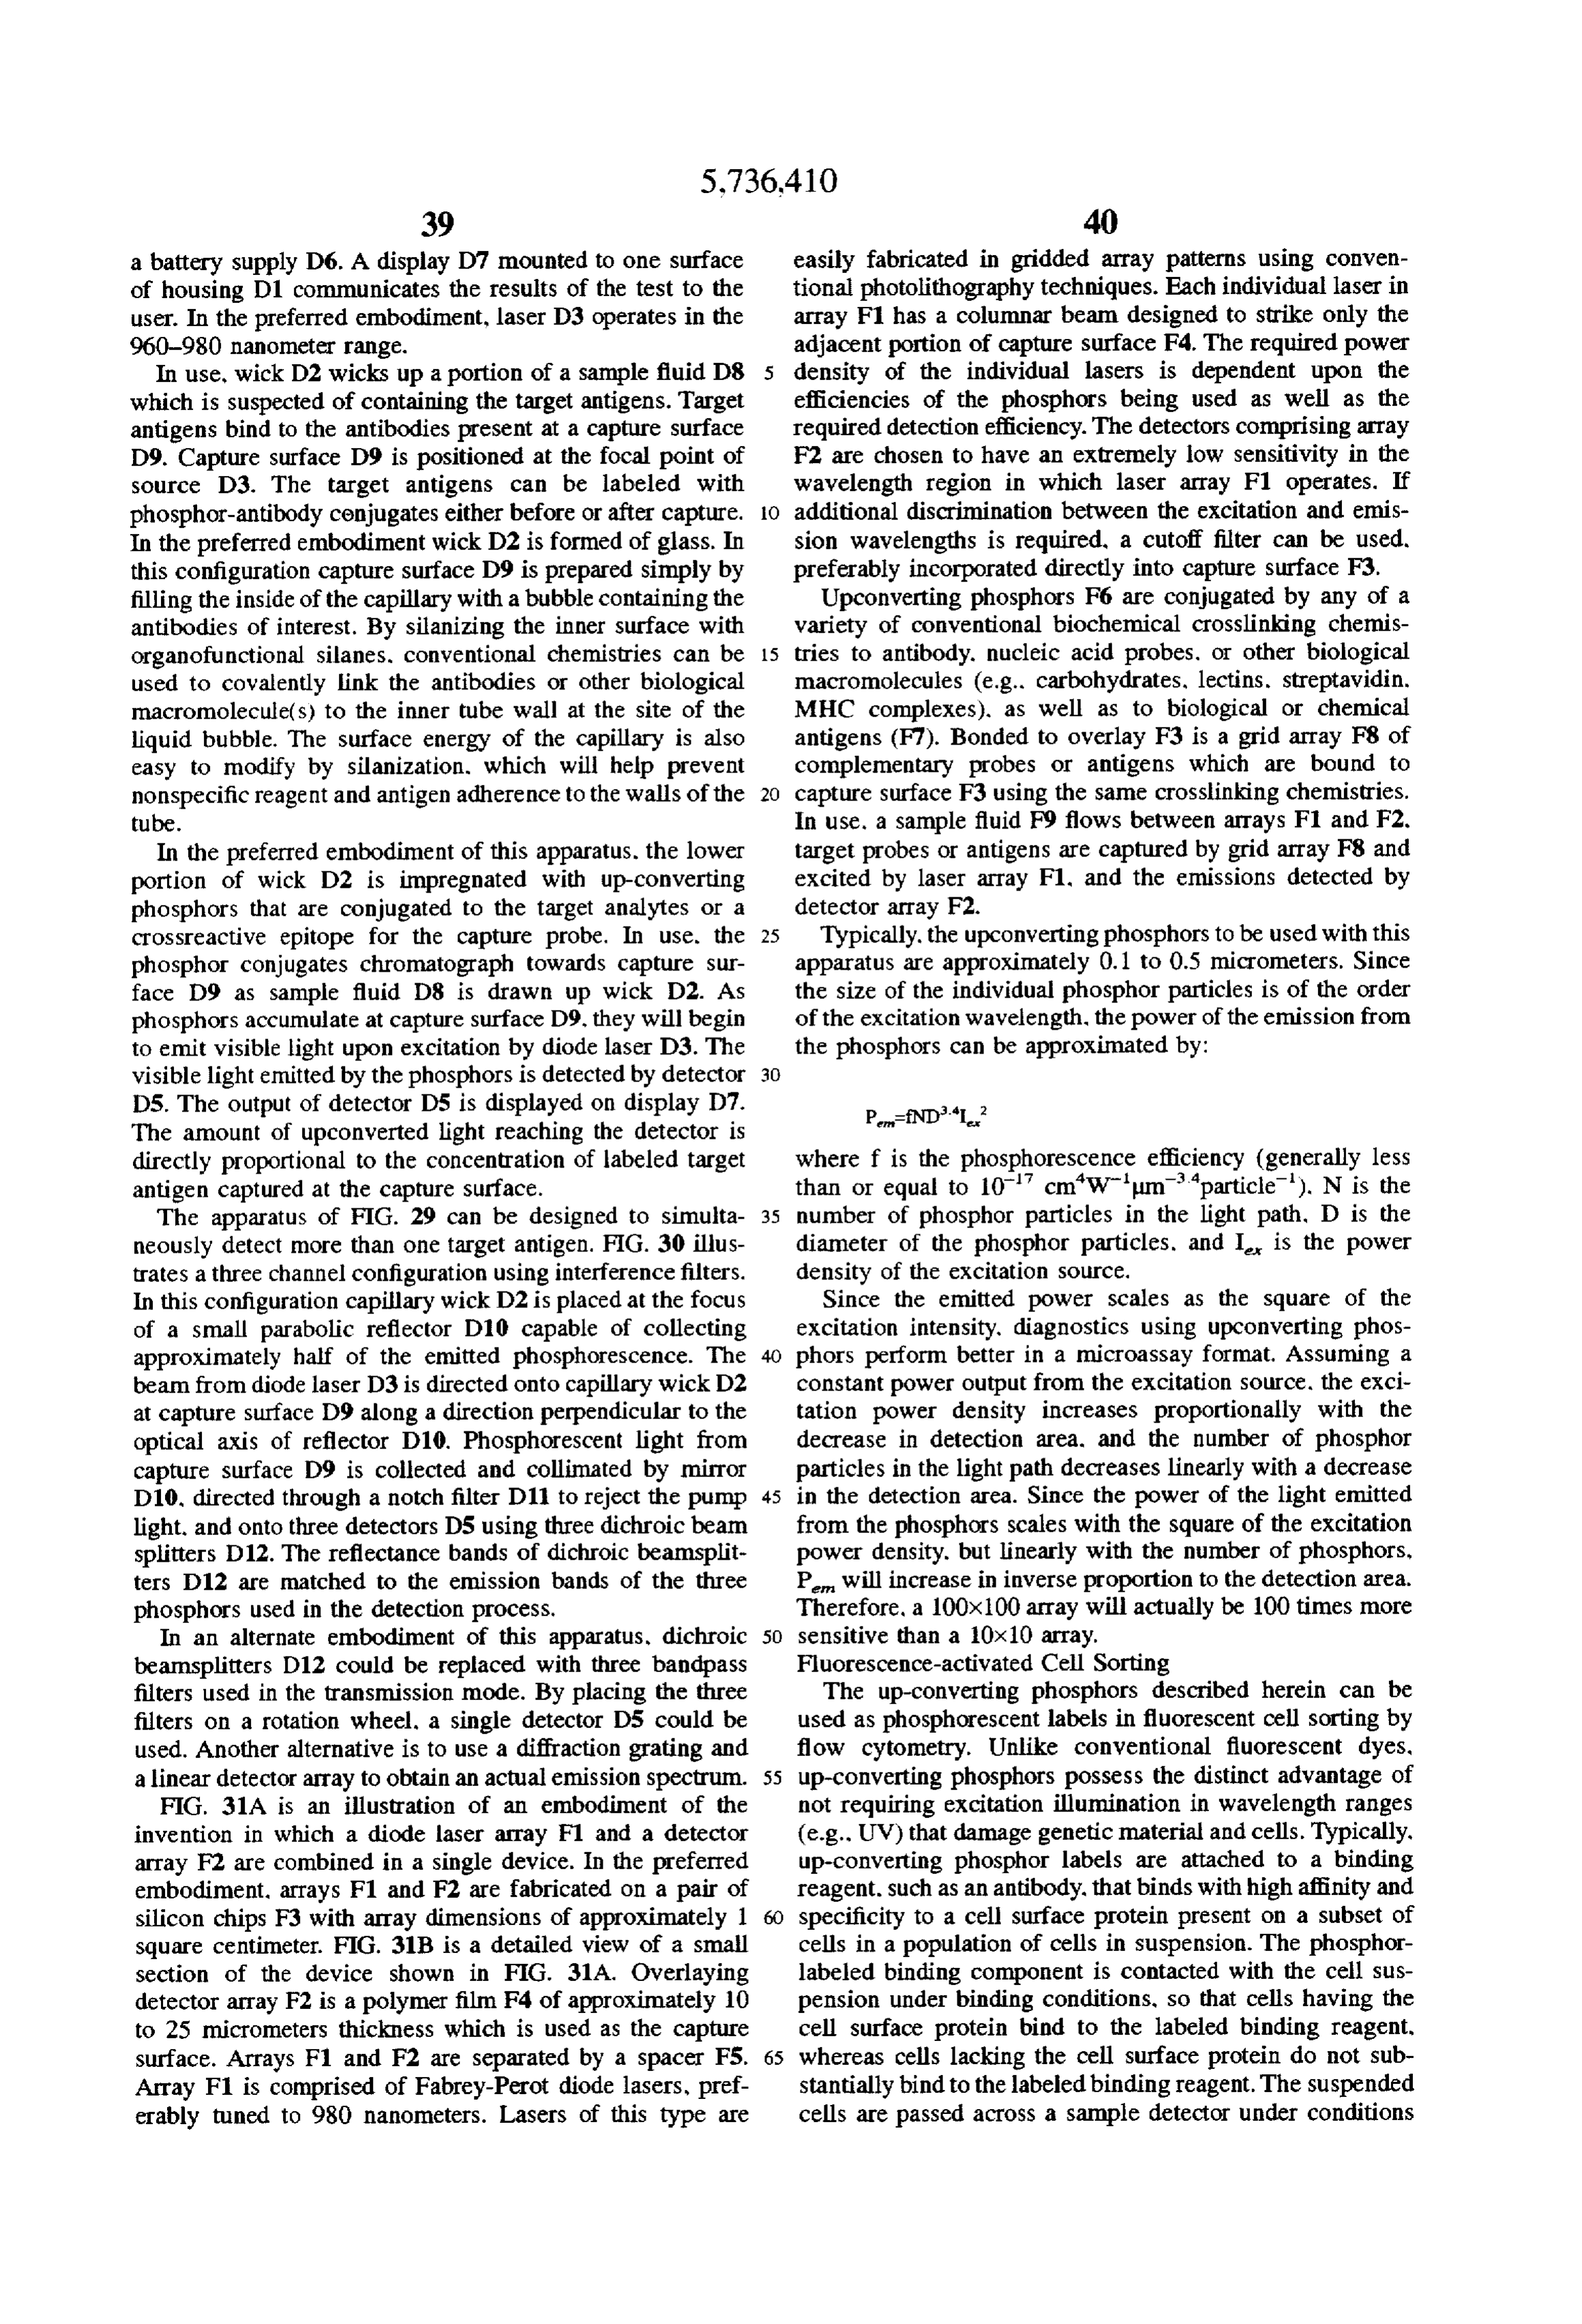
Page 58
wherein only about one individual cell is present in a sample Alternatively, these algorithms could examine the cumula detection zone at a time. A source. typically an IR laser, tive phosphorescence intensity (or rate of increase) for a illuminates each cell and a detector, typically a photomul given particle size and fluorescent label at a given upcon tiplier or photodiode, detects emitted radiation. The detector version color. For simplicity, FIG. 33 depicts the multi controls gating of the cell in the detection zone into one of 5 plexed detection of three different agents on 3 different sizes a plurality of sample collection regions on the basis of the of latex beads using a single spectral upconverting phosphor signal(s) detected. A general description of FACS apparatus color. The three alarms are easily discriminated from and methods in provided in U.S. Pat. Nos. 4.172.227; unbound phosphors, unbound latex capture beads, and by 4.347.935; 4,661,913; 4,667,830; 5,093,234: 5,094,940; and the latex particle size.
5.144.224, incorporated herein by reference. It is preferred 10 Phosphor-Based Flow Cytometer that up-converting phosphors used as labels for FACS meth It is possible to use the upconverting phosphors for flow ods have excitation range(s) (and preferably also emission cytometry; however, several equipment design issues related range(s)) which do not damage cells or genetic material; to the unique excitation and emission characteristics of these generally, radiation in the far red, and infrared ranges are phosphors must be addressed.
preferred for excitation. It is believed that radiation in the 15 Excitation Source. The first issue is the time required to range of 200 nm to 400 nm should be avoided, where reach maximum emission intensity (rise time). Upconver possible, and the wavelength range 760 nm to 765 nm may sion is a two photon process; that is, the energy must be be avoided in applications where maintenence of viable cells trapped from the first absorbed photon and pumped by the is desired. absorption of a second photon to result in the emission of a
FLOW CYTOMETER DETECTOR
20 single upconverted photon. Because of this phenomena.
upconverting phosphor emission is time-delayed about 100
The flow cytometer (FIG. 33) is well suited for active usec. The phosphor must remain within the beam of the biological BW agents (spores and cells) where size discrimi excitation source for at least 100 usec at all flow rates. nation of bound and unbound phosphors makes direct detec Assuming typical flow rates of 1 to 10 m/see in flow tion possible. For improved sample discrimination it is 25 cytometers and channel widths of 70 to 200 um, the length possible to couple conventional fluorescence-based flow of the excitation laser beam must be between 100 and 1000 cytometer detection (achieved using biological stains), as is im. Phosphor emission saturates at an excitation intensity of currenrfy being pursued for the Army BIDS system with about 200 W/cm. This means that the excitation source upconversion detection. This dual detection allows laser can emit at a power of between 0.01 and 400 mW to improved discrimination of phosphors bound to active bio- 30 achieve phosphor saturation.
logical agents from phosphors that may be adventiciously Detection. Since emission from the phosphors is in the bound to inactive aerosol particulates. visible spectrum. and the wavelength of the excitation Biotexins and chemical agents (for which antibodies are source (980.5 nm) is far removed from that of emission available) are likely to be present as discrete molecules in 35 (2800 nm). high sensitivity detection is easily accomplished solution and so are undifferentiatable from unbound phos with a photomultiplier tube (PMT), photodiode. or a CCD array that is shielded from the excitation beam with a cutoff phor particles. Detection of these small molecule analytes is filter.
possible using particulate capture surfaces (e.g. 1 to 5 um latex beads) to which the biotexins or nucleic acid targets There is no need for time resolved measurements when could be bound in a sandwich assay format using the using upconverting phosphors. This means that excitation phosphors. The use of fluorescently tagged latex particles and detection can be accomplished simultaneously and (up to 5 differenable colors) in conjunction with multiplexed continuously. This represents a major advantage over con phosphor detection (up to 20 spectrally unique colors) could ventional time-resolved detection systems. Diode array enable multiplexed real time simultaneous detection of up to detectors could also be used to take advantage of the 100 different analytes. Size discrimination in the latex beads 45 different wavelength emissions of different phosphor com (up to 3 differentiable sizes) could further increase the positions. A diode array detector would make it possible to multiplexing ability of the flow cytometer to 300 analytes. perform multiplexed assays. Such as accomplish cell sorting Conventional flow cytometers can be modified to allow based on more than one characteristic, simultaneously. With regard to up-converting phosphors, the phosphores detection of up-converting reporters (FIG. 33). Many efforts cence decay time is long at least compared to common UV arc currently underway to miniaturize conventional (size and fluorescent ultraviolet fluorescence based) flow cytometers. Flow 50 cence reporters such as fluorescein. The phosphores cytometerminiaturization is currently limited by the size of decay half life is about 300 usec. The most sensitive the ultraviolet excitation source. Since infrared diode lasers method of detection would be to integrate the signal mea are used for upconverting phosphor detection, a purely sured by the PMT. However, 99 percent detection of the upconverting flow cytometer can be readily miniaturized but 55 available phosphorescent signal requires that the phosphor only at the loss of some discrimination capability (i.e., from remain in the sight path of the detector for 5 times the 300 to less than 60 possible agents). The addition of an phosphorescence decay half-life, or 1.5 m.sec. It is possible to sacrifice some detection sensitivity by upconverting detection capability into current flow cytom reducing the detection path length, at least to that required eters should not significantly affect current miniaturization to attain steady-state emission from the phosphors-that is, efforts.
Flow cytometer alarm algorithms can be based on the by 0.1 cm. As long as a steady-state emission peak is reached detection of a defined number of particles that exhibit: the phosphor in the excitation window, the peak signal received by the PMT should be directly proportional to the
O A particular size (up to 3 multiplex dimensions). concentration of phosphors present. The non O A particular upconverting phosphorescence spectral photobleaching property of the phosphors makes this form signature (up to 20 multiplex dimensions). 65 of detection possible. The loss in detection sensitivity cor O A particular UV fluorescence spectral signature (up to responding to a 0.1 cm detection path (vs. 1.5 cm) should 5 multiplex dimensions). only be about a factor of 3. Triggering of the emission
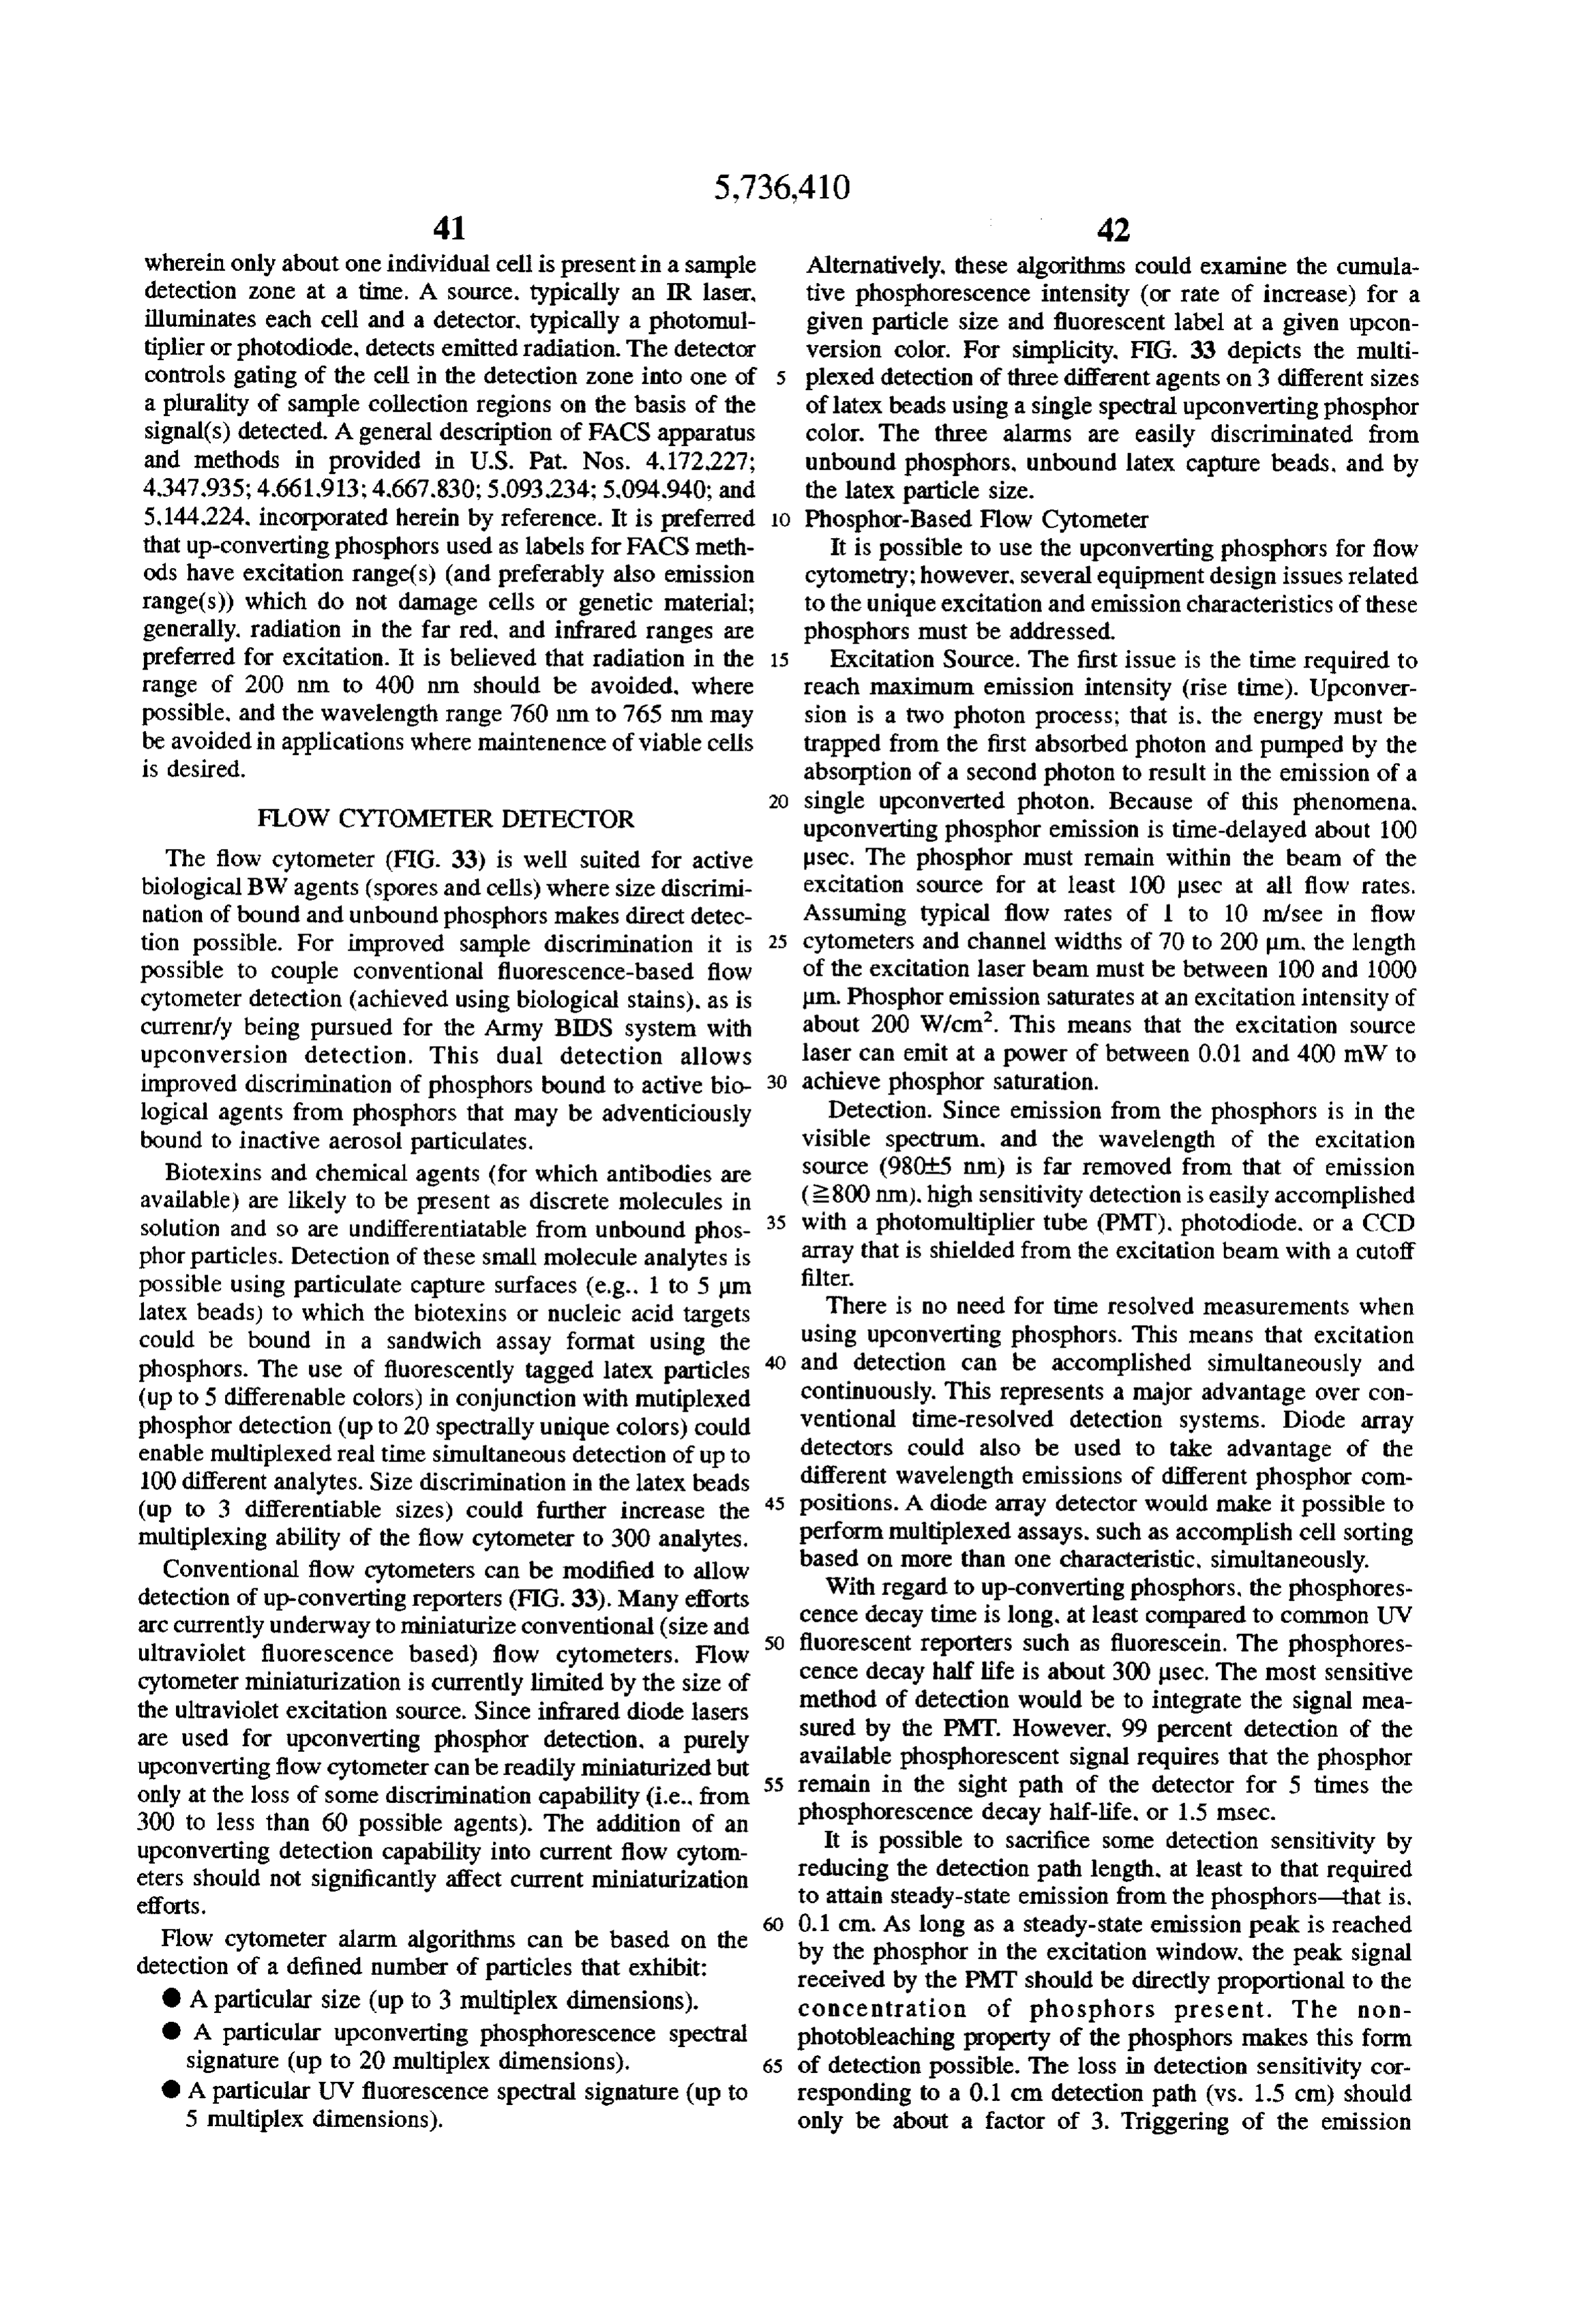
Page 59
detector could be accomplished by observing the light coated with a fluorescent dye or combination of dyes, in scattered by the cell as it passes through the excitation laser selected proportions, which absorb at the up-converted fre using a silicon photodiode. quency and subsequently re-radiate at other wavelengths. The phosphor-based assay design for the flow-cytometer Because the single-photon absorption cross-sections for provides for both forward scatter detection (particle size these fluors are typically very high, only a thin layer is infonation) at 980 nm and phosphorescence detection (6 required for complete absorption of the phosphor emission. phosphor tags). Phosphorescence detection will use either This coat particle may then be encapsulated and coated in a the spectroscopic or non-dispersed filtered designs. suitable antigen or antibody receptor (e.g. microparticle). An FIGS. 34A and 34B show a fluorescence-based flow example of this layering is depicted schematically in FIG. 9. cytometer modified for simultaneously assaying particle size 10 There exists a wide variety of fluorescent dyes with strong (forward scatter detector) and phosphorescence (phosphorescence detector), as compared to the conven absorption transitions in the visible, and their emission tional particle detection and fluorescence detection. Such covers the visible range and extends into the infrared. Most have fluorescent efficiencies of 10% or more. In this manner, modifications permit flow cytometry and are compatible the emission wavelengths may be custom-tailored to pass with multiplexed assays. 5 through the particle's environment. and optical interference Additional Variations
There are several apparatus design issues relating to the filters may again used to distinguish between excitation and unique excitation and emission characteristics of upconvert emission wavelengths. If a relatively large wavelength "win ing phosphors which must be considered when using dow" in the test medium exists, then the variety of emission up-converting phosphors with flow cytometry. The first wavelengths which may be coated on a single type of issue is the time required to reach maximum emission phosphor is limited only by the number of available dyes and intensity. Since upconversion is a two photon process, dye combinations. Discrimination between various reporters upconverting phosphor emission is time delayed approxi is then readily carried out using the spectroscopic and mately 100 microseconds. The phosphor must remain within multiplexing techniques described herein. Thus, the number the excitation beam for this period of time regardless of the of probe/reporter "fingerprints" which may be devised and flow rate. Therefore given a flow rate between 1 and 10 25 used in a heterogenous mixture of multiple targets is virtu meters per second with a channel width of 70 to 200 ally unlimited.
micrometers, the length of the excitation beam must be The principles described above may also be adapted to between 100 and 1000 micrometers. Given that the phos driving species-specific photocatalytic and photochemical phor emissions saturate at an excitation intensity of about reactions. In addition to spectroscopic selection, the long 200 watts per square centimeter, the laser source typically emission decay times of the phosphors permit relatively must have a power between 0.01 and 400 milliwatts to slow reactions or series of reactions to take place within the achieve phosphor saturation. This implies that multiple laser emission following photoexposure. This is especially useful diodes may be required to obtain maximum phosphores when the phosphor-catalyst or reactant conjugate enters an cence at the fastest flow rates. environment through which the excitation wavelength can Another design issue is that associated with the detector. 35 not penetrate. This slow release also increases the probabil Since there is a considerable separation between the exci ity that more targets will interact with the particle. tation and emission wavelengths of the up-converting The unique decay rates of phosphor particles allow phosphors, detection can be performed using a photomulti dynamic studies as well. In a system where continuous pler tube (PMT), a photodiode, or a CCD array. The phos exposure to the excitation source is not possible, or is phorescence decay time is long with a decay half life of 40 invasive and thereby undesirable, pulsed excitation followed approximately 300 microseconds. The most sensitive by delayed fluorescence detection is necessary. After the method of detection is to integrate the signal measured by phosphor reporter has been photoexcited, the subsequent the PMT. However, 99 percent detection of the available emission from the phosphor or phosphor/dye conjugate phosphorescent signal requires that the phosphor remain in particle lasts typically about a millisecond. In a dynamic the sight path of the detector for 5 times the phosphores 45 environment, such as a static or flowing system with moving cence decay half-life (i.e. 1.5 milliseconds). Assuming a targets. the particle will emit a characteristically decaying flow rate of 10 meters per second and a channel width of 200 intensity of light as it travels relative to the excitation/ micrometers, the PMT must be able to detect over a path detection apparatus. Combined with imaging optics appro length of 1.5 centimeters. This path length is also the priate to the scale of the system and the velocities within the required spacing between cells flowing through the 50 system, a CCD photoelectric sensor array will be used to cytometer, implying a maximum count rate of 667 cells per detect the particle or particles movement across the array's second. It is, however, possible to sacrifice some detection field of view. The delayed emission of the phosphors, which sensitivity by reducing the detection path length, at least to is a well-characterized function of time, makes possible the that required to attain steady-state emission from the phos dynamic tracking of individual particle's positions, direc phors. As long as a steady-state emission peak is reached by 55 tions and velocities, and optionally calculation of particle the phosphor in the excitation window, the peak signal size, density, and hydrodynamic conformation. As a particle received by the PMT should be directly proportional to the moves, it exposes more elements of the array, but with concentration of phosphors present. The nonphotobleaching every-decreasing intensity. The more elements it exposes property of the phosphors makes this form of detection over a certain fraction of its decay time. the faster it is possible. The loss in detection sensitivity corresponding to a moving. Therefore, the integrated intensity pattern of a 0.1 centimeter path length (versus a 1.5 centimeter path particle's emission “track" collected by the array is directly length) is approximately a factor of 3. Triggering the emis related to the velocity of the particle. The particles may be sion detector can be accomplished by observing the light refreshed again at any time by the pulsed or chopped CW scattered by the cell as it passes through the excitation excitation source. FIG. 10 illustrates this scheme. Although SOCC. 65 only a depiction of "side-on" excitation and detection is In environments where absorption of the up-converted shown, both side-on and end-on detection and excitation phosphor radiation is high, the phosphor microparticles are arrangements, or combinations, are possible. Reduction of
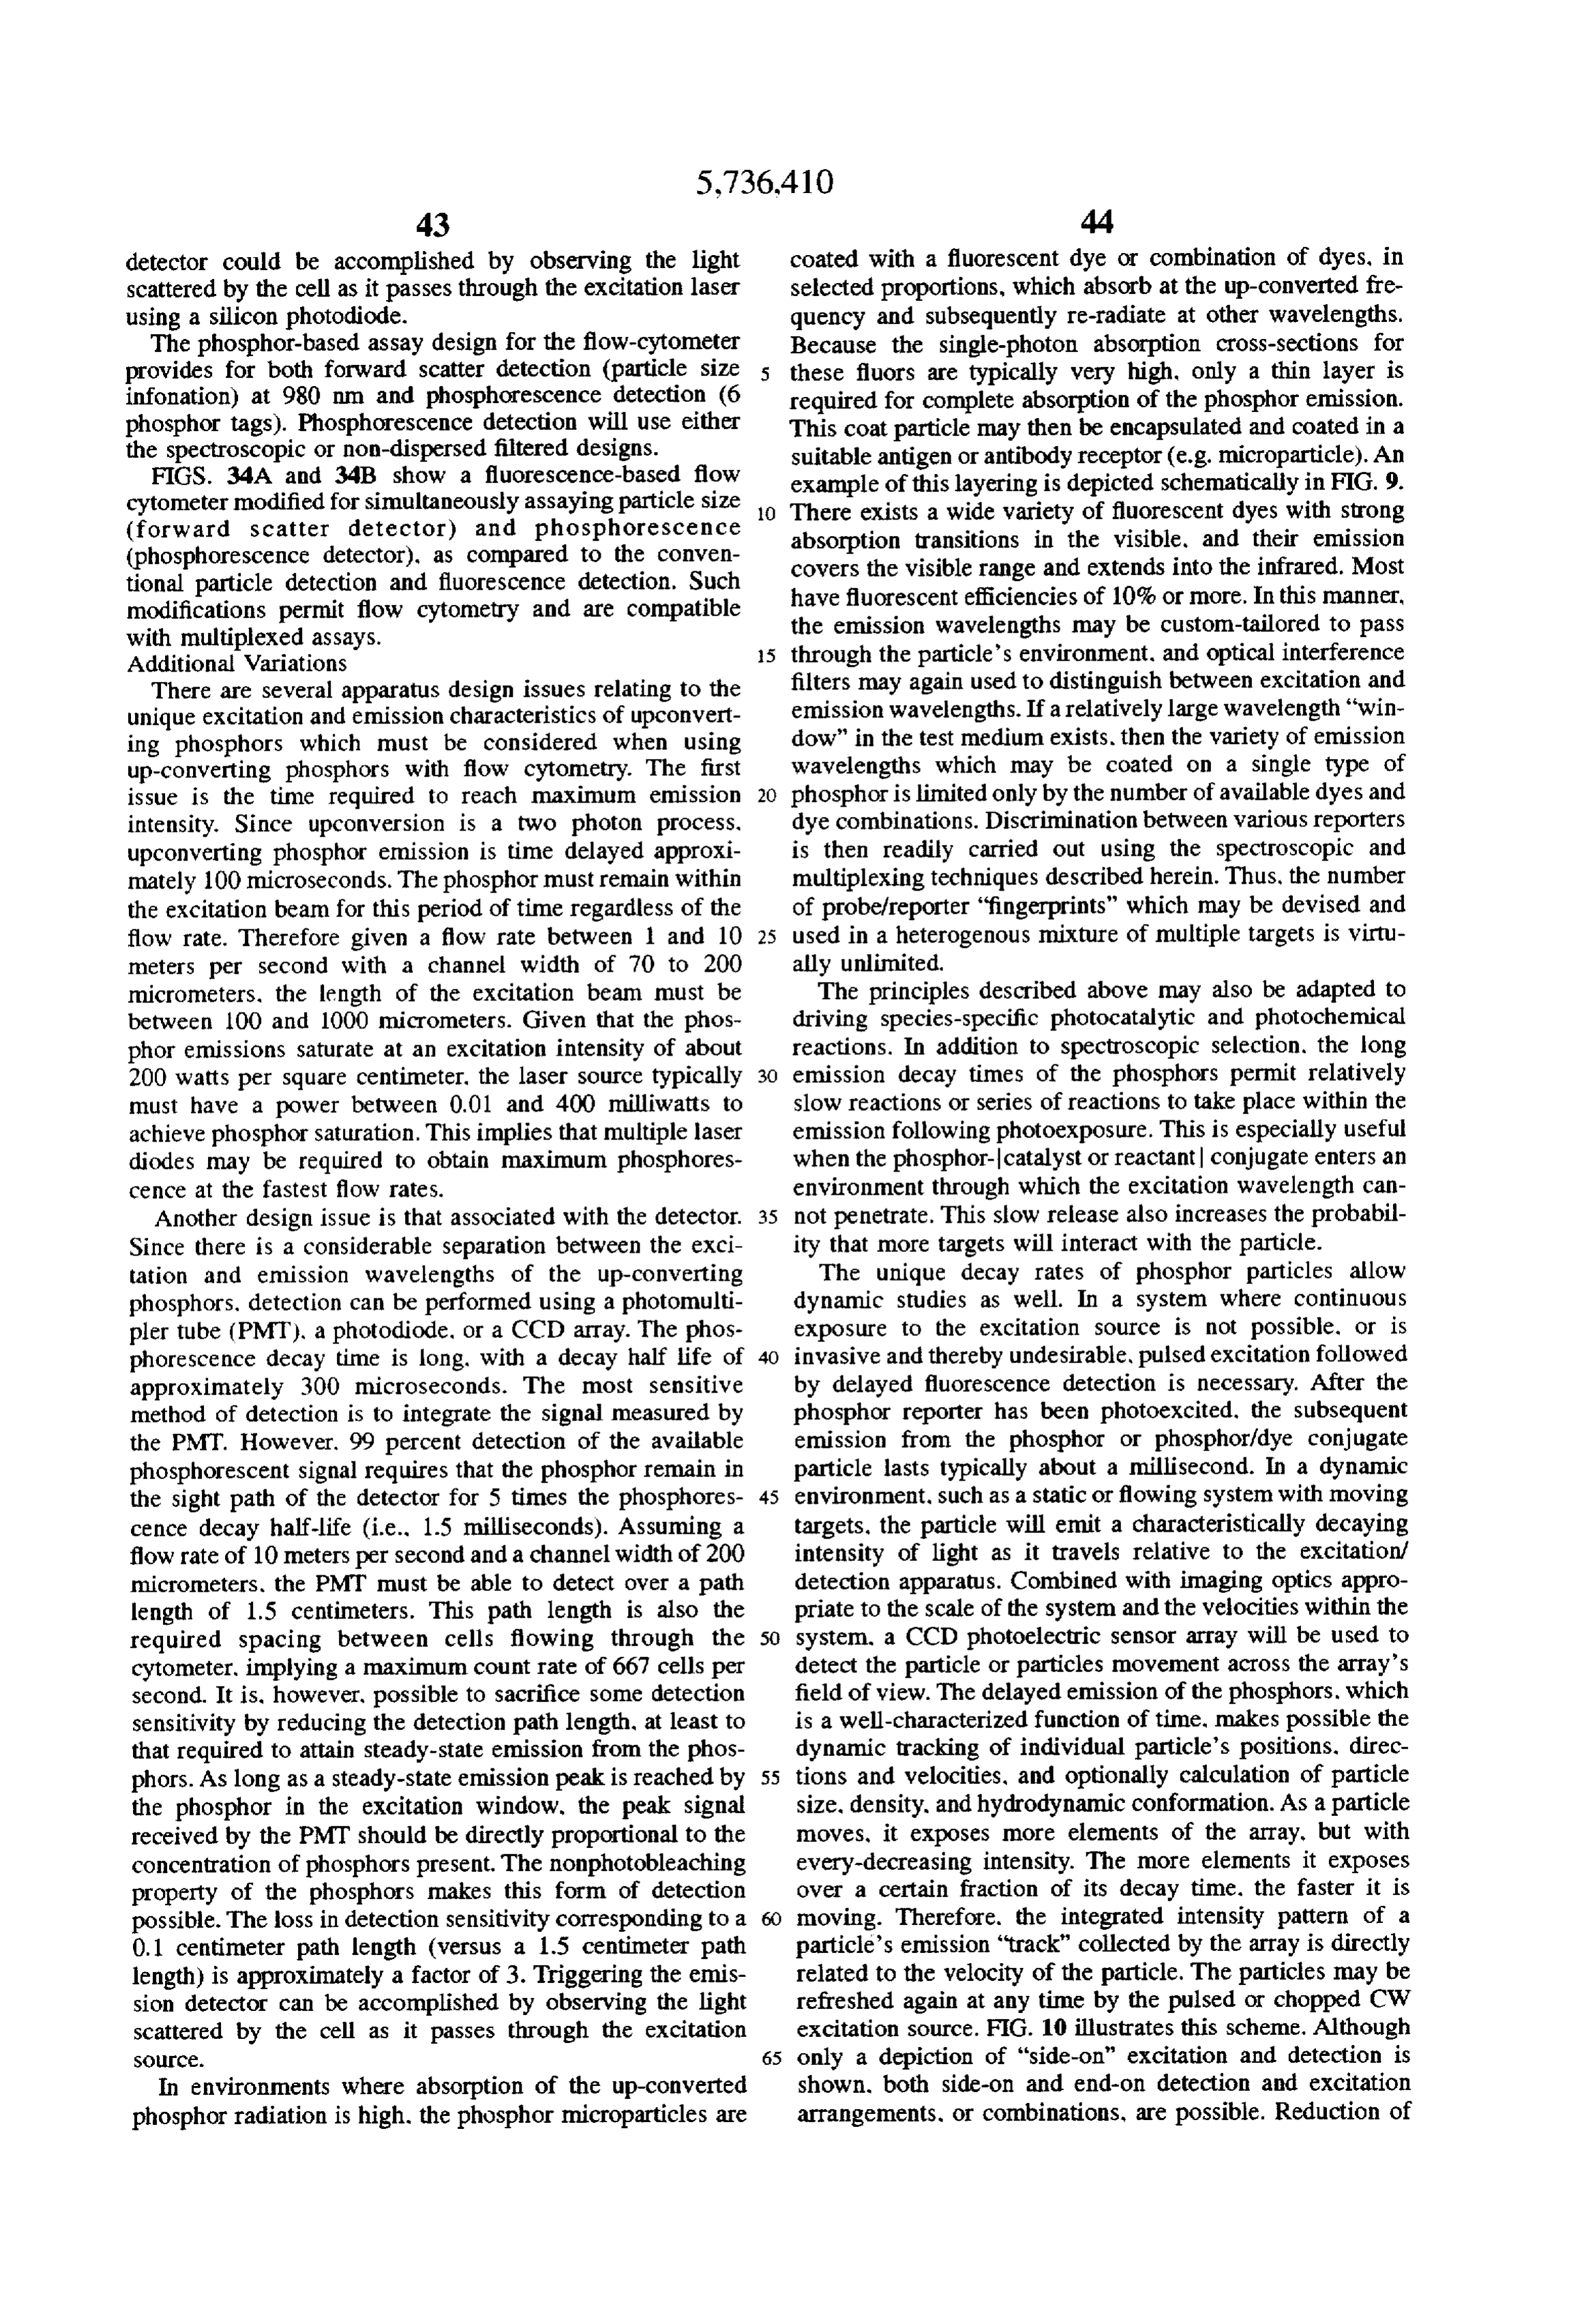
Page 60
the CCD array intensity information by computer analysis about 977 nm. FIG. 13 is a time-decay measurement of the will allow near-real time tracking of the particles in a phosphor luminescence at 541.0 nm after termination of dynamically evolving or living systems. Data analysis and excitation illumination; maximal phosphorescence appears reduction performed by the computer would include a at approximately 400 us with a gradual decay to a lower. convolution of the intrinsic decay of the phosphor emission, stable level of phosphorescence at about 1000 us. FIG. 14 the number of pixels illuminated and their signal level, the shows the phosphor emission intensity as a function of orientation of the decaying signal on the array, and the excitation illumination intensity; phosphorescence intensity intensity contributions from a blur circle from particles increases with excitation intensity up to almost about 1000 moving in and out of the focal plane of the array. In an Wilcm.
end-on flow detection arrangement, the size of the blur circle O Phosphorescence efficiencies of submicron would relate directly to how quickly the particle moves out Na(YoYbo. Eroos)f particles were measured. A Ti:sap of focus, thereby allowing the velocity of the particle to be phire laser was used as an excitation source and a spectro determined. One possible application would be monitoring photometer and photomultiplier was used as a detection the chemistry and kinetics in a reaction column. system. Two types of measurement were performed. The alternatively, the application of this method to flow cytom 15 first was a direct measurement in which the absolute emis etry may permit the resolution of cells on the basis of sion per particle for phosphor suspensions was measured in hydrodynamic properties (size, shape. density). The method emission bands at 540 nm and 660 nm, The calibrated may also be useful for in vivo diagnostic applications (e.g., cross-sections are shown in FIG. 15. and size-dependence is blood perfusion rate). shown graphically in FIG. 16. This corresponded to a Up-converting phosphor labels may also be used to sense 20 phosphorescence cross-section of approximately 1x10' the temperature in the region at which the up-converting cm for 0.3 um particles with excitation light at 975 nm and phophor label is bound. Up-converting phosphor tempera an intensity of approximately 20 W/cm. The emission ture measurement methods are described in Berthou H and efficiency of dry phosphor powder of about 25 um was also Jorgensen CK (October, 1990) Optics Lett. 15(19): 1100, measured. On the basis of known values for the absorption incorporated herein by reference. cross-section of Yb" in crystalline hosts (Lacovara et al. Although the present invention has been described in 25 (1991) Op. Lett. 16: 1089, incorporated herein by reference) some detail by way of illustration for purposes of clarity of and the measured dependence of the phosphorescence emis understanding, it will be apparent that certain changes and sion on particle size. a phosphorescence cross-section of modifications may be practiced within the scope of the approximately 1x10 cm was found. The difference claims.
between these two measurements may be due to a difference
The broad scope of this invention is best understood with in phosphorescence efficiency between dry phosphor and reference to the following examples, which are not intended aqueous suspensions, or due to absorption of multiply scat to limit the invention in any manner. tered photons in the dry phosphor. On the basis of either of
EXPERIMENTAL EXAMPLES
these cross-section estimates, the cross-section is sufficiently large to allow detection of single submicron phosphor par
Validation of Up-Converting Inorganic Phosphors as 35 ticles at moderate laser intensities. At laser intensities of Reporters roughly 10 Wicm. the phosphorescence scales as the laser Up-converting phosphor particles comprising sodium intensity to the 1.5 power.
yttrium fluoride doped with ytterbium-erbium were milled to Phosphor Particle Performance: Sensitivity of Detection submicron size, fractionated by particle size. and coated A series of Terasaki plates containing serial dilutions of with polycarboxylic acid. Na(YoYboEroo)F was cho monodisperse 0.3 um up-converting phosphor particles con sen for its high efficiency upon excitation in the range 940 sisting of (Yoss YboosBroos)2O2S were tested for to 960 nm. A Nd:Yagpumped dye laser/IR dye combination up-conversion fluorescence under IR diode laser illumina was used to generate 8-ns to 10-ns duration pulses in the tion in a prototype instrument.
above frequency range. The phosphor particles were prepared by settling in The laser pulses were used to illuminate a suspension of 45 DMSO and were serially diluted into a 0.1% aqueous gum milled phosphor particles in liquid and attached to glass arabic solution. This appeared to completely eliminate any slides in situ. The suspension luminescence observed at right water dispersion problems. The serial dilutions used are angles was monitored using a collection lens, a spatial filter listed in Table II.
in order to filter out scattered excitation light to the maxi mum possible extent, and a photomultiplier, vacuum 50 TABLE photodiode, or simple solid state photodiode (depending on the light level observed). Equivalent The luminescent signal level was determined as a function Phosphor Phosphor Detection of solution pH (range: 6-8), grain size, particle loading Label (ng?well) Loading Loading Sensitivity
(ug/cm), and the nature of stabilizing anionic surfactant. 55
Signals were recorded both as a time integral from a boxcar Oo
integrator and from a long RC time constant or as a transient 10-2 170.9 236,000 it 12,000 4 x 10' signal using a transient digitizer in order to delineate the 103 1.7 0.09 23,600 + 1,200 4.10 luminescence lifetime under particular experimental condi 10-4 0.170 0009 2,360 it 120 4 x 10-16 tions. In situ signals were also measured by laser scanning 10-5 0.017 t 0.0009 236 t 12 4 x 10¹⁷ microscopy. FIG. 11 is a fluorescence scan of the phosphor 10 00017 t 0.00009 23.6 t 1.2 4 x 10" emission spectrum incident to excitation with a laser source at a wavelength maximum of 977.2 mm; emission maximum The stock DMSO dispersion had a phosphor density of is about 541.0 nm. FIG, 12 is an excitation scan of the 1.70+0.09 mg/mL (at 95% confidence limits), determined phosphor excitation spectrum. with emission collection win 65 gravimetrically by evaporating 4-1 mL samples. This trans dow set at 541.0 nmi; excitation maximum for the phosphor lates to 23.6x10 particles/mL (assuming an average particle at the 541.0 nm, emission wavelength is approximately size of 0.3 um and particle density of 5.3 g/mL). The residue
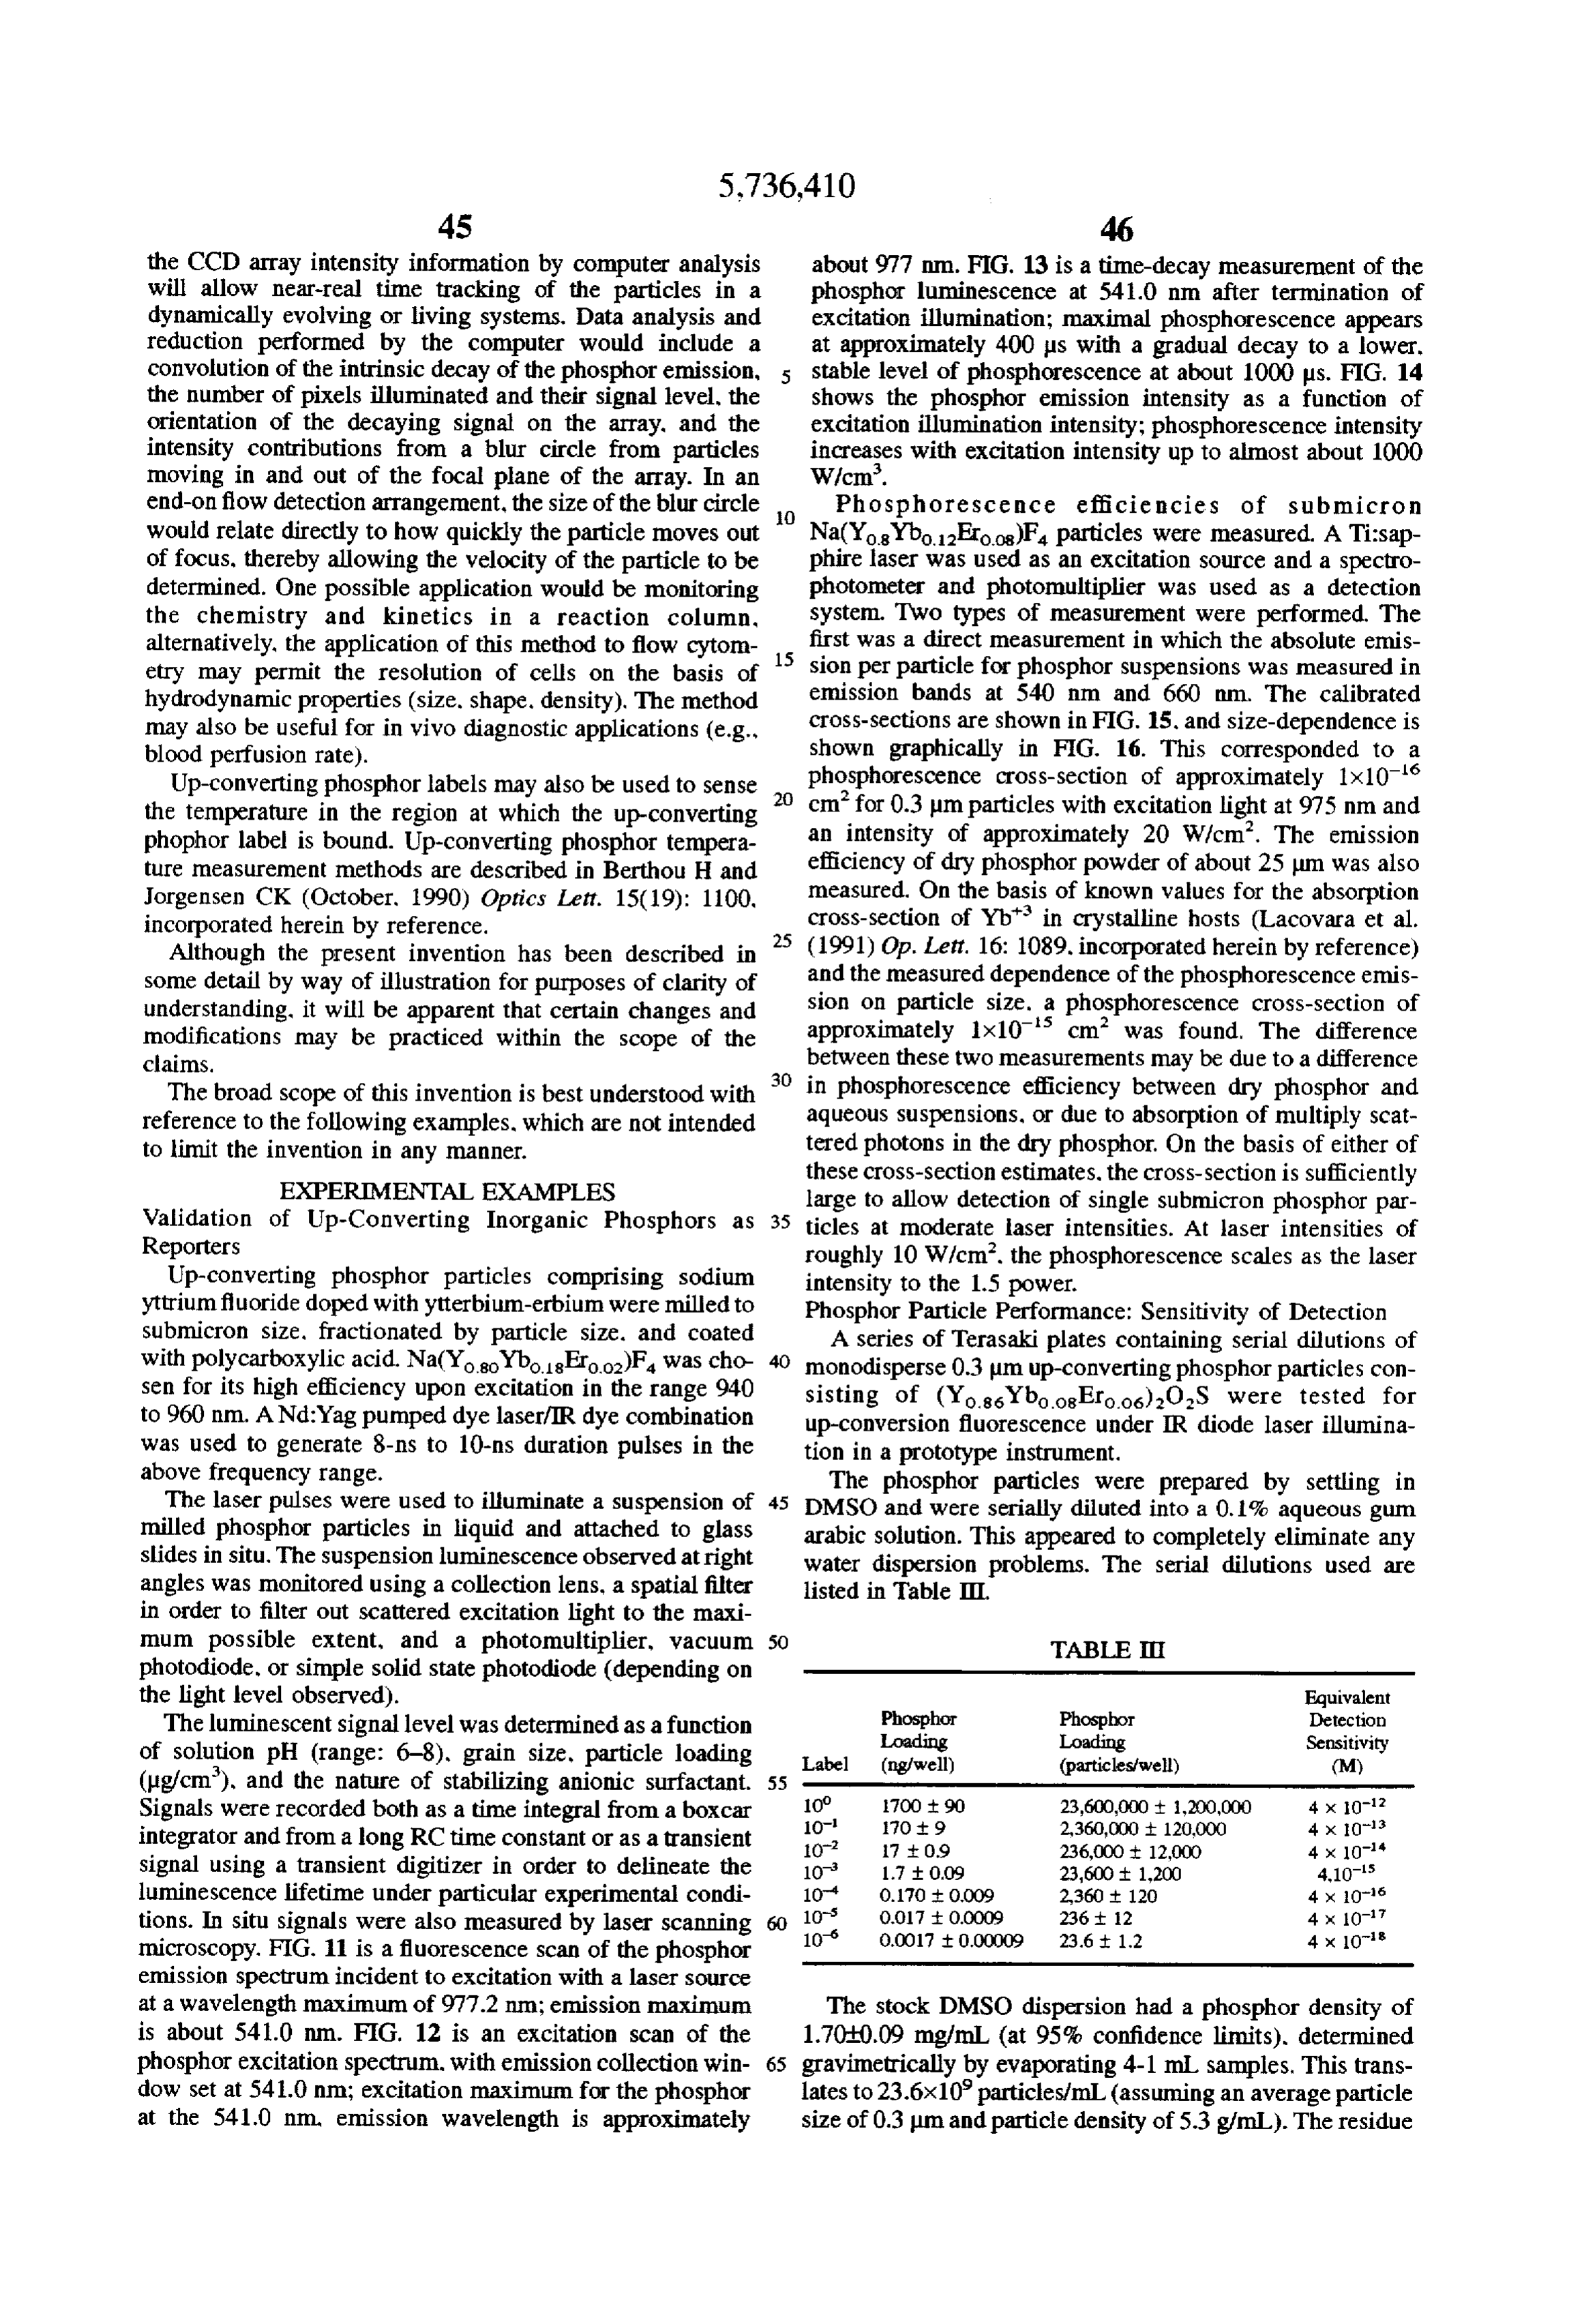
Page 61
after evaporating the samples over the weekend at Six wells (C5, C6, C7, D5, D6, and D7) of a clear 110°-120° C. was noticeably yellow, but did phosphoresce polystyrene Terasaki plate were coated with mouse IgG by when tested with an IR diode laser. incubating at 37° C. against 5 L of a 100 g/L mouse IgG Visual green light emanated from all serial dilutions down solution in phosphate buffered saline (PBS). After 1 h. this to 10 (i.e. 1.7 pg/mL or 23.6x10' particles/mL) in a 1 mL solution was aspirated off and each sample well was washed polypropylene microfuge tube using a hand-held diode laser with 10 L of 3% BSA in PBS. This was immediately in a dark room. The 10' and 10 dilutions were visibly aspirated off and replaced with 20 pull of 3% BSA in PBS. cloudy. Either 1 ul of each serial dilution, or 0.1 ul of the against the 20well
Each sample was post-coated with BSA by incubating pil of BSA/PBS solution for 1 h at 37°C. The next higher dilution, were pipetted into a well on the Terisaki post-coat solution was aspirated off and the plates stored at plate. It was found that 1 ul fills the bottom of the well and 10 4° C. overnight. These wells were considered in positive 0.1 ul spreads along the edge of the well, but does not cover samples. The same six wells in a second Terasaki plate were the entire surface. Because of the statistical and pipetting prepared in an identical fashion, except they were not coated problems associated with small volumes with low particle with mouse IgG. This second set of sample wells were concentrations. 2 to 4 replicates were prepared of each considered negative controls.
dilution. 15 Phosphor-Antibody Conjugate
The well of a Terasaki plate holds a 10 ul sample volume. A solution of (YosYbooseroos)2O2S phosphor particles Assuming all the phosphor particles contained in this vol was prepared by suspending the dry phosphors into DMSO. ume adhere to the bottom of the sample well, we can The initial particle density was approximately 10 particles/ estimate an equivalent detection sensitivity (Table III). It mL as determined by counting the number of particles should be noted that 10' to 10' M is the normal range contained in the field of an optical microscope. It should be of enzyme-linked surface assays. noted that the 0.3 um fundamental particle size was below Control Sample Results the resolution limits of the microscope. This solution was The control samples were scanned using a prototype allowed to settle undisturbed for 3 days. The supernatant. up-conversion fluorimeter device (David Sarnoff Research which was turbid and presumably contained mostly mono disperse smaller particles was used for subsequent conjuga
Center). The samples were scanned by moving the plate in 25 tion.
50 pum increments. using a motorized X-Y positioning stage, Goat anti-mouse IgG antibody (Ab) was conjugated (by relative to the focal point of an infrared diode laser, adsorption) the DMSO fractionated phosphor particles. This The IR diode laser was operated at 63 mW (100 mA). The was done by mixing 200 ul of the Absolution (in 0.1M beam was focused to 2.4x10 cm at the focal point. As the 30 Tris-HCl, bottom of the sample well is about 1.4x10 cm (1365um in DMSO.pH 7.2) with 100 L of the phosphor suspension Several different Ab concentrations were tried in diameter), the beam covers less than 17% of the well bottom the range of 0.025 to 1 ug/L. A concentration of 0.25 ugful surface at any individual position. The well also has sloping appeared to result in the most efficient coating (i.e., maxi side walls which widen from bottom to top of the sample mum Ab utilization with a minimum of clumping of the well and are also interrogated by a progressively divergent phosphor particles). The phosphors were equilibrated over laser beam. Neglecting losses in the optics, the IR light 35 night at room temperature with the Ab in this DMSO/Tris intensity at the focal point (bottom of the sample well) was solution with gentle agitation. The resulting phosphor-Ab approximately 26–27 Wlcm at 980 nm wavelength. A conjugates were centrifuged from this solution and resus photomultipler tube (PMT) was used for detection of the pended in a 3 g/mL BSA solution in PBS for post-coating. visible (upconverted) light emitted from the sample. Since The resulting BSA/PSA resuspension was used directly for the laser beam width was Smaller than the surface area at the the assay.
bottom of the sample well, the plate was aligned by visual The degree of Ab adsorption to the phosphors, and residual Ab activity, was determined by titrating the inspection against the focal point of the diode laser so that phosphor-bound the laser was centered in the middle well (C6 when reading (FTTC) conjugated-mouse Ab with a fluorescein isothiocyanate wells C5. C6 and C7, and D6 when reading wells D5, D6, phosphors were passed through IgG. The resulting FTTC-labeled and D7). 45 a Cyteron Absolute flow cytometer, which was also
The PMT signal (amps) was recorded at each plate size of the particles. Two distinct size capable of measuring the relative position and numerically integrated over the width of the observed subpopulations were with about 65% of the sample well (approximately 4000 um). Several scans were as small, presumably monodisperse particles, counted particles appearing and 35% being made at different positions in the 10° to 10° dilution sample significantly larger, presumably aggregates. Only 60% of the wells to determine the uniformity of the particle distribution. smaller subpopulation appeared to have significant quanti
The background signal was determined by integrating the ties of active Ab (determined by FITC fluorescence). Of the average dark field current of the PMT over a 4000 um purported aggregates, about 90% appeared to contain active distance, which yields an integrated background signal of Ab (by FITC fluorescence). This suggests that less than 40% 1x10 ua-m. The integration products of the samples wells of the phosphor-Ab conjugates were of an appropriate size were scaled to this background signal, and are shown in FIG. 55 (nominal 0.3 m) and exhibited anti-mouse IgG activity. A 19. similar fraction of phosphor-Ab conjugates (31%) were active but carried a significantly larger phosphor reporter.
Immunodiagnostic Sample Detection The PMT signal (amps) was recorded at each plate A series of IgG/anti-IgG samples for demonstrating the position and numerically integrated over the width of the capabilities of the up-converting phosphor reporters in a sample well (approximately 4000 um). The average signals immunosorbant assay format was prepared. These samples (with 95% confidence limits) are:
consisted of six individual wells (positive samples) coated Average of Positive Samples=130x10-1.25x10 ua-m with antigen (mouse IgG) and bovine serum albumin (BSA). Average of Negative Controls=4.20x10+6.82x10 a-m and six wells coated with BSA alone (negative controls). The positive samples and negative controls are statistically Nominal 0.3 um (Yoss Ybooseroos)2O2S phosphor particles 65 different at the 99.9% confidence level. The positive samples coated with goat anti-mouse IgG antibody (anti-IgG) were emit on average 30.0+29.7 times more light than the nega then used as the reporter-antibody conjugate. tive controls.
Page 62
Linkage of Phosphors to Biological Macromolecules EL-4, is probed with a hamster anti-CD3 antibody which In order to delineate further the parameters for specifically binds to the 30 kD cell surface EL-4 CD3 T up-converting phosphors as biochemical reporters, biologi lymphocyte differentiation antigen. The primary hamster cal linkers were attached to phosphor particles. Sodium yttrium fluoride-ytterbium/erbium phosphor particles were antibody is then specifically bound by a biotinylated goat antihamster secondary antibody. The biotinylated secondary coated with streptavidin. The excitation and emission spec antibody is then detected with the streptavidin-phosphor tral properties of the phosphor alone and the phosphor conjugate.
coated with streptavidin were measured (FIGS. 17A, 17B. labeling is This type of multiple antibody attachment and termed antibody layering.
18A and 18B) and both the uncoated and streptavidin Addition of multiple layers (e.g., binding the primary coated phosphors were almost identical in their absorption O hamster Ab with a goat-antihamster Ab, followed by binding and emission properties, indicating that the attachment of with a biotinylated rabbit-antigoat Ab) are used to increase macromolecular linkers (e.g. proteins) have little if any effect on the phosphorescent properties of the up-converting the distance separating the phosphor from the target. The phosphor. The streptavidin-coated phosphors were then spe layering effect on signal intensity and target detection speci cifically bound to biotinylated magnetic beads, demonstrat 5 ficity is calibrated and optimized for the individual applica ing the applicability of linker-conjugated inorganic phos tion by performing layer antibody layering from one layer phors as reporters in biochemical assays, such as (primary antibody is biotinylated) to at least five layers and immunoassays, immunohistochemistry, nucleic acid ascertaining the optimal number of layers for detecting CD3 hybridizations, and other assays. Magnetic bead technology on EL-4 cells.
allows for the easy separation of biotin-bound streptavidin FIG. 21 schematically portrays simultaneous detection of coated phosphor from a solution, and is particularly well 20 two EL-4 cell surface antigens using phosphors which can suited for sandwich assays wherein the magnetic bead is the be distinguished on the basis of excitation and/or emission solid substrate. spectra. Detection of both antigens in the scheme shown in Advantageously, streptavidin-biotin chemistry is widely FIG. 21 uses a biotinylated terminal antibody which is used in a variety of biological assays. for which conjugated to streptavidin-coated phosphor (#1 or #2) prior up-converting phosphor reporters are suited. FIG. 20 shows 25 to incubation with the Ab-layered sample. Thus, the Schematically, for example and not limitation, one embodi phosphor-antibody specificity is retained through the unusu ment of an immunoassay for detecting an analyte in a ally strong (K approx. 1x10" M') non-covalent bond solution by binding the analyte (e.g. an antigen target) to a between streptavidin and biotin which is pre-formed before biotinylated antibody, wherein the analyte forms a sandwich incubation with the primary antibody-bound sample. Quan complex immobilized on a solid substrate (e.g. a magnetic titation of each antigen is accomplished by detecting the bead) by linking a first binding component bound directly to distinct signal(s) attributable to each individual phosphor the solid substrate to a second binding component (e.g., the species. Phosphorescent signals can be distinguished on the biotinylated antibody); a streptavidin-coated up-converting basis of excitation spectrum, emission spectrum, fluores phosphor then binds specifically to the biotinylated antibody cence decay time. or a combination of these or other in the sandwich and serves to report formation of the 35 properties.
sandwich complex on the solid substrate (which is a measure FIG. 22 shows a schematic of an apparatus for phase of the analyte concentration). When the solid substrate is a sensitive detection, which affords additional background magnetic bead. it is readily removed from the sample discrimination. The pulse or frequency mixer is set to pass solution by magnetic separation and the amount of phosphor the signal and discriminate against the background follow attached to the bead(s) in sandwich complex(es) are deter 40 ing frequency calibration for maximum background rejec mined by measuring specific up-converting phosphores tion.
cence. Thus, sandwich complex phosphorescence provides a Covalent Conjugation of Upconverting Phosphor Label to quantitative measure of analyte concentration. Avidin
Biotinylated polynucleotides are also conveniently used An upconverting ytrium-ytterbium-erbium as hybridization probes, which can be bound by 45 (Yossy booseroos) oxysulfide (OS) phosphor was linked to streptavidin-coated up-converting phosphors to report avidin by the following procedure:
hybrid formation. Monodisperse upconverting phosphor particles were Background Phosphorescence in Biological Samples silanized with thiopropyltriethoxysilane (Huls) following Background signals were determined in two biological the procedure detailed by Arkles (in: Silicone Compounds: samples for determination of potential background in immu 50 Register and Review, Hills America, pgs. 59-75, 1991). This noassays. Sputum and urine were used as samples in the consisted of adding thiopropyltriethoxysilane (2 g) and 95% same apparatus as used for the phosphorescence sensitivity aq. ethanol (100 mL) to a 500 mL Erlenmeyer flask and measurements (supra). No background levels were found stirred for 2 minutes. Approximately 8 mL of the 65 mg/mL above the system noise levels set by the photomultiplier dark phosphor suspension in DMSO was then added to the current. This noise level allows detection of signals from on 55 mixture. This suspension was stirred for an additional 2 the order of a few hundred particles/cm. This is close to a minutes, then transferred to centrifuge tubes and centrifuged single particle in the detection volume of the system. to separate the phosphor particles. The pellets were washed A photomultiplier is a preferred choice for a detector for twice with 95% aq. ethanol centrifuging each time. The high sensitivity measurements of up-converting phosphors resulting particles were collected and dried overnight under since photomultipliers can be selected to produce high vacuum at approximately 30° C. A quantity (127 mg) of dry quantum efficiency at the up-converted (i.e. emitted) wave silanized phosphors were resuspended in 1.5 mL of DMSO lengths and virtually no response in the range of the longer (phosphor stock).
excitation wavelengths. A solution containing 1.19 mg of avidin (Pierce) in 1.0 Detection of Cell Antigens with Phosphor-Labeled Antibod mL of borate buffer (95.4 mg sodium borate decahydrate and eS 65 17.7 mL of 0.1N NC1 in 50 mL of deionized water. pH 8.3) Streptavidin is attached to the up-converting phosphor was prepared (Avidin stock). Another solution containing particles as described, supra. The mouse lymphoma cell line. 1.7 mg of N-succinimidyl(4-iodoacetyl) aminobenzoate
Page 63
(Pierce Chemical) in 1.2 mL of DMSO was prepared (SIAB and then aliquoted (250 ul) into six fresh centrifuge tubes. stock). A quantity (10 ul) of the SLAB stock was added to Four of these samples received biotinylated goat antimouse the 1.0 mL of Avidin stock and stirred at room temperature IgG, while the remaining two received FITC-labelled goat 30 minto allow the N-hydroxysuccimide ester of the SIAB anti-mouse IgG. These immunoprecipitations were per to react with primary amines on the avidin (Avidin-SIAB formed at 4° C. for 30 minutes in volume of 400 uL with a stock). final second antibody concentration of 20 ug/ml. The cells A 20 mL scintillation vial was prepared containing 10 mL were harvested and washed in PBS as above but were of borate buffer (pH 8.3). The following additions were then resuspended in 50 L of blocking buffer (0.2% purified made to this vial: 21.6 L of the avidin-SIAB stock solution casein in PBS. Tropix. Bedford, Mass.). The cell-antibody followed by 1.5 mL of the phosphor stock. This reaction O complexes were blocked in this solution for 30 minutes at mixture was stirred at room temperature in the dark over room temperature and then transferred to fresh tubes. night to allow the SIAB activated avidin to react with the A pre-blocked suspension (40 pull) of either avidin thiol groups present on the silanized phosphor surface and Phosphor conjugate, avidin-FTTC. avidin, or unconjugated resulting in the covalent linkage of avidin to the phosphor Phosphor was added to four of the cell samples conjugated particles. 15 with the biotinylated anti-mouse IgG (H&L). In addition, an After the overnight incubation 1.0 mL of the reaction equal amount of pre-blocked avidin-Phosphor or unconju mixture was centrifuged (1 min at 10,000 g) and the super gated Phosphor was added to the remaining two cell samples natant removed. The pellet was resuspended in 1.0 mL of immunoprecipitated with the non-biotinylated FITC phosphate buffered saline (pH 7.2. Pierce) and centrifuged labelled anti-mouse IgG (H&L). The avidin reporter conju again to wash any unconjugated protein from the phosphors. gates or negative controls were preblocked as follows. This washing process was repeated. The washed pellet was Avidin-Phosphor and Phosphor alone was diluted in block resuspended in 1.0 mL of phosphate buffered saline and used ing buffer by adding 10 uL of a 6.7 mg/ml suspension to a directly in diagnostic assays as described below. final volume of 100 ul. Avidin-FITC and the avidin alone Measurement Apparatus controls were also diluted in blocking buffer by adding 27 ul A modified SLM Aninco 48000 Fluorimeter was used to 25 of 2.5 mg/ml solution to a final volume of 100 uL. These measure the fluorescence spectrum from the phosphor reagents were blocked at room temperature for 3 hours with samples. The modifications to this device consisted of intermittent resuspension and then added to 50 ul of cells adding a laser diode (David Sarnoff CD-299R-FA #13) labelled with biotinylated or non-biotinylated second anti which was input to the fluorimeter through port 3. The laser body. The avidin-biotin reactions were performed at room diode emits at A=985.1 nm. Spectral data provided by the 30 temperature for 30 minutes with occasional resuspension. David Sarnoff Research Center also shows a small peak at The reactions were stopped by harvesting the cells by 980.2 nm. This peak has 15% the intensity of the peak at 985 centrifugation and washing twice in blocking buffer. The samples were resuspended in 100 L of blocking buffer and
A 5.08 cm focal length lens was used to collimate the allowed to settle for 4-5 minutes. Slides for imaging were diode laser beam. The power of the IR laser light was 35 prepared by pipetting 5 ul of settled cells from the bottom measured as 6.1 mW at the cuvette location with a drive of the tube. Cells were imaged by confocal laser microscopy current of 75 mA. The beam was not focused at the center under appropriate conditions to observe cell surface FITC of the cuvette. This is true for the standard visible light from and upconverting phosphor signals. The observations are the fluorimeter excitation monochromator as well. The laser summarized in Table IV.
diode beam is diverging as it enters the cuvette holder and 40 The remainder of the samples were used to resuspend is approximately 4 mm (H)x2 mm (V) by the time it reaches paramagnetic, polystyrene beads bound with sheep anti the center of the cell. neglecting the changes in refractive mouse IgG. For each of the six samples. 3x10 beads were index of the cell wall and the liquid. prewashed with blocking buffer for 1 hour at room tempera Light emitted is scanned with a monochromator and ture in Eppendorf tubes. The buffer was removed by aspi detected by a photomultiplying tube (PMT) 90° from the 45 ration while the tubes were in a magnetic rack. The magnetic direction of the excitation light. The detection limits for the beads with anti-mouse IgG were allowed to bind to the modified SLM Aminco 48000 were determined by serial antibody labelled cells for 1 hour at room temperature with dilution to be 4x10M (240,000 phosphor particles per intermittent resuspension. The magnetic beads were then mL) in PBS. Phosphor emission peaks in the spectrum were collected on a magnetic rack, washed four times in blocking seen at wavelengths of 4062 nm, 434+2 nm, 5222 nm, and buffer, resuspended in 100 uL blocking buffer, transferred to 548+2 nm. The largest peak was at 548 mm. The intensity of a fresh tube, and up-converting phosphorescence was mea the 548 nm peak was used to discriminate samples. sured on the fluorimeter.
Linkage of Avidin-Phosphor Conjugate to Cell Surface To scan for phosphor emission, the emission monochro Marker mator bandwidth was set to 8 nm and the spectra were A lymphoblastoid cell line (Human Genetic Mutant Cell 55 scanned from 500 to 700 nm with a step size of 2 nm. Repository #GM07092) was cultured in RPMI 1640 media Samples were also measured for FTC signal by exciting the containing 15% heat inactivated fetal calf serum. A suspen samples with 37 uM at W-490 nm with a 2 nm bandwidth. sion of cells (10" cells) was centrifuged and resuspended in Since the excitation wavelength (490 nm) and the emission an equal volume of phosphate buffered saline (PBS) pH 7.4. wavelength (514 nm) are very close for FTTC, higher Cells were washed two times in PBS and resuspended to a resolution was required to get separable signals than with final concentration of 5x10 cells/ml. These cells were then phosphor labelling. The intensity of the 490 nm signal was incubated with a mouse IgG1 monoclonal antibody to 240W/cm at the center of the well. FITC emission spectra human 3-microglobulin, a Class I histocompatibility anti were scanned at 0.5 nm increments from 450 nm to 750 nm. gen in polystyrene centrifuge tubes. The cells were immu with a 2 nm bandwidth on the emission monochromator. noprecipitated for 30 minutes at 4° C. with an antibody 65 Sample 1 is the positive control and clearly yielded the concentration of 10 ug/ml. The cells were harvested by highest emission signal. Sample 2 indicates that any non centrifugation, washed twice in PBS. resuspended in PBS specific adsorption of the phosphors to the sample is limited
Page 64
and is readily discriminated from signal attributable to the paramagnetic beads in the absence of DNA. Samples 5 avidin-conjugated phosphor and showing that avidin linked and 6 show results of FITC-labeled avidin used to validate phosphors can specifically bind only when they are conju assay, gated with the probe, in this example through the biotin avidin linkage. Sample 3 is the negative control which TABLE V contains no phosphors, only avidin. Sample 4 shows FITC conjugated avidin. Although FTC signals were observed on Upconverting Phosphor Nucleic Acid Diagnostic Assay Results the cell surface by laser microscopy, the signals were below PMT Signal PMT Signal the level of detection on the fluorimeter for measurement of Sample DNA Reporter (V (3546 m) (V G514 mm) FITC, and since there was no phosphor in the sample there O 1. DNA labeled Avidin 6.297 2.4788 was no significant phosphor signal. Samples 5 and 6 show with linked that FITC-conjugated primary antibodies can be detected digoxigenin Phosphor and that the presence of phosphor or avidin-phosphor does and biotin not significantly disrupt binding of the primary antibody to 2 DNA labeled with
Silanized
Phosphor
its target antigen. 15 digoxigenin and biotin
Table TV 3 No DNA Avidin 16302 3.5779 linked
Surface Surface 4. DNA labelled Avidin 0.8505 2.8067
Type of goat Avidin Phosphor FTTC 20 with
Tube anti-mouse IgG Conjugate Signal Signal digoxigenin and biotin 1 biotinylated Avidin-Phosphor -- - 5 DNA labelled FTTC- lO484 8.4394 2 biotinylated Phosphor - - with Avidin 3 biotinylated Avidin - -- digoxigenin 4 biotinylated Avidi-FTTC - -- 25 and biotin 5 FTTC labeled Avidin-Phosphor -- -- 6 No DNA FITC- O899 3,5779 6 FTTC labeled Phosphor -- Avidin
Linkage of Avidin-Phosphor Conjugate to DNA Phosphor Downconversion Evaluation Plasmid DNA (25 g) was nick translated in the presence 30 A sample of the (YosYbooseroos)OS phosphors were of 20 mM dGTP, 20 mM dCTP. 20 mM biotin-14 dATP, 13 scanned for the presence of a downconverted signal. This mM dTTP, and 7 mM digoxigenin-11 duTP and purified by was accomplished by exciting a sample of the monodisperse ethanol precipitation. The average size of the biotinylated, phosphors described above (4x10M in DMSO) with 1.3 digoxygenin labelled fragments was estimated to be between mW of monochromatic light at 350 nm with a 16 nm. 200-300 nucleotides as estimated by gel electrophoresis. 35 bandwidth for the excitation source. Detection was accom Approximately 20 ug DNA was immunoprecipitated for 1 plished by scanning this sample from 350 to 800 nm with a hour at 22° C. with 10 g/ml mouse monoclonal anti monochomator bandwidth of 8 nm. Scanning was performed digoxigenin IgG1 solution (PBS) in a 200 ul volume. An in 2 nm increments. No downconversion was observed. equivalent reaction containing no DNA was also prepared. Moreover, no downconversion was seen at the excitation Each of the two samples were then aliquoted (50 uL) into 40 wavelengths cited by Tanke et al. (U.S. Pat. No. 5,043,265). three fresh Eppendorf tubes. Thus, the upconverting phosphors tested are unlike those The avidin-conjugates were blocked for 1 hour at room reported in Tanke et al.
temperature by diluting 500 g of an avidin-phosphor suspension. unconjugated phosphor suspension, or avidin HOMOGENEOUS ASSAYS solution in 300 L of blocking buffer. For each of the 45 The multiphoton activation process characteristic of samples (summarized below in Table V) 50 L of the upconverting phosphors can be exploited to produce assays anti-digoxigenin conjugates was added to 150 L of pre that blocked avidin-conjugates or avidin and were incubated for assaysrequire no sample washing steps. Such diagnostic that do not require the removal of unbound phosphor 30 minutes at room temperature.
Unbound avidin-conjugates were removed by resuspend 50 labels from the sample are herein termed homogeneous ing 3x10' paramagnetic beads linked with sheep anti-mouse assays. and can also be termed pseudohomogeneous assays. IgG (pre-blocked in blocking buffer). After incubation for 30 Homogeneous Assay Example 1 minutes at room temperature with intermittent resuspension, the beads were separated on a magnetic rack and washed 4 One embodiment of a homogeneous assay consists of the to 6 times in PBS. The antibody-DNA bound beads were 55 use of an upconverting phosphor label linked to an appro then measured on the fluorimeter. priate probe (e.g., an antibody or DNA). The phosphor The samples were scanned from 500 to 700 nm with a labeled probe specifically binds to a target (e.g. antigen or bandwidth of 8 nm and step size of 2 nm. Each PMT value nucleic acid) that is linked to a capturing surface. A suitable reported (Table V) represents an average over 5 scans. capture surface can be the tip of a light carrying optical fiber Sample 1 is expected to provide the highest PMT signal (FIG. 23) or the bottom surface of a sample container (FIG. since biotinylated DNA is present and can bind to the 24). Upon incubation of the target-labelled capture surface avidin-linked phosphors. Sample 2 indicates the level of with the phosphor-labelled probe, phosphor particles will nonspecific adsorption of the phosphors to the sample which accumulate at the capture surface as a function of the amount is found to be insignificant since the PMT signalis observed of target present on the capturing surface. The target may be to be the same as that of the negative control (sample 4) 65 linked directly to the capturing surface or may be immobi which contains no phosphors. Sample 3 is another control lized by interaction with a binding agent (e.g. specific and shows that the avidin-linked phosphors do not bind to antibody reactive with target, polynucleotide that binds
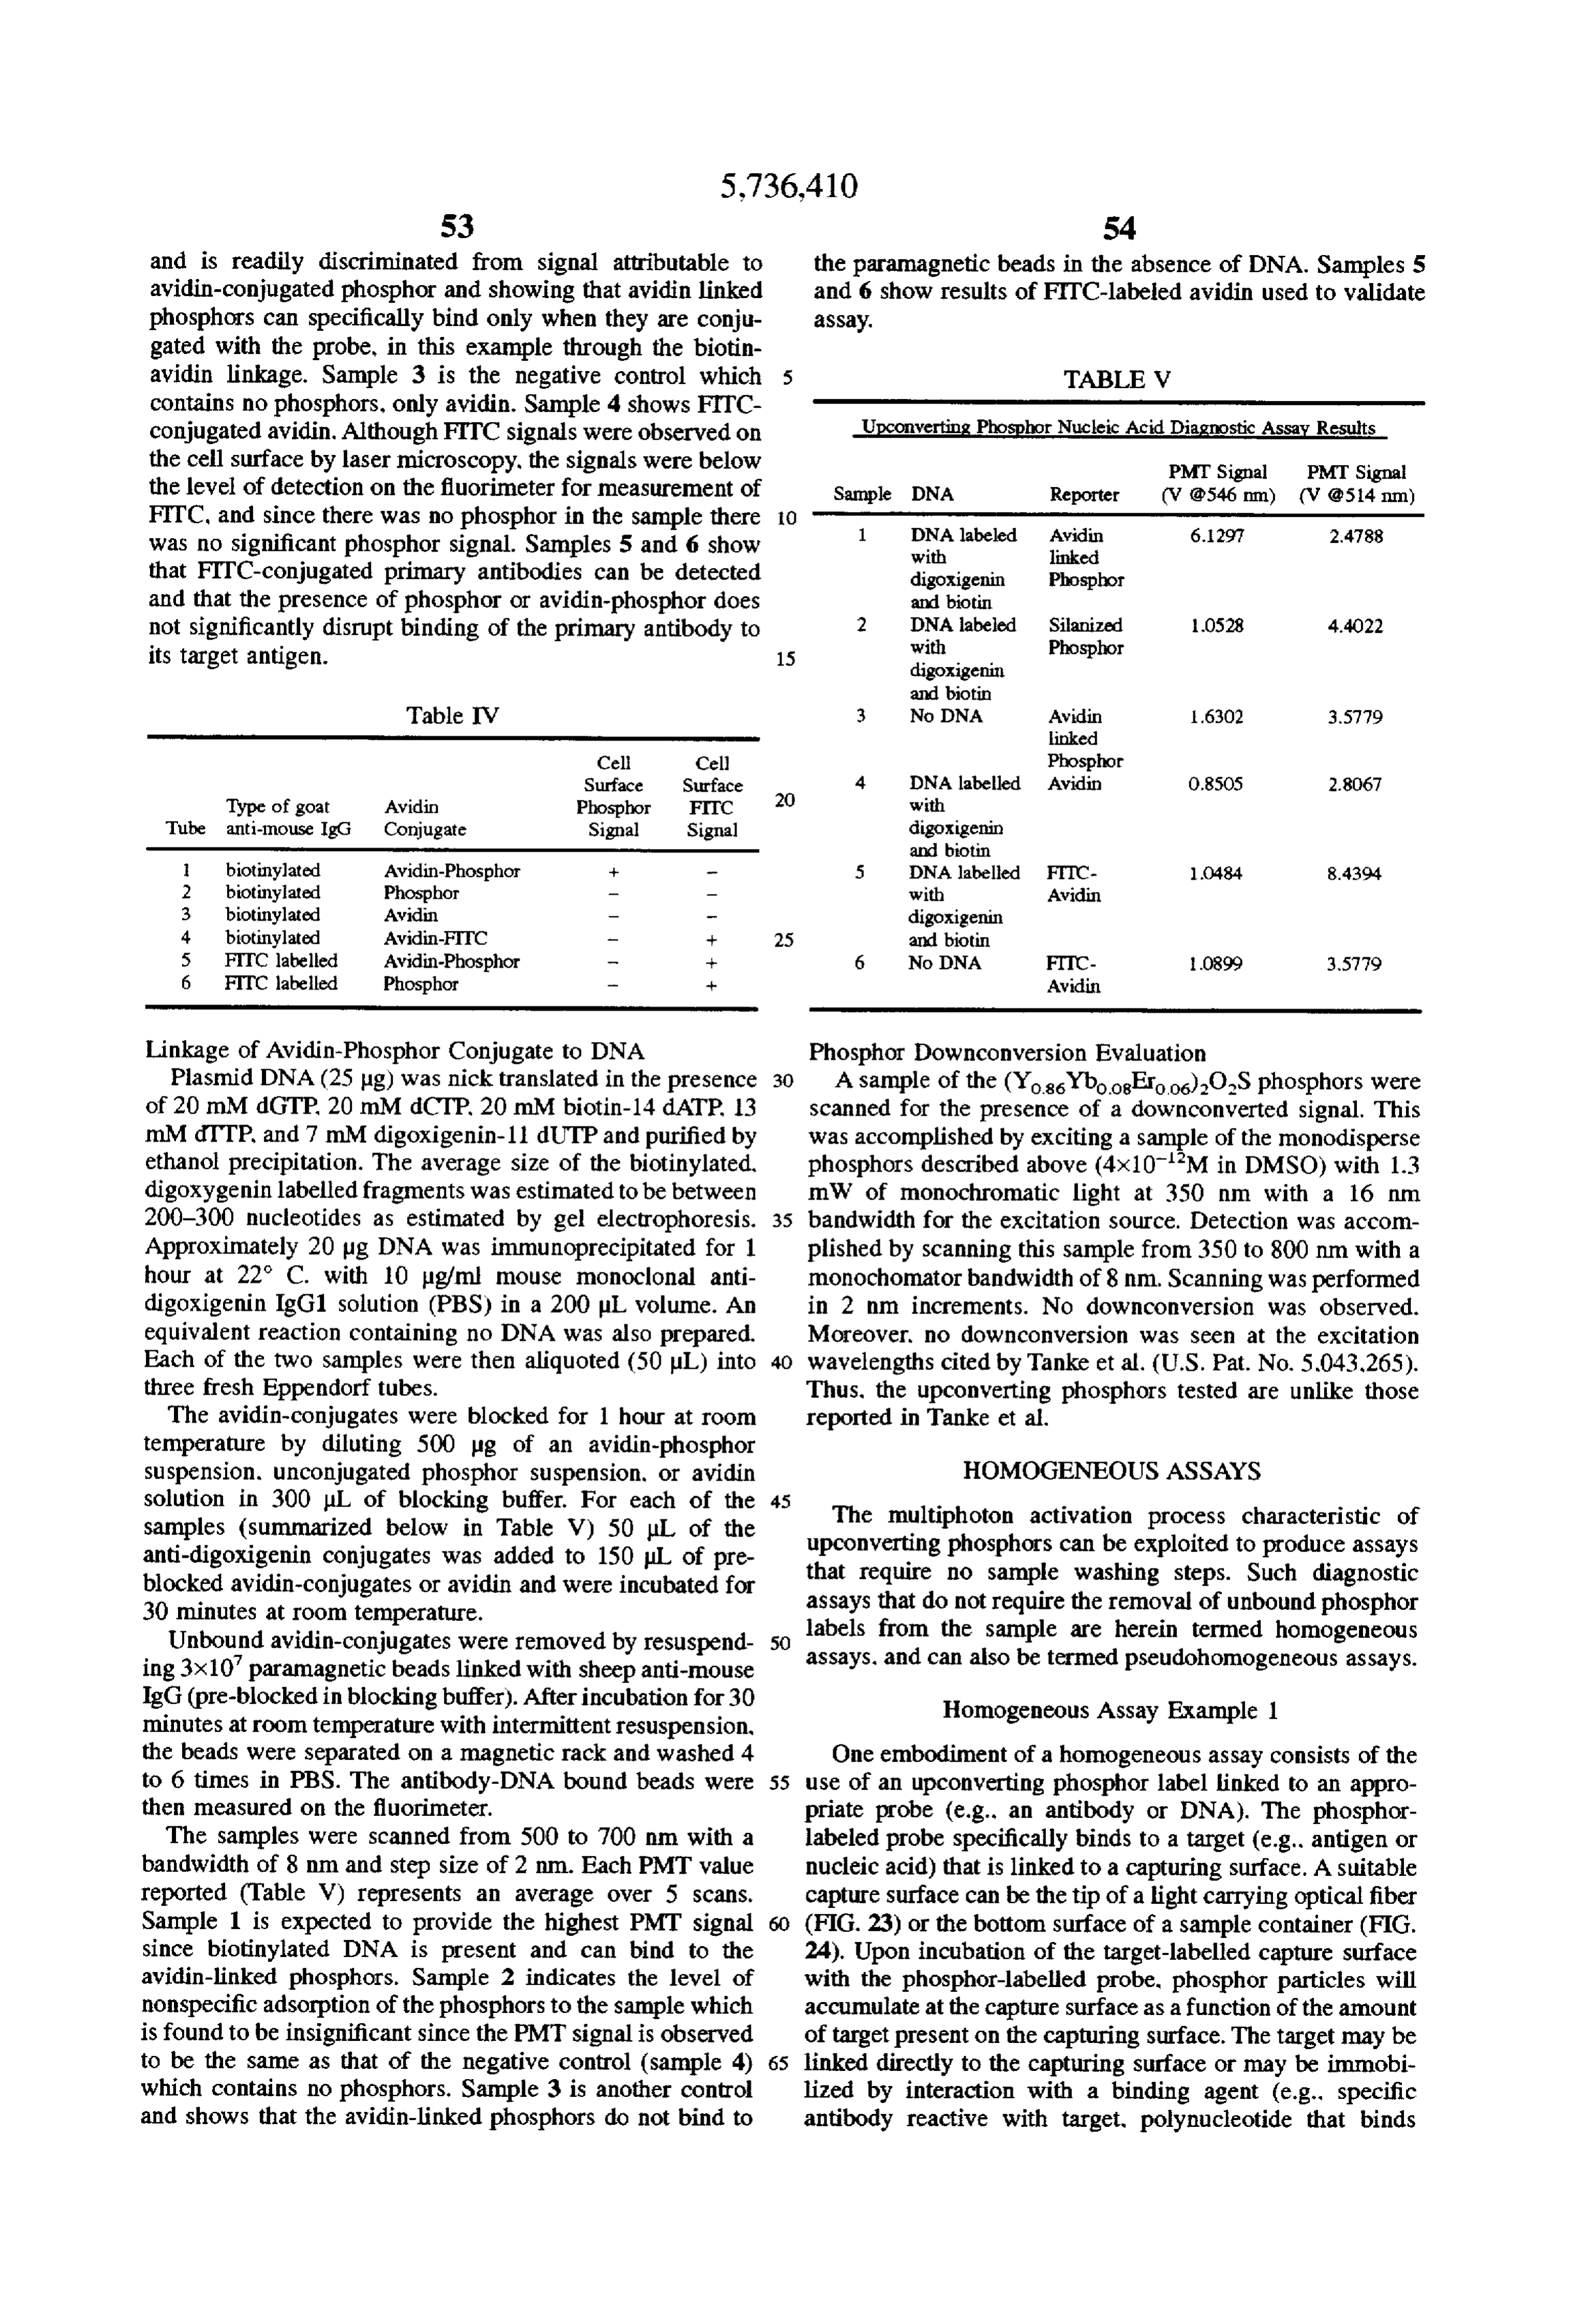
Page 65
55 S6 target) that is itself linked to the capturing surface (such as at least one means for energizing said source; in a sandwich immunoassay, for example). at least one detector capable of detecting light in a range Detection of the phosphor bound to the capture surface is of wavelengths that overlaps with at least a portion of effected using an excitation light that is focused from a low the emission band of the up-converting inorganic phos intensity beam of large cross-section to a high intensity 5 phor;
beam of small cross-section with the focal point of the beam at least one first means for directing at least a portion of being at or very near the capture surface. Focusing of the the light emitted by said source to a location at the excitation light is accomplished by transmission through sample, including light in the first range of wavelengths optical elements that have a very small focal distance, such and excluding light in the second range of wavelengths; that the beam diverges, becoming less intense, within a short O distance of the capture surface. at least one second means for directing at least a portion Since the intensity of the light emitted from the upcon of the light emanating from said location at the sample verting phosphor labels is proportional to the excitation light to said detector, including light in the second range of intensity raised to a power of two or greater, phosphors near wavelengths; and the focal point of the excitation source will emit significantly 15 wherein said first or second means for directing confo more light than those remaining in suspension in the sample cally directs said light.
away from the capture surface. Therefore, binding of upcon 2. The apparatus of claim 1 wherein: verting phosphor linked probes to the capture surface will said detector is responsive to light in the first and second yield an increase in emitted light intensity measured from ranges; and the sample as a whole or as measured from a control sample 20 in which phosphors do not bind to the capture surface. said second means for directing includes a wavelength Emitted light intensity may be plotted as a function of target selective element; and concentration using for standardization (calibration) a series only light having wavelengths in the second range reaches of samples containing predetermined concentrations of tar said detector.
get. The emitted light intensity from a test sample (unknown 3. The apparatus of claim 1 wherein the excitation band is concentration of target) can be compared to the standard 25 in the near infrared and the emission band is in the visible. curve thus generated to determine the concentration of 4. The apparatus of claim 1 wherein said first and second target. means for directing have no elements in common. Examples of suitable homogeneous assay formats 5. The apparatus of claim 1 wherein said first and second include, but are not limited to, immunodiagnostic sandwich means for directing have at least one element in common. assays and antigen and/or antibody surface competition 30 6. An apparatus of claim 5. wherein said first and second aSSayS. means for directing comprise at least one optical fiber. Homogeneous Assay Example 2 7. The apparatus of claim 1, wherein the sample possibly Another embodiment allows for the accumulation of further contains a second up-converting inorganic phosphor upconverting phosphor linked probes at the detection sur 35 by comprising at least one rare earth element and characterized face by the application of centrifugal or gravitational set emission an excitation band in a third range of wavelengths and an tling. In this embodiment an upconverting phosphor is the first and band in a fourth range of wavelengths. and wherein linked to multiple probes. All the probes must bind to the fourth third ranges do not overlap and the second and same target, although said binding can be accomplished at ranges do not overlap, and further comprising: different locations (e.g. as antibody probes may target 40 a second source capable of emitting light in a range of different epitopes on a single antigen). The multiprobe wavelengths that overlaps with at least a portion of the phosphor can then be used to effect the aggregation of excitation band of the second up-converting inorganic targets in solution or suspension in the sample. This aggre phosphor;
gation will result in the formation of a large insoluble means for energizing said second source: phosphor-probe-target complex that precipitates from solu 45 a second detector capable of detecting light in a range of tion or suspension (FIG. 25). The aggregated complex wavelengths that overlaps with at least a portion of the containing phosphors accumulates at a detection surface emission band of the second up-converting inorganic while nonaggregated material remains in solution or sus phosphor;
pension. Detection is accomplished as described in the third means for directing at least a portion of the light above example using a sharply converging excitation beam. 50 emitted by said second source to a location at the Although the present invention has been described in sample, including light in the third range of wave some detail by way of illustration for purposes of clarity of lengths and excluding light in the fourth range of understanding, it will be apparent that certain changes and wavelengths;
modifications may be practiced within the scope of the fourth means for directing at least a portion of the light claims. 55 emanating from said location at the sample to said
What is claimed is: detector, including light in the fourth range of wave 1. An apparatus for performing diagnostics on a sample lengths:
possibly containing an up-converting inorganic phosphor comprising at least one rare earth element in a host material wherein said first, second, third, or fourth directing means and characterized by an excitation band in a first range of confocally direct said light. wavelengths and an emission band in a second range of 8. The apparatus of claim 7 wherein: wavelengths that are shorter than the wavelengths in the first said second and fourth means for directing together range, the apparatus comprising: include at least one wavelength-selective element: at least one source capable of emitting light in a range of only light having wavelengths in the second range reaches wavelengths that overlaps with at least a portion of the 65 said first-mentioned detector; and excitation band of the up-converting inorganic phos only light having wavelengths in the fourth range reaches phor; said second detector.
Page 66
9. An apparatus of claim 7, further comprising an addi a first source capable of emitting light in a range of tional means, coupled to said second detector, for generating wavelengths that overlaps with at least a portion of the a signal representative of the intensity of light incident on excitation band of the first up-converting inorganic said second detector in a range of wavelengths that includes phosphor;
wavelengths in the fourth range and excludes wavelengths in the first, second, and third ranges. a second source capable of emitting light in a range of 10. Apparatus according to claim 1, wherein the apparatus wavelengths that overlaps with at least a portion of the comprises a phosphorescence-activated flow cytometer for excitation band of the second up-converting inorganic detection and gating of analytes bound to a microcrystalline phosphor;
up-converting phosphor. means for energizing said first and second sources includ 11. Apparatus according to claim 1, wherein the apparatus O ing means for imposing different intensity patterns on comprises a hand-held probe for detection and gating of said first-mentioned and second sources: analytes bound to a microcrystalline up-converting phos phor, at least one detector capable of detecting light in a range 12. Apparatus according to claim 1, wherein the apparatus of wavelengths that overlaps with at least a portion of comprises a gridded imaging array for detection and gating 15 said second or fourth ranges of wavelengths; of analytes bound to a microcrystalline up-converting phos at least one first means for directing at least a portion of phor.
13. Apparatus according to claim 1, wherein the apparatus the light emitted by said first and second sources to a comprises a microtitre plate reader for detection and gating location at the sample, including light in the first and of analytes bound to a microcrystalline up-converting phos 20 third ranges of wavelengths and excluding light in the phor. second and fourth ranges of wavelengths; 14. An apparatus of claim 1. for further comprising at least one second means for directing at least a portion means, coupled to said detector, for generating a signal of the light emanating from said location at the sample representative of the intensity of light incident on said to said detector, including light in the second and fourth detector in a range of wavelengths that includes wavelengths 25 ranges of wavelengths and excluding light in the first in the second range and excludes wavelengths in the first and third ranges of wavelengths: range.
15. The apparatus of claim 1, wherein said first and means, coupled to said detector. for generating first and Second means for directing confocally direct said light. second signals representative of the respective intensi 16. The apparatus of claim 1, wherein the sample possible ties of light incident on said detector at wavelengths in further contains a second up-converting inorganic phosphor 30 the second and fourth ranges and outside the first and comprising at least one rare earth element in a host material third ranges, including means for distinguishing said and characterized by an excitation band in a third range of different intensity patterns; and wavelengths and an emission band in a fourth range of wherein at least said first or second means for directing wavelengths, and wherein the first and third ranges overlap 35 confocally directs said light. and the second and fourth ranges do not overlap, and further 18. The apparatus of claim 17 wherein said means for comprising: imposing different intensity patterns comprises: a second detector capable of detecting light in a range of wavelengths that overlaps with at least a portion of the a first waveform generator coupled to said first-mentioned emission band of the second up-converting inorganic source so as to modulate the intensity at a first fre phosphor; quency; and third means for directing at least a portion of the light a second waveform generator coupled to said second emanating from said location at the sample to said source so as to modulate the intensity at a second detector, including light in the fourth range of wave frequency that is different from said first frequency. lengths and excluding light in the first and third ranges 45 19. The apparatus of claim 7 wherein said means for of wavelengths; and distinguishing comprises:
additional means, coupled to said second detector, for a first frequency mixer having a first input terminal generating a signal representative of the intensity of coupled to said first waveform generator and a second light incident on said second detector in a range of input terminal coupled to said detector; and wavelengths that includes wavelengths in the fourth 50 range and excludes wavelengths in the first, second, a second frequency mixer having a first input terminal and third ranges; coupled to said second waveform generator and a wherein said first, second or third means for directing second input terminal coupled to said detector. confocally directs said light. 20. The apparatus of claim 17 wherein said means for 17. An apparatus for performing diagnostics on a sample 55 imposing different intensity patterns comprises: possible containing first and second up-converting inorganic a pulse generator for energizing said first-mentioned phosphors comprising at least one rare earth element in a source during a first time interval and energizing said host material, wherein the first up-converting inorganic second source in a second time interval that does not phosphor is characterized by an excitation band in a first overlap said first time interval. range of wavelengths and an emission band in a second 21. The apparatus of claim 20 wherein said means for range of wavelengths that are shorter than the wavelengths distinguishing comprises:
in the first range, wherein the second up-converting inor a gated integrator coupled to said pulse generator and to ganic phosphor is characterized by a excitation band in a said detector, operable to provide separate output sig third range of wavelengths and an emission band in a fourth nals for said first and second time intervals. range of wavelengths, and wherein the first and third ranges 65 22. A method for performing diagnostics on a sample do not overlap and the second and fourth ranges overlap, the possibly containing an up-converting inorganic phosphor apparatus comprising: characterized by an excitation band in a first range of
Page 67
wavelengths and an emission band in a second range of directing light emanating from said location at the sample wavelengths that are shorter than the wavelengths in the first thod comprising:
generating a signal representative of the intensity of light range, the method co Sling in a range of wavelengths that includes wavelengths in providing a source capable of emitting light in a range of 5 the second range and excludes wavelengths in the first wavelengths
that is within rting i ic ph the excitation band of the E. id light emitted fr id is confocall wherein said light emitted from said source is confocally up-converting inorganic phosphor directed to said location at the sample or said light providing a detector capable of detecting light in a wave- emanating from said location is confocally directed to length that is within the mission band of the said detector, 23. The method of claim 22 wherein the excitation band
p-converting iInorganuc nic phosphor phosphor; is in the near infrared and the emission band is in the visible. directing light emitted by said source to a location at the sample: *k k :: *k sk

Provenance
- Collection
- Cited prior art
- Original PDF
- patentimages.storage.googleapis.com →
- Filed
- 1995-06-07
- Pages
- 67
- Method
- pdftotext (the PDF's own text layer) + pdftoppm 300dpi page scans
- Source
- Google Patents bibliographic record
- Granted
- 1998-04-07
- Inventors
- David A. Zarling; Michel J. Rossi; Norman A. Peppers; James Kane; Gregory W. Faris; Mark J. Dyer; Steve Y. Ng; Luke V. Schneider; SRI International Inc
- Transcribed from
- patentimages.storage.googleapis.com →