patent · US4973386
Passive acoustic power spectra to monitor and control processing
27 November 1990
Page 1 — bibliographic record
United States Patent (19) 11 Patent Number: 4,973,386 Callegari et al. 45 Date of Patent: Nov. 27, 1990 54 PASSIVE ACOUSTC POWER SPECTRATO 52 U.S. Cl. .......................................... 201/1; 201/31; MONITOR AND CONTROL PROCESSING 208/127; 208/DIG. 1; 73/579; 73/659 Andrew J. Callegari, Princeton, N.J.; 58 Field of Search ................... 201/1, 23, 31, 41, 37; (75) Inventors:
Eugene R. Elzinga, Jr., Marquette, 422/139, 140; 73/579, 590, 659 Mich.; George D. Cody, Princeton;
Roger W. Cohen, Trenton, both of (56) References Cited
N.J. U.S. PATENT DOCUMENTS (73) Assignee: Exxon Research and Engineering 2,788,312 4/1957 Moser, Jr. ............................... 20/1 Company, Florham Park, N.J. 2,808,368 0/1957 Moser, Jr. ........................... 208/127 2,882,223 4/1959 Stokes ................................. 208/127 * Notice: The portion of the term of this patent 2,888,398 5/1959 Griffin, Jr. .............................. 201M1 subsequent to Oct. 31, 2006 has been 4,095,474 6/1978 Hancock et al. ...................... 73/579 disclaimed. 4,285,241 8/1981 Smith et al............................ 73/579 (21) Appl. No.: 212,762 Primary Examiner-Joye L. Woodard Attorney, Agent, or Firm-Ronald D. Hantman 22 Filed: Jun. 29, 1988 57 ABSTRACT Related U.S. Application Data A process for the detection and measurement of wall Continuation-in-part of Ser. No. 72,533, Jul. 13, 1987, coke at a specific location in a fluid bed coker through (63) the measurement of the vibrations of the external shell Pat. No. 4,877,488, which is a continuation-in-part of of the coker at the location.
51 Int, C. ..... 48 - a - 8 a C10B 55/10; G01H 13/00 6 Claims, 11 Drawing Sheets
Fluid Coker reactor
TO AMPFER
DILUTE PHASE
top of ENS sed
CROSS Sction of REACTOR
bottom of Dense bed
SR3NO EVEL
Page 2
Drawing sheet — no readable text.
Page 3
Drawing sheet — no readable text.
Page 4
Drawing sheet — no readable text.
Page 5
Drawing sheet — no readable text.
Page 6
Drawing sheet — no readable text.
Page 7
Drawing sheet — no readable text.
Page 8
Drawing sheet — no readable text.
Page 9
Drawing sheet — no readable text.
Page 10
Drawing sheet — no readable text.
Page 11
Drawing sheet — no readable text.
Page 12
Drawing sheet — no readable text.
Page 13
reactor due to erosion (decrease in wall thickness) or
PASSIVE ACOUSTIC POWER SPECTRATO material buildup (increase in wall thickness). In a pre MONTOR AND CONTROL PROCESSING ferred embodiment, the buildup of wall coke may be determined (hereinafter the process shall be illustrated
This is a Continuation-in-Part of U.S. Ser. No. 5 and described for a fluidized bed coker) at a specific 072,533, filed July 13, 1987, now U.S. Pat. No. location in a fluid bed coker through the measurement 4,877,488, which is a Continuation-in-Part of U.S. Ser. of the vibrations of the external shell of the coker at that No. 924,998, filed Oct. 30, 1986, now abandoned. location. The process utilizes those wall vibrations
BACKGROUND OF THE INVENTION
which are produced by the fundamental compressional 10 wave resonance of the coker wall. These vibrations
The present invention relates to the non-intrusive exhibit themselves as a peak in the power spectrum at a passive acoustic detection and measurement of the frequency determined by the geometric and acoustic change in wall thickness in a coker reactor. properties of the coker wall at that location. (The spec It is often desirable to determine the change in wall trum includes higher order peaks that diminish in inten thickness of a reactor that processes materials. The 15 sity. This invention shall be illustrated and described change in thickness may be erosion of the interior wall using the first or fundamental peak.) Downward shifts of the vessel such as a fluidized catalytic cracking unit in the frequency of the peak correspond to increasing or material buildup on the interior wall of the vessel thickness of coke on the wall due to process conditions. such as wall coke on the interior wall of a fluidized bed Upward shift in the frequency proceed from a reduction coker. 20 in coke thickness due to the erosion of wall coke by the Coking is a thermal process for converting heavy, particles of dense bed.
residual oils into lighter products and solid carbon. In The invention depends on the excitation of the wall the earliest coking process, called delayed coking, after resonance at sufficient intensity that the peak can be heating and partial vaporization, the residuum is passed readily identified in the presence of the vibrational noise into a coking drum which fills up with solid coke depos 25 background. For fluid bed cokers and other fluid bed its. This coke must then be drilled out. See, e.g., U.S. processing units common to the petrochemical indus Pat. No. 4,410,398. In an alternate process, the fluid try, the impact of bed particles on the interior wall is coking process, coke is deposited on particles of seed sufficient to excite the wall resonance well above the coke in a fluidized bed and the coke product is in the background noise level. For other types of furnaces form of freely flowing granules. Fluid coking also em 30 having large flames, the sound emission from the flame ploys two beds with particles circulating between the is sufficient to excite the wall resonance above back coking reactor and a burner vessel where some coke ground noise level. Both the mass, normal velocity and particles are burned to produce the necessary heat. volume density of fluidized or flowing coke or catalyst Fluid coking is sensitive to feed flow and reactor particles are such that this is the case both in cokers and temperature. If the heavy residual oil is fed too fast and 35 cat crackers. It is surprising indeed that the wall reso the reactor is at too low a temperature, the coking reac nances are excited with sufficient intensity to raise the tion rate will be too low and coke particles will become level of the resonances above the background noise wetted with incompletely reacted feed which increases level of the fluidized bed reactor.
their tendency to stick together in large poorly fluidiza The present invention can thus be easily distinguished ble lumps and to stick to the vessel wall producing wall from "active acoustics' or "ultrasonics' where an ex coke. Correct control of feed rate at sufficiently high ternally produced sound pulse of short wavelengths and temperatures is necessary to prevent this bogging. We pulse length is used to measure or detect the presence of can define a critical bed temperature, the bogging tem coke by determining the distance travelled by a pulse perature, TB, which will be a function of coker geome reflecting off the interior surface of the coker wall. In try, feed injection rate and character of feed. Currently 45 distinction, the present invention depends on process fluid coker reactors are operated at temperatures far noise to excite the wall-resonance and is a "passive above the bogging temperature in order to avoid wall acoustic' technique. No penetration of the vessel is coke. High temperature operation favors the produc required. As such, it is non-intrusive and easily auto tion of coke and light gases at the expense of more mated.
desirable liquid products. As a result, the yield of desir 50 We have described a process to monitor and control able liquid products is significantly reduced compared wall coke on a working fluid bed coker. The steps of the to lower temperature operation. Reducing the operat process start with obtaining a power spectrum of the ing temperature for a particular unit requires the ability wall vibrations of the coker in a frequency range that to determine when appreciable quantities of wall coke includes the wall resonance. The power spectrum is are being deposited. 55 obtained by appropriate processing of the voltage signal Thus, there is a need for a rapid response reliable wall produced by the accelerometer attached to the wall. coke detector to monitor coke buildup and which This power spectrum and the dominant wall resonance would allow operation in the optimum range for liquid peak within it is the basis for subsequent measurements product yield. In addition to operating the reactor at and underlies the process described. The peak corre temperatures closer to the bogging temperatures, there sponding to the wall resonance can be identified by its are other process parameters affecting the operation shape and frequency location as determined by the and product yield that need to be monitored. These acoustic constants of the wall or can be determined include the pressure and velocity of the fluidizing gas empirically by direct excitation of the wall resonance (see U.S. Pat. No. 2,788,312). with a suitable impulse hammer.
SUMMARY OF THE INVENTION
65 Downward shifts in the frequency of the wall reso nance correspond to coke build-up. Upward shifts cor
The present invention is a process for the detection respond to coke erosion. Computer processing of the and measurement of the change in wall thickness of a voltage signal produced by the accelerometer will thus
Page 14
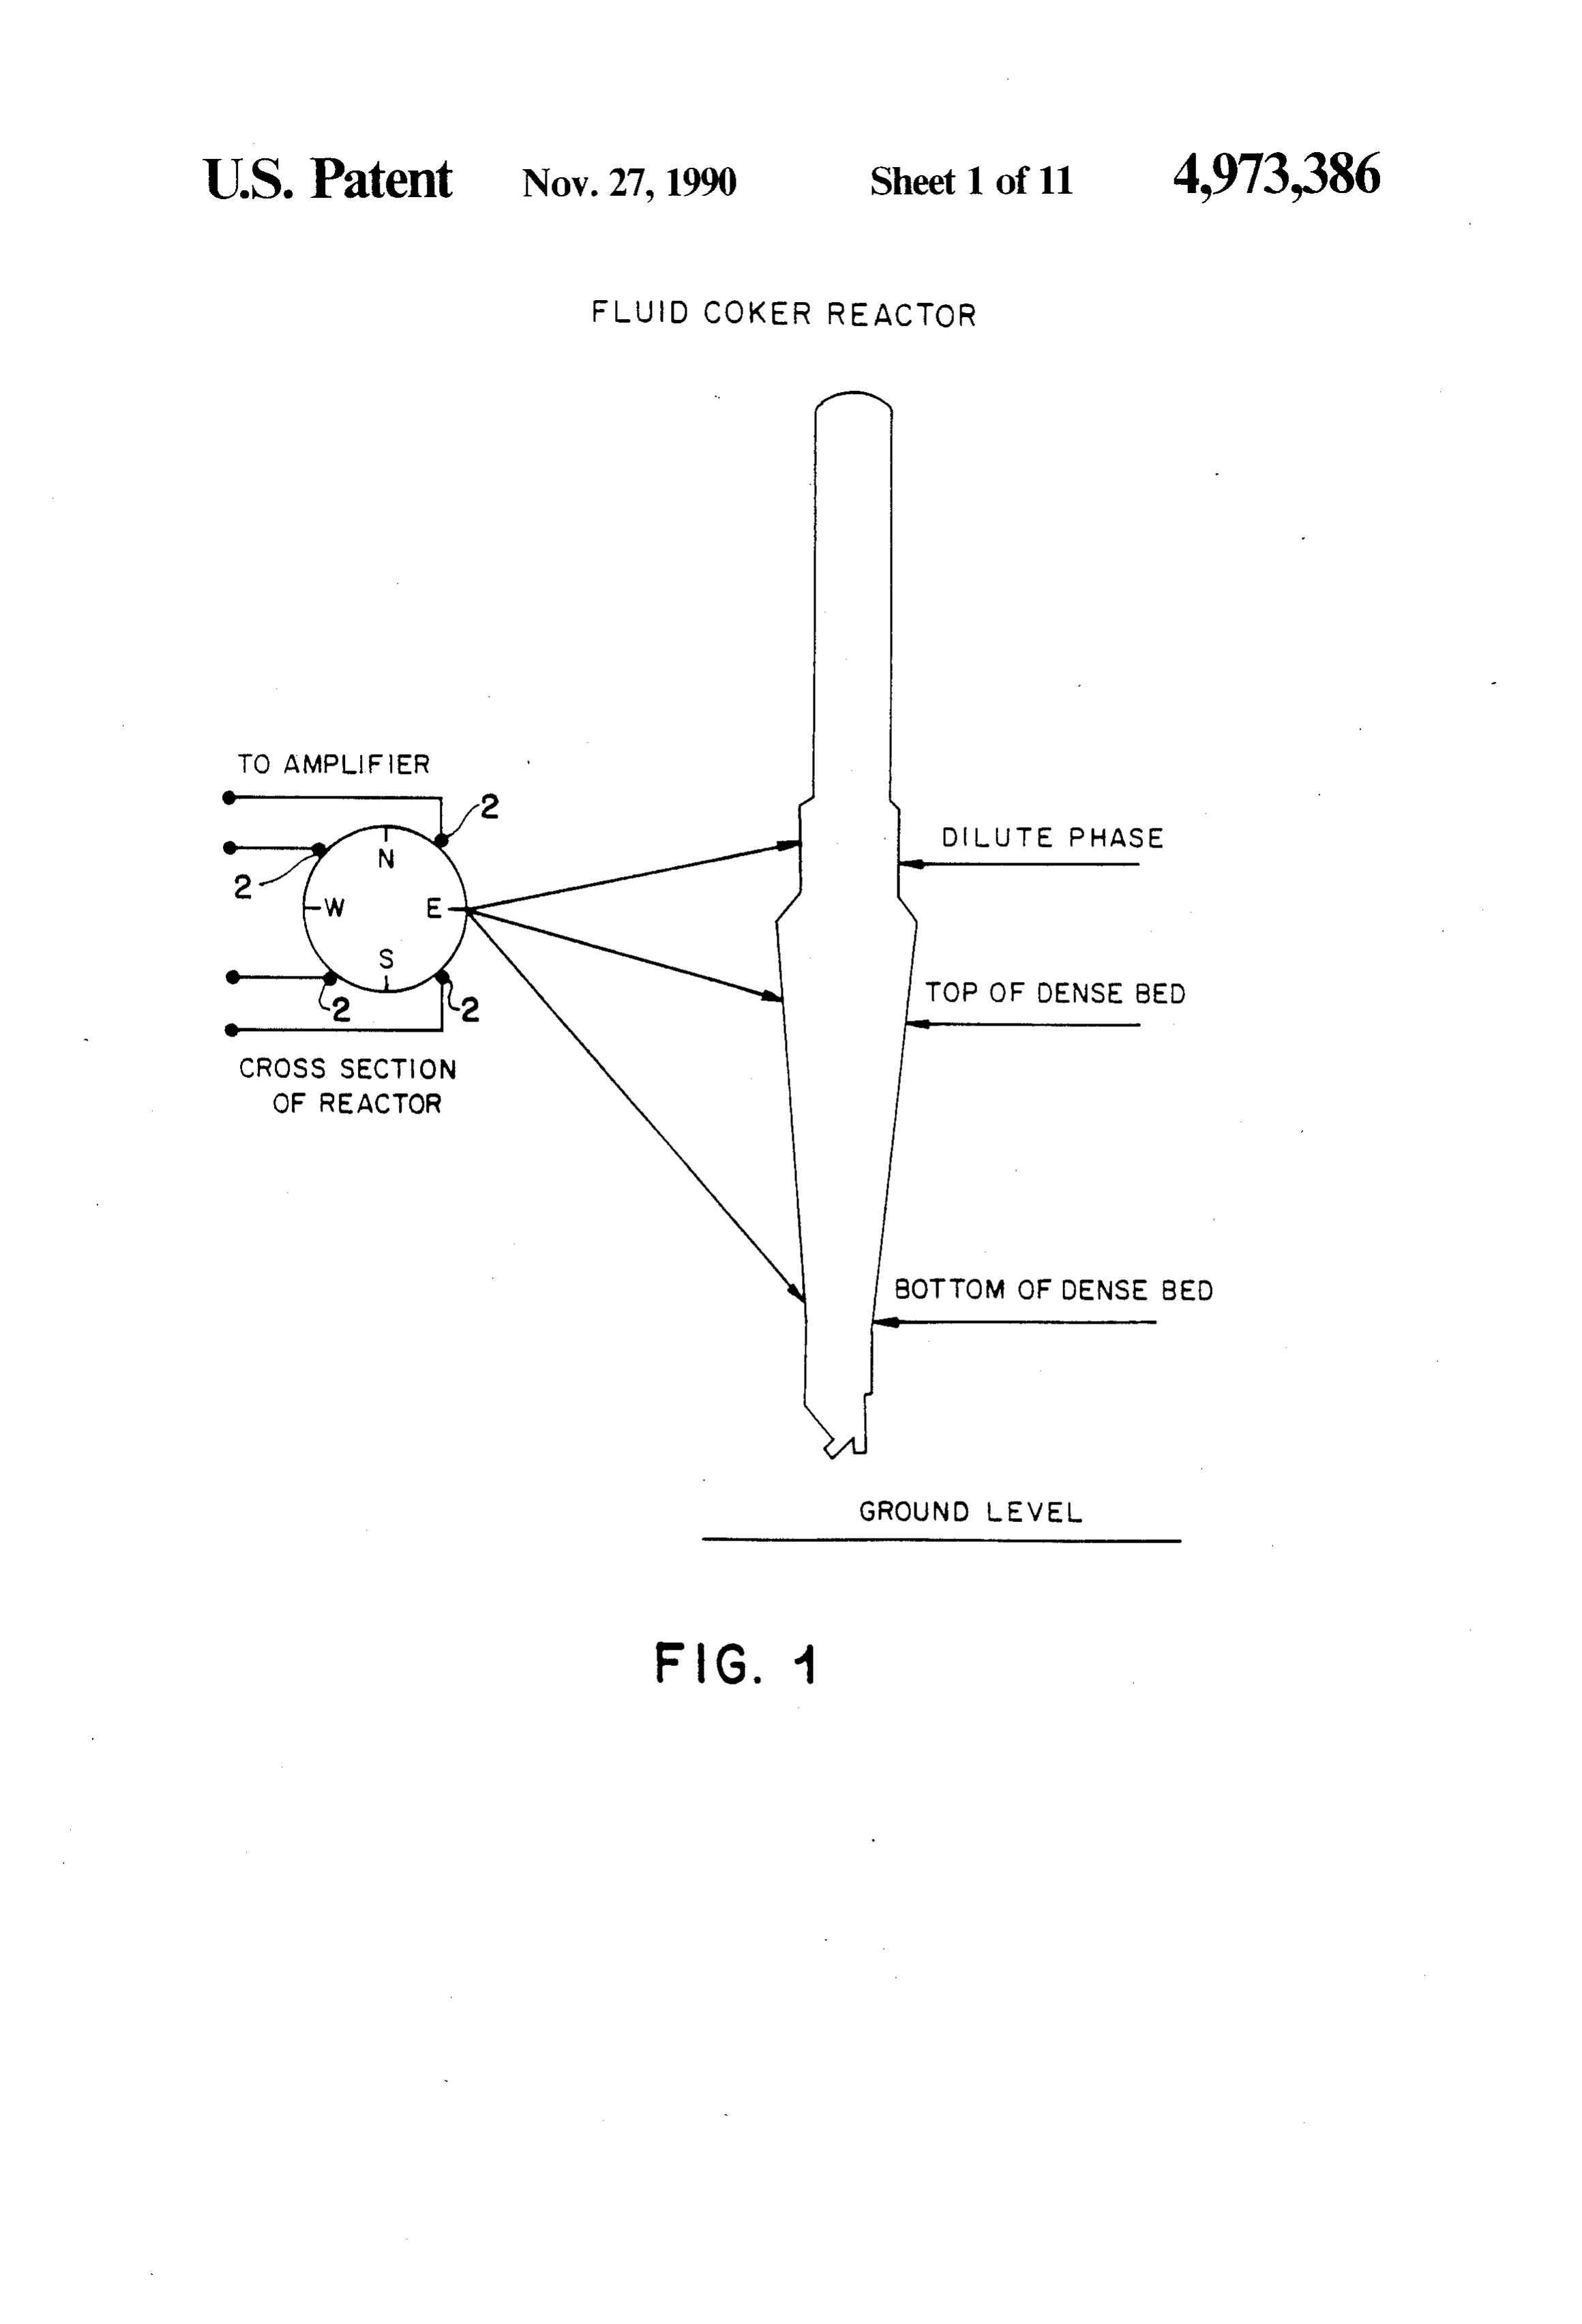
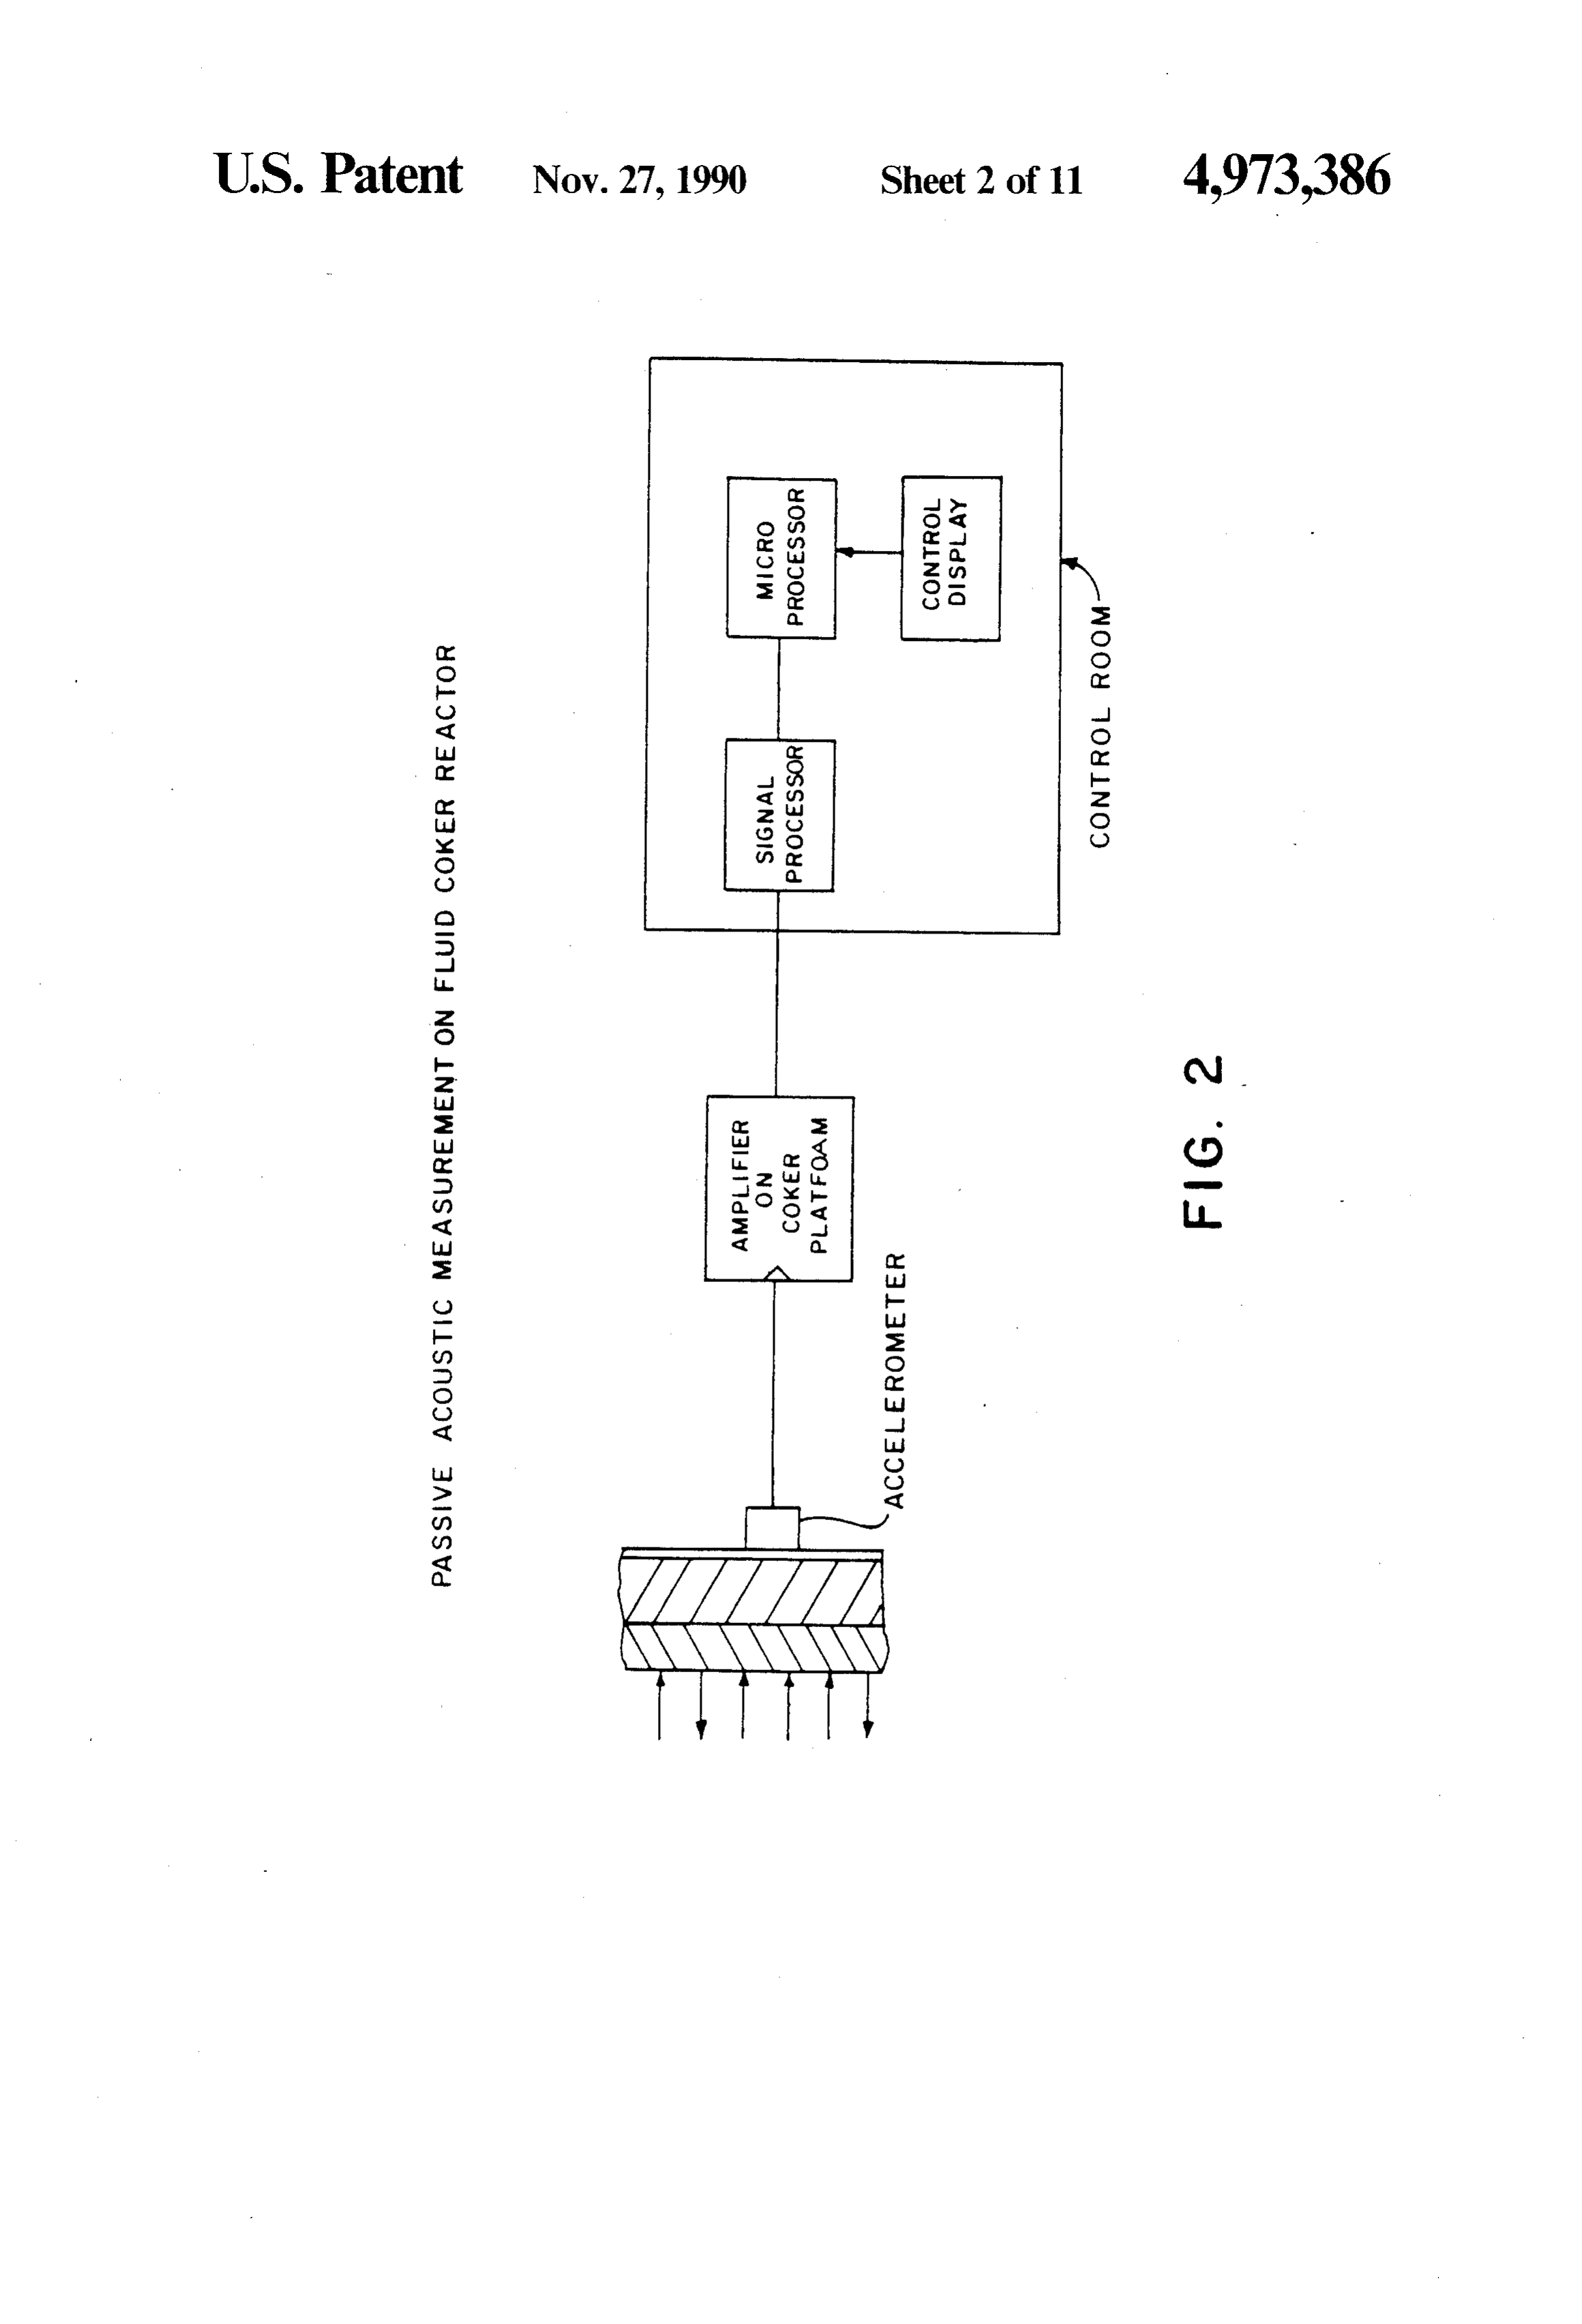
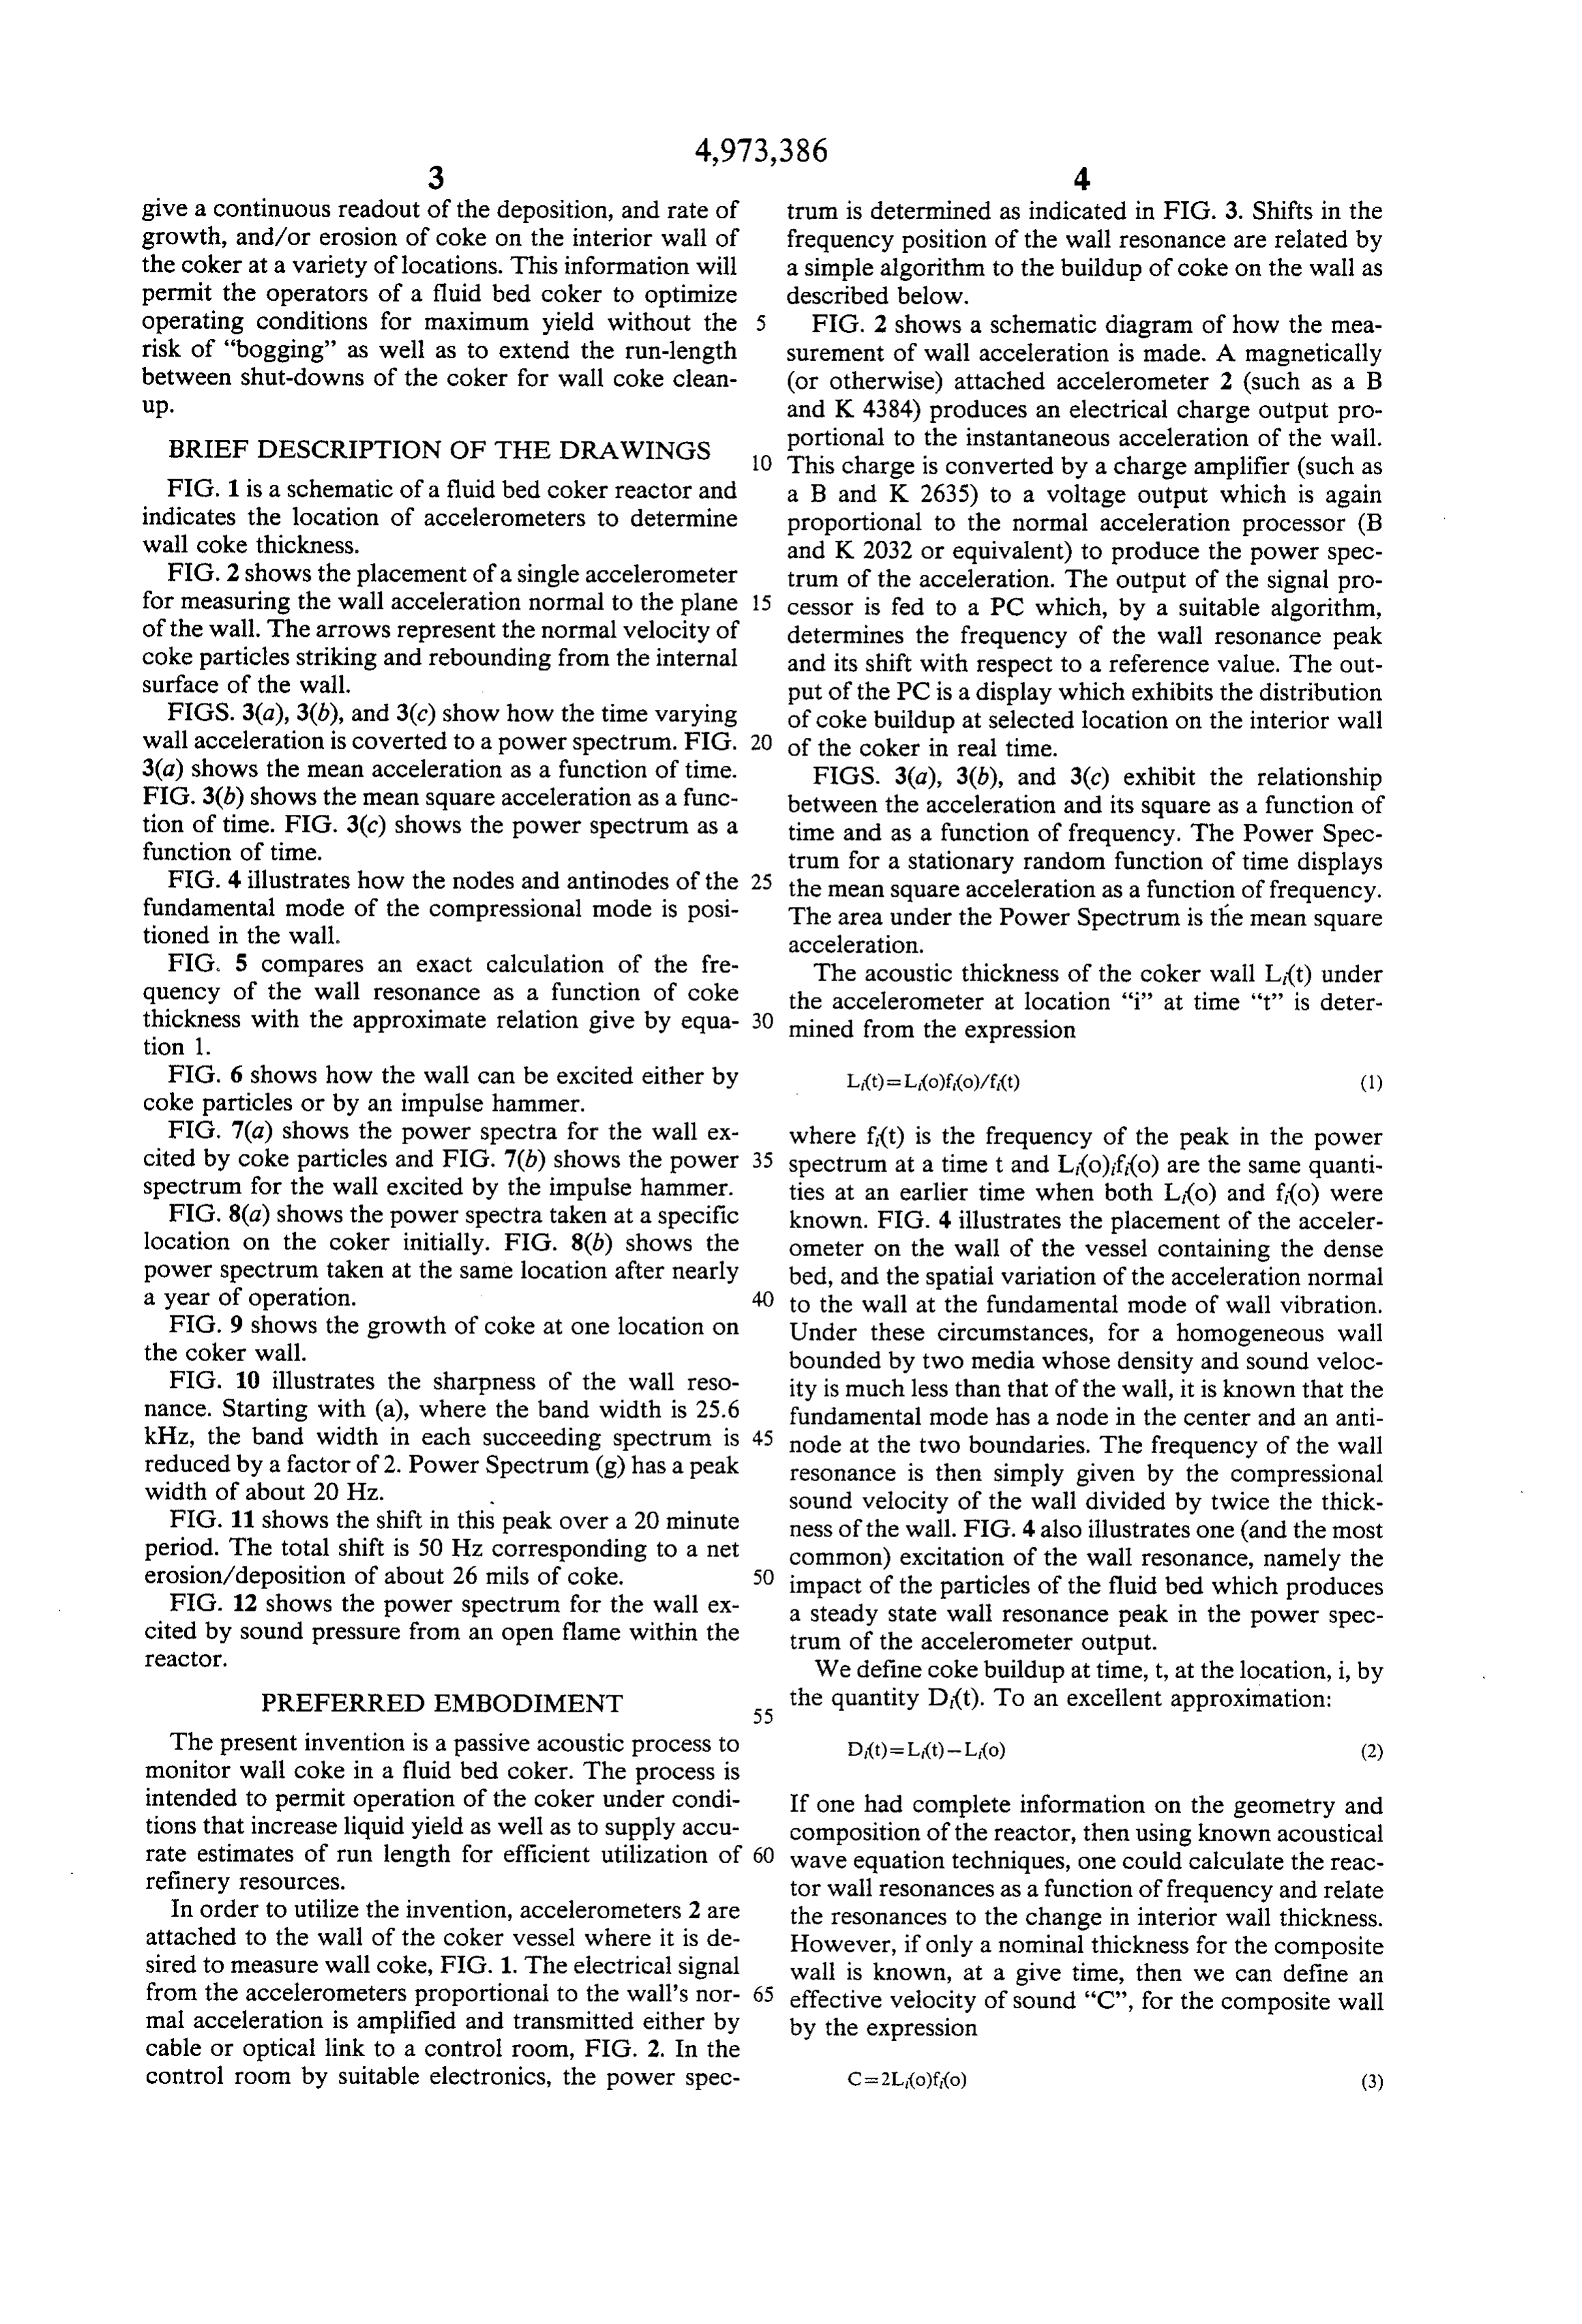
give a continuous readout of the deposition, and rate of trum is determined as indicated in FIG. 3. Shifts in the growth, and/or erosion of coke on the interior wall of frequency position of the wall resonance are related by the coker at a variety of locations. This information will a simple algorithm to the buildup of coke on the wall as permit the operators of a fluid bed coker to optimize described below.
operating conditions for maximum yield without the FIG. 2 shows a schematic diagram of how the mea risk of "bogging” as well as to extend the run-length Surement of wall acceleration is made. A magnetically between shut-downs of the coker for wall coke clean (or otherwise) attached accelerometer 2 (such as a B up. and K 4384) produces an electrical charge output pro BRIEF DESCRIPTION OF THE DRAWINGS portional to the instantaneous acceleration of the wall. O This charge is converted by a charge amplifier (such as
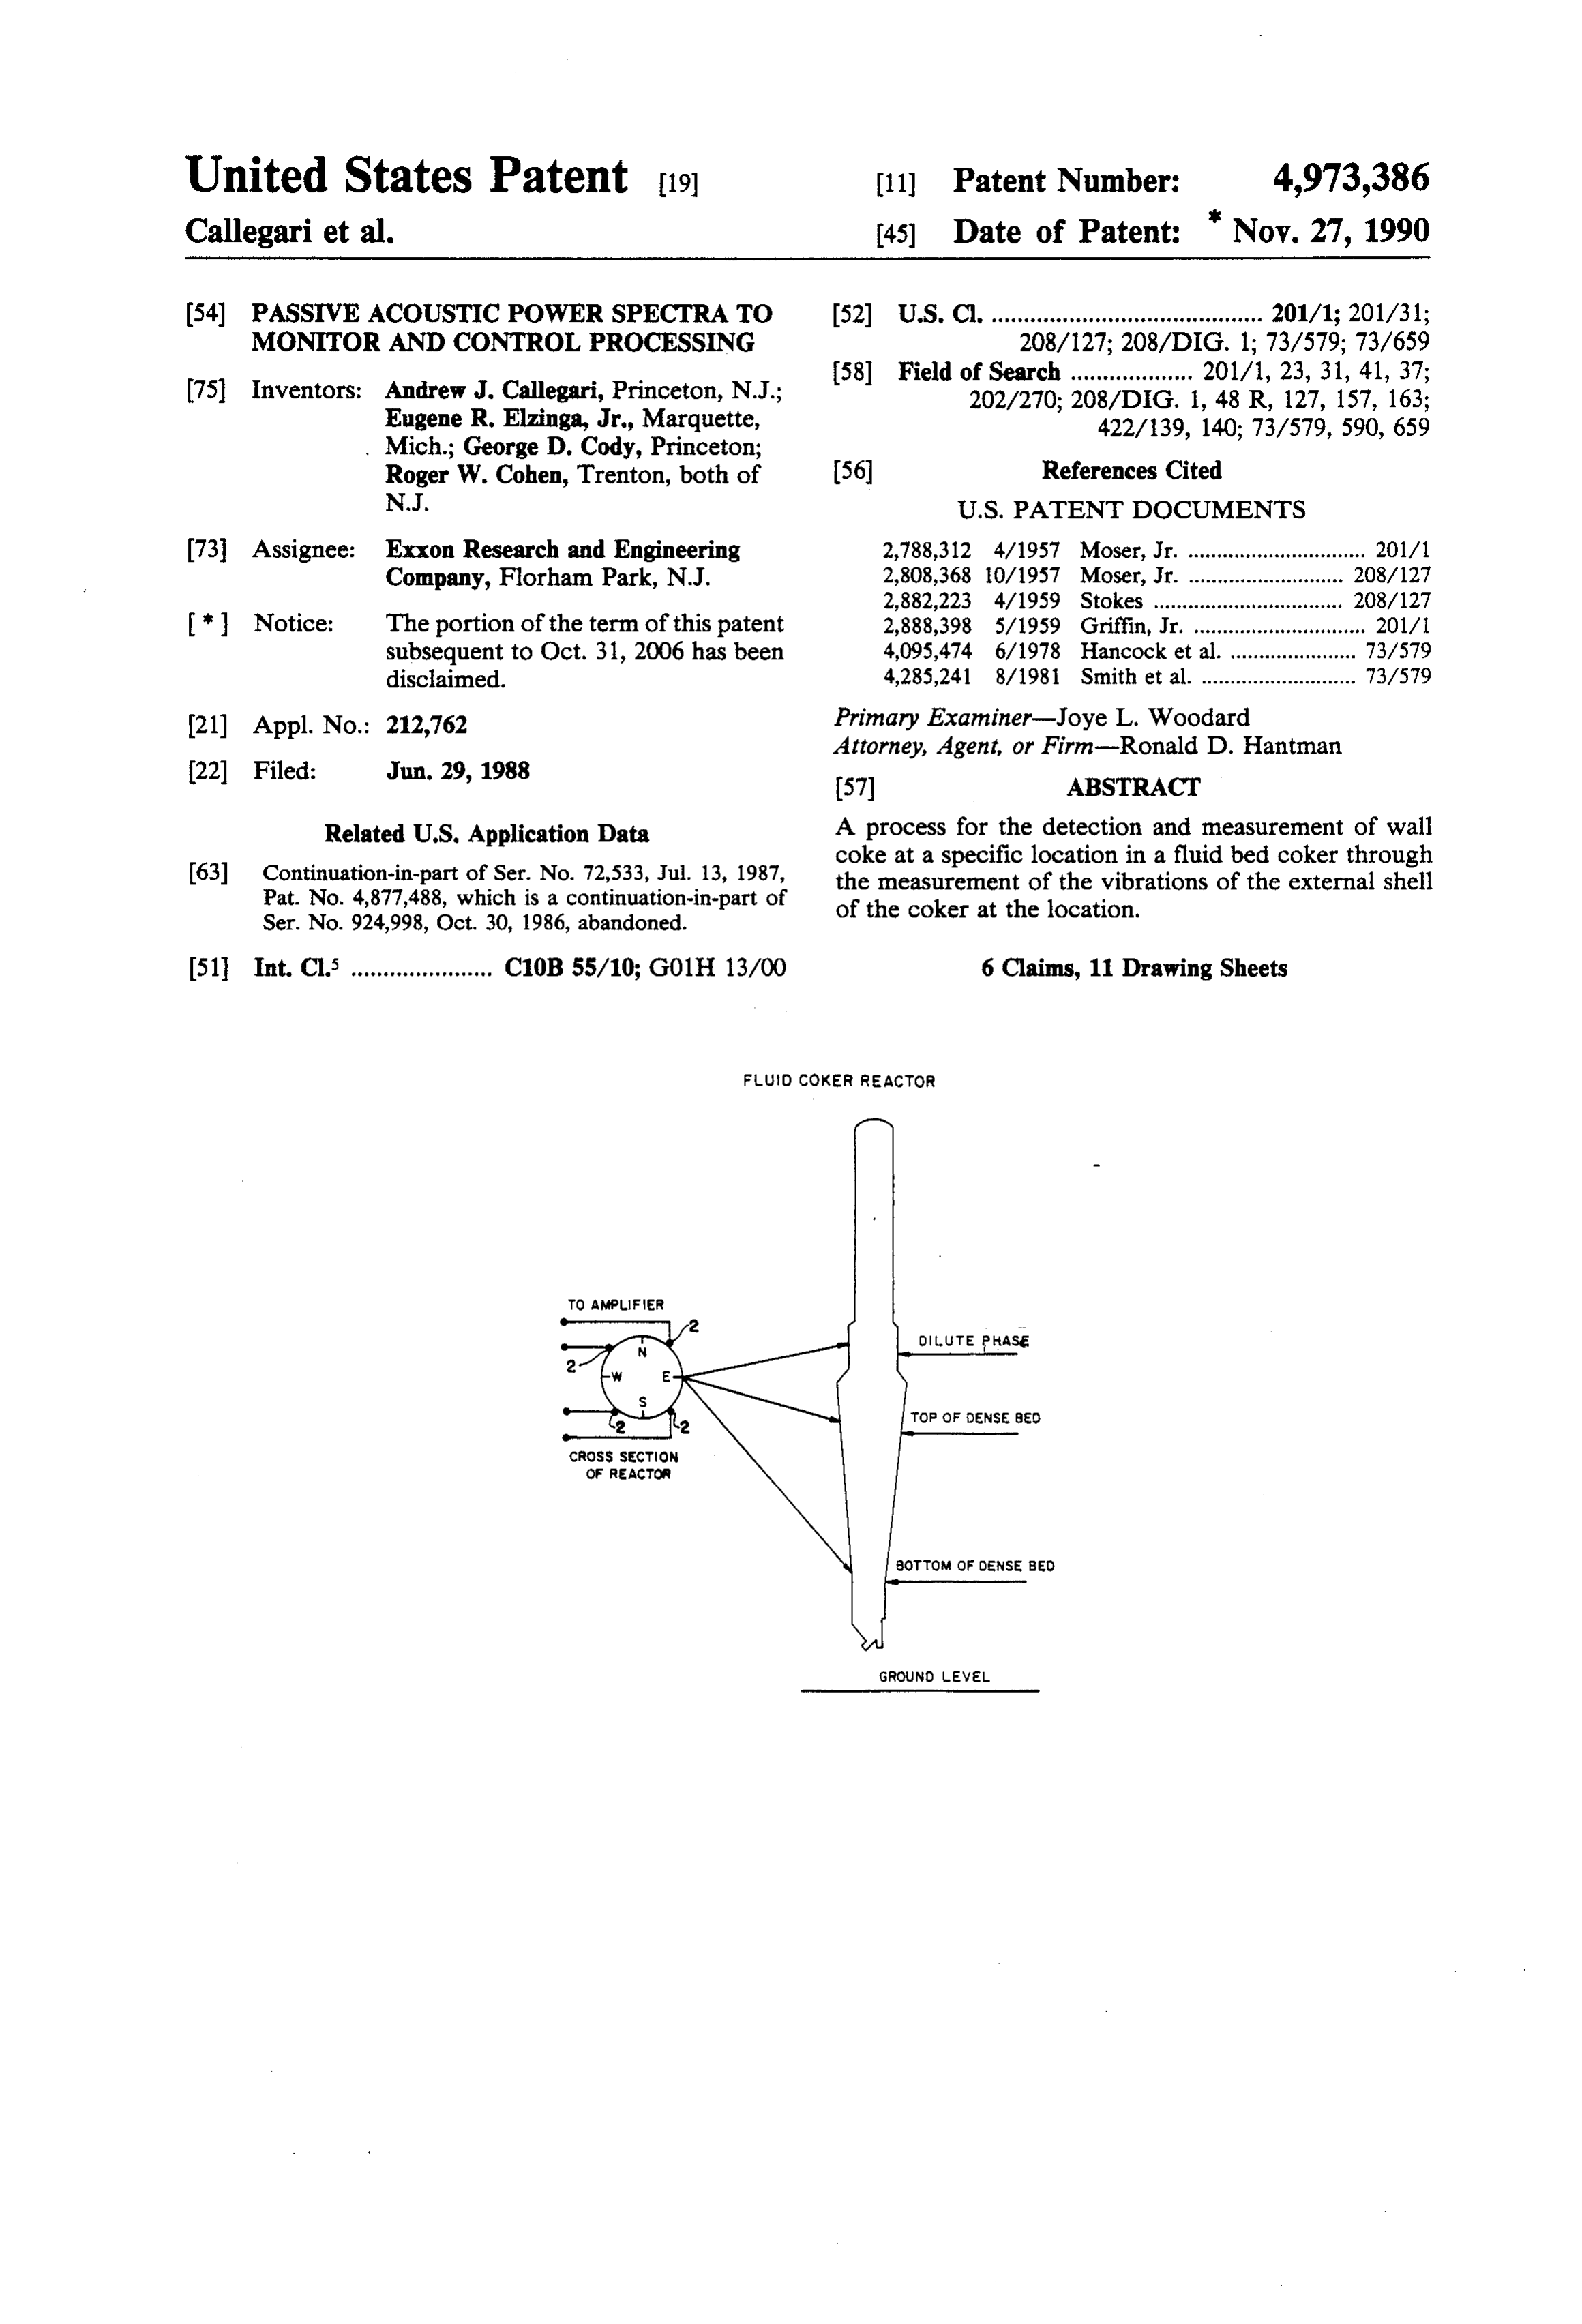
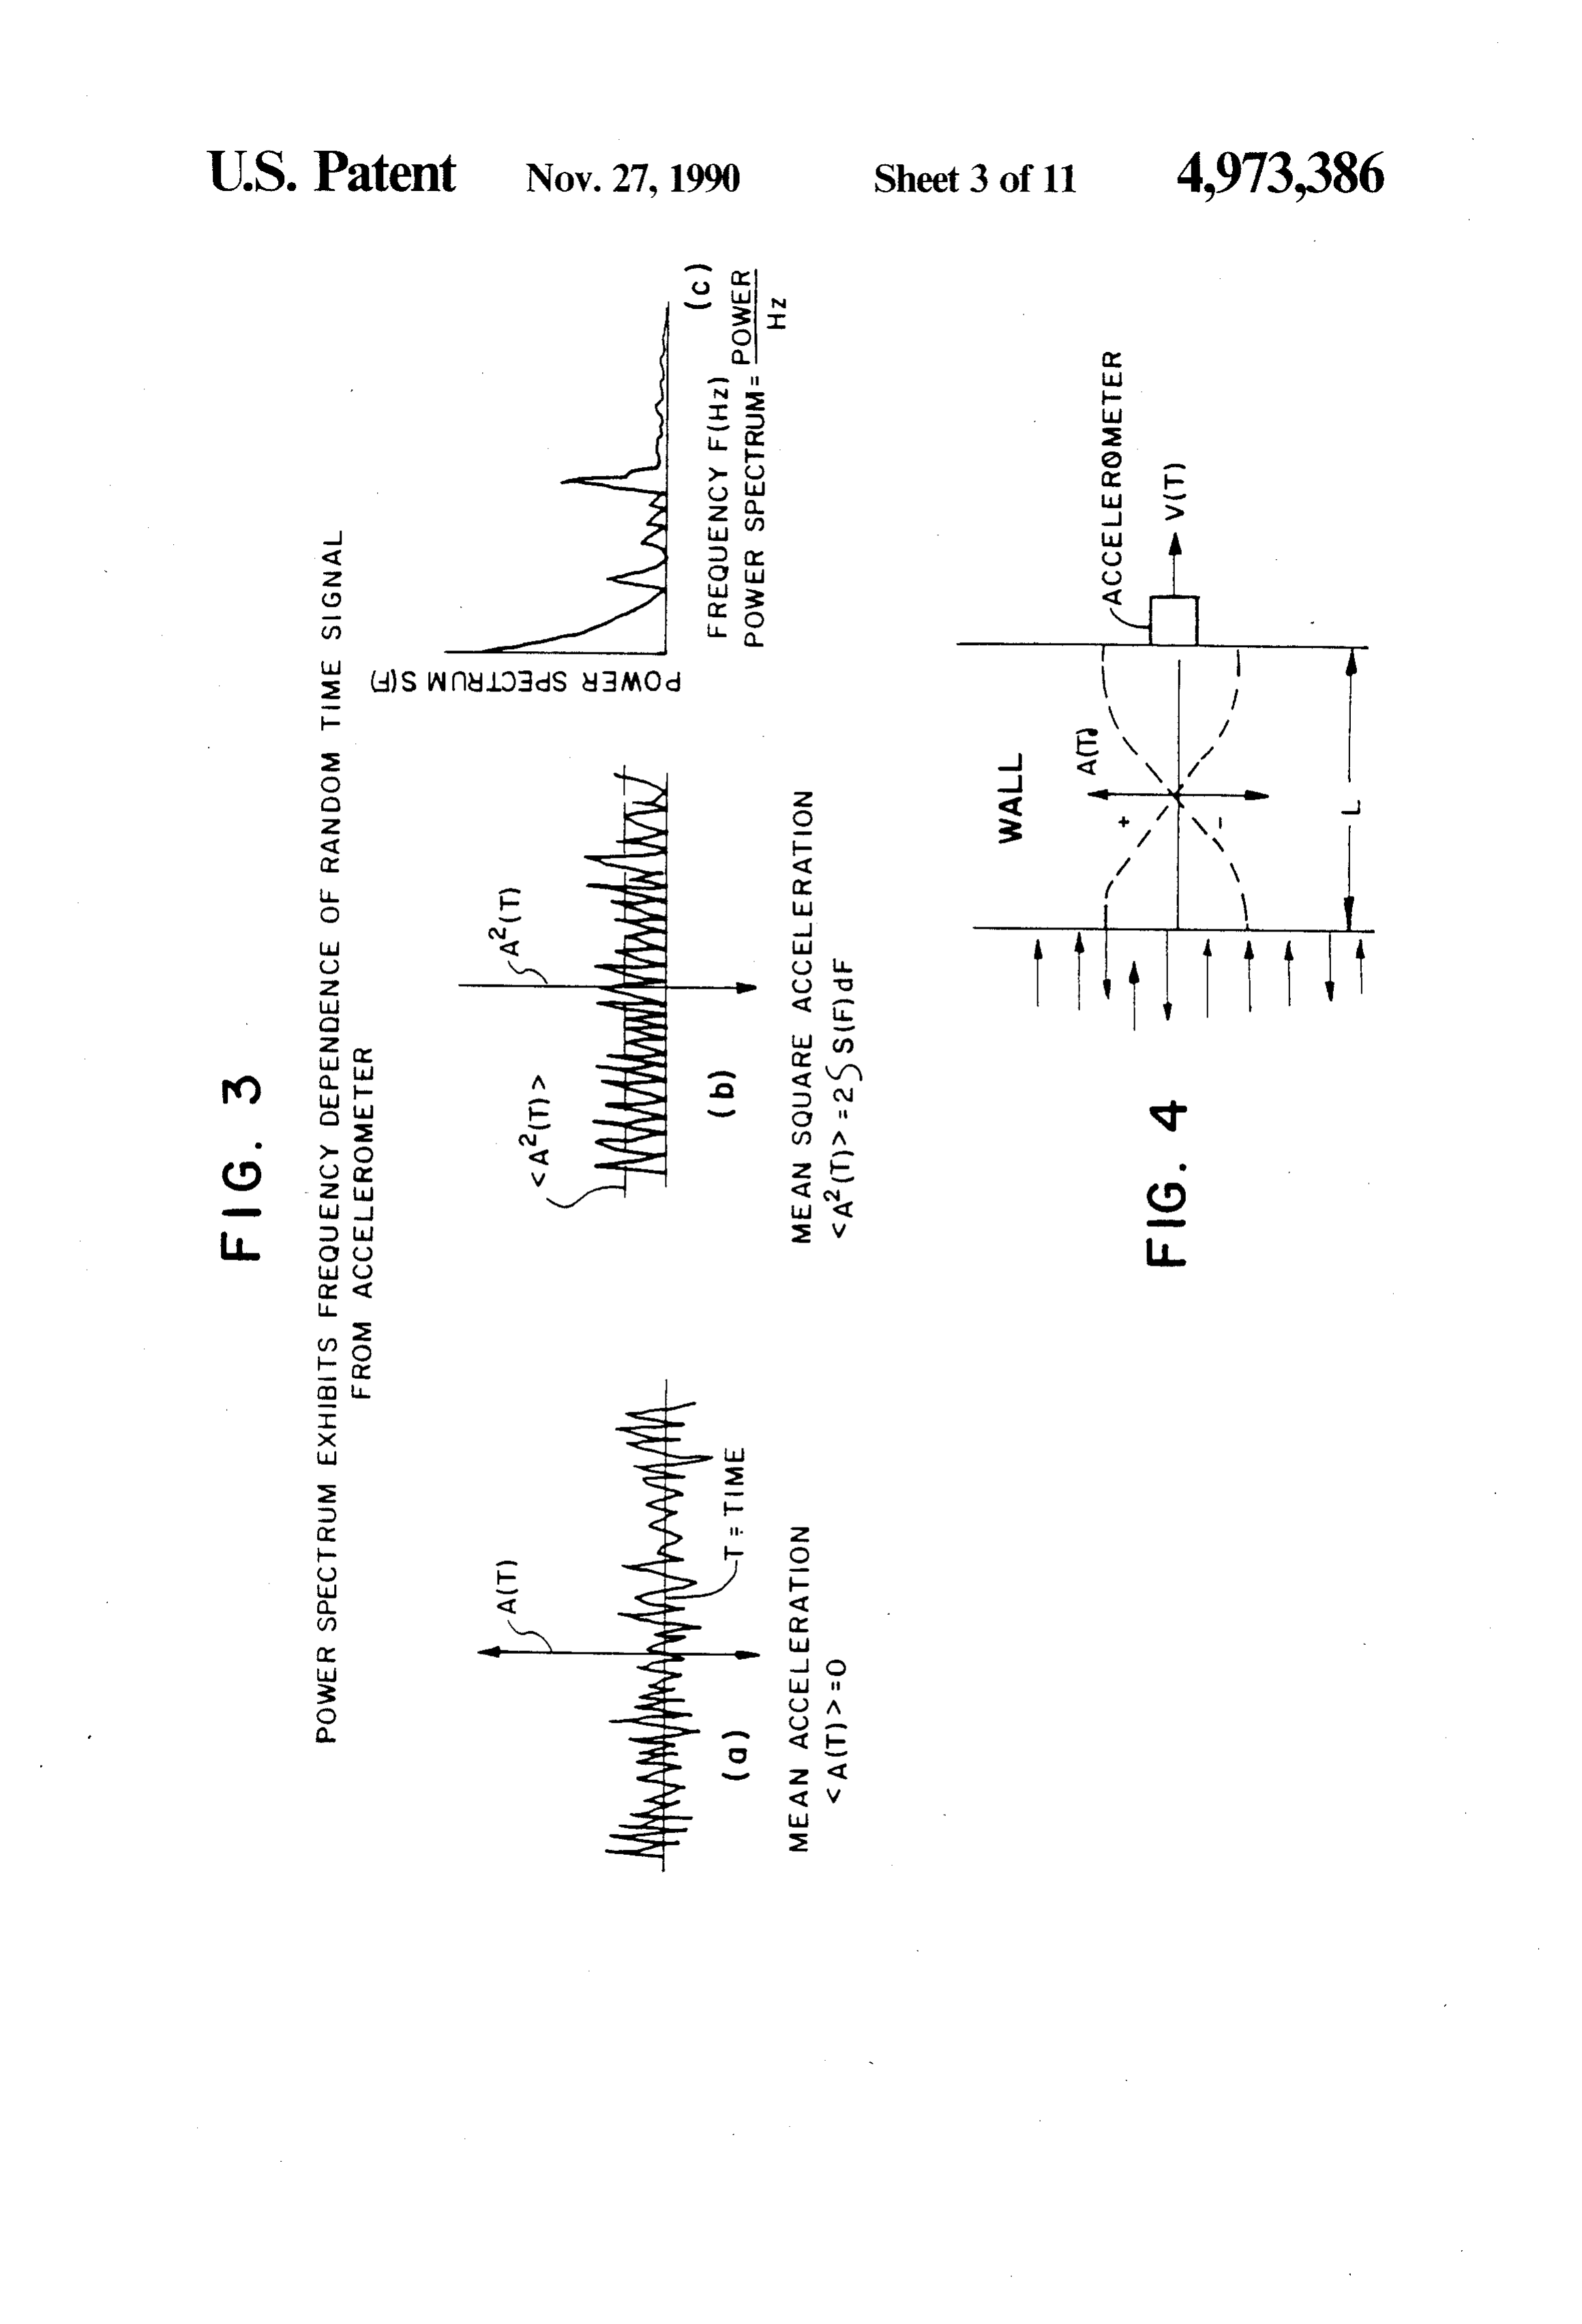
FIG. 1 is a schematic of a fluid bed coker reactor and a B and K 2635) to a voltage output which is again indicates the location of accelerometers to determine proportional to the normal acceleration processor (B wall coke thickness. and K. 2032 or equivalent) to produce the power spec FIG. 2 shows the placement of a single accelerometer trum of the acceleration. The output of the signal pro for measuring the wall acceleration normal to the plane 15 cessor is fed to a PC which, by a suitable algorithm, of the wall. The arrows represent the normal velocity of determines the frequency of the wall resonance peak coke particles striking and rebounding from the internal and its shift with respect to a reference value. The out surface of the wall. put of the PC is a display which exhibits the distribution FIGS. 3(a), 3(b), and 3(c) show how the time varying of coke buildup at selected location on the interior wall wall acceleration is coverted to a power spectrum. FIG. 20 of the coker in real time.
3(a) shows the mean acceleration as a function of time. FIGS. 3(a), 3(b), and 3(c) exhibit the relationship FIG. 3(b) shows the mean square acceleration as a func between the acceleration and its square as a function of tion of time. FIG. 3(c) shows the power spectrum as a time and as a function of frequency. The Power Spec function of time. trum for a stationary random function of time displays FIG. 4 illustrates how the nodes and antinodes of the 25 the mean square acceleration as a function of frequency. fundamental mode of the compressional mode is posi The area under the Power Spectrum is the mean square tioned in the wall. acceleration.
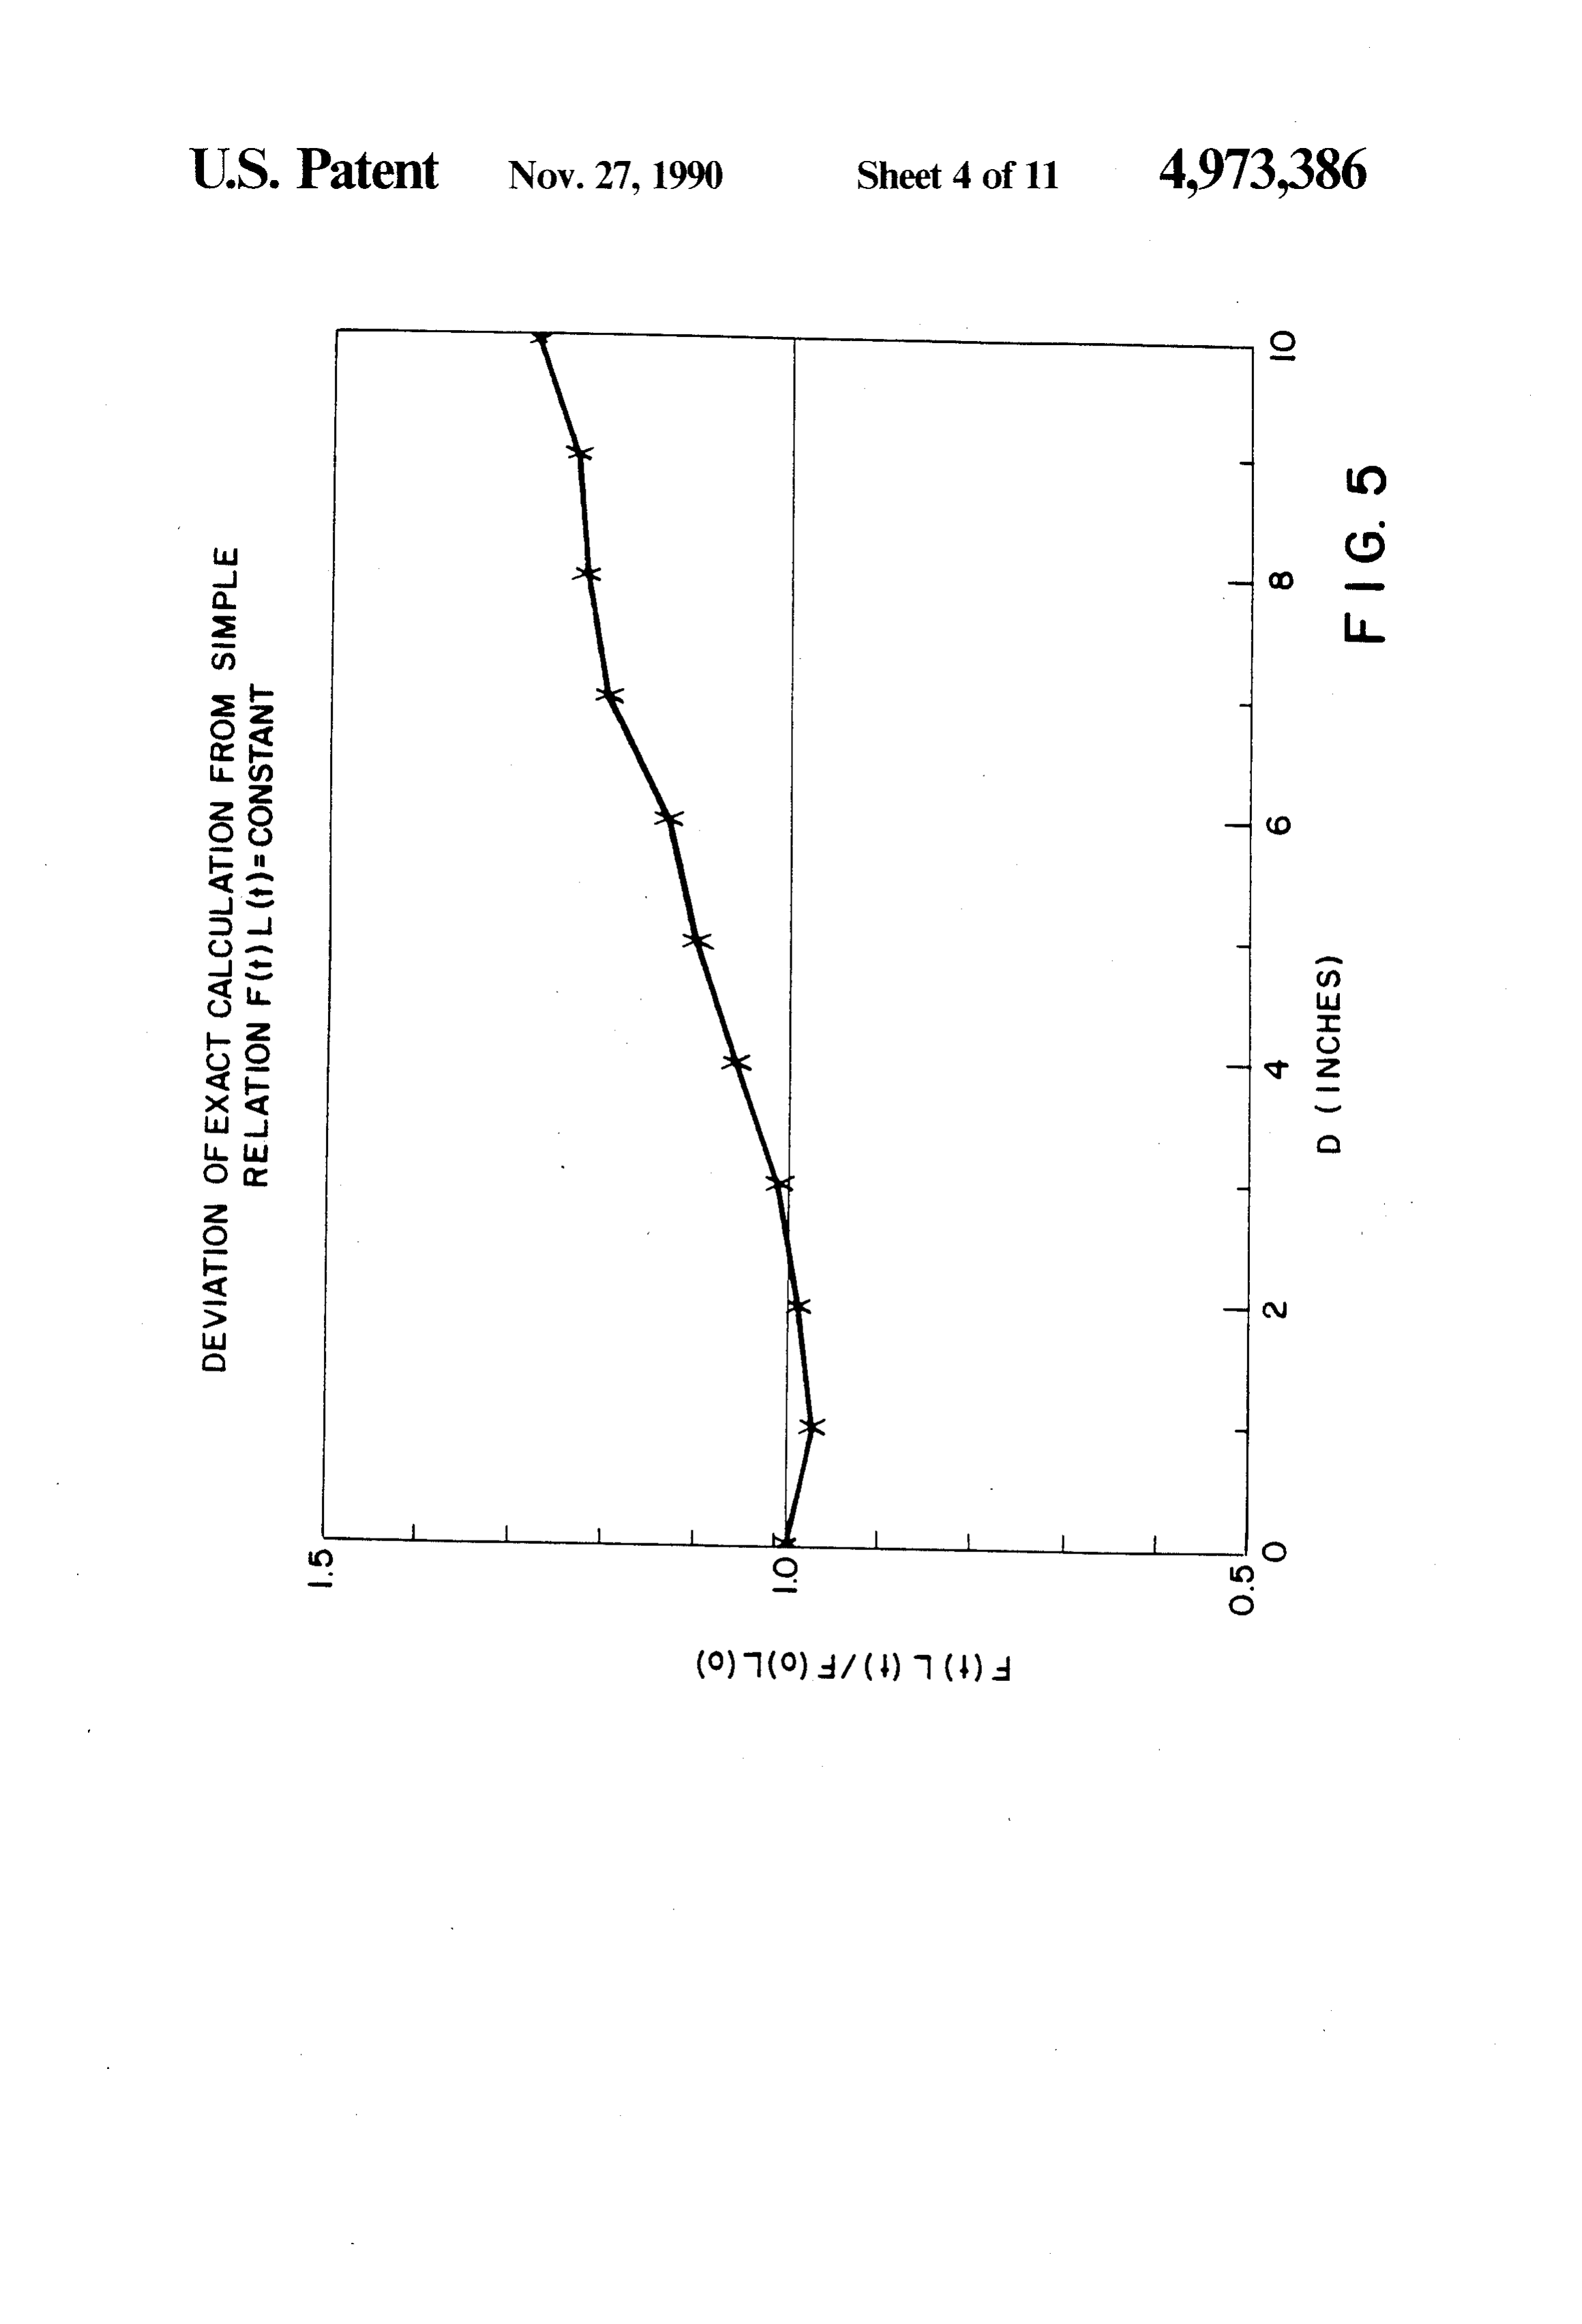
FIG. 5 compares an exact calculation of the fre The acoustic thickness of the coker wall L(t) under quency of the wall resonance as a function of coke the accelerometer at location 'i' at time 't' is deter thickness with the approximate relation give by equa 30 mined from the expression tion 1.
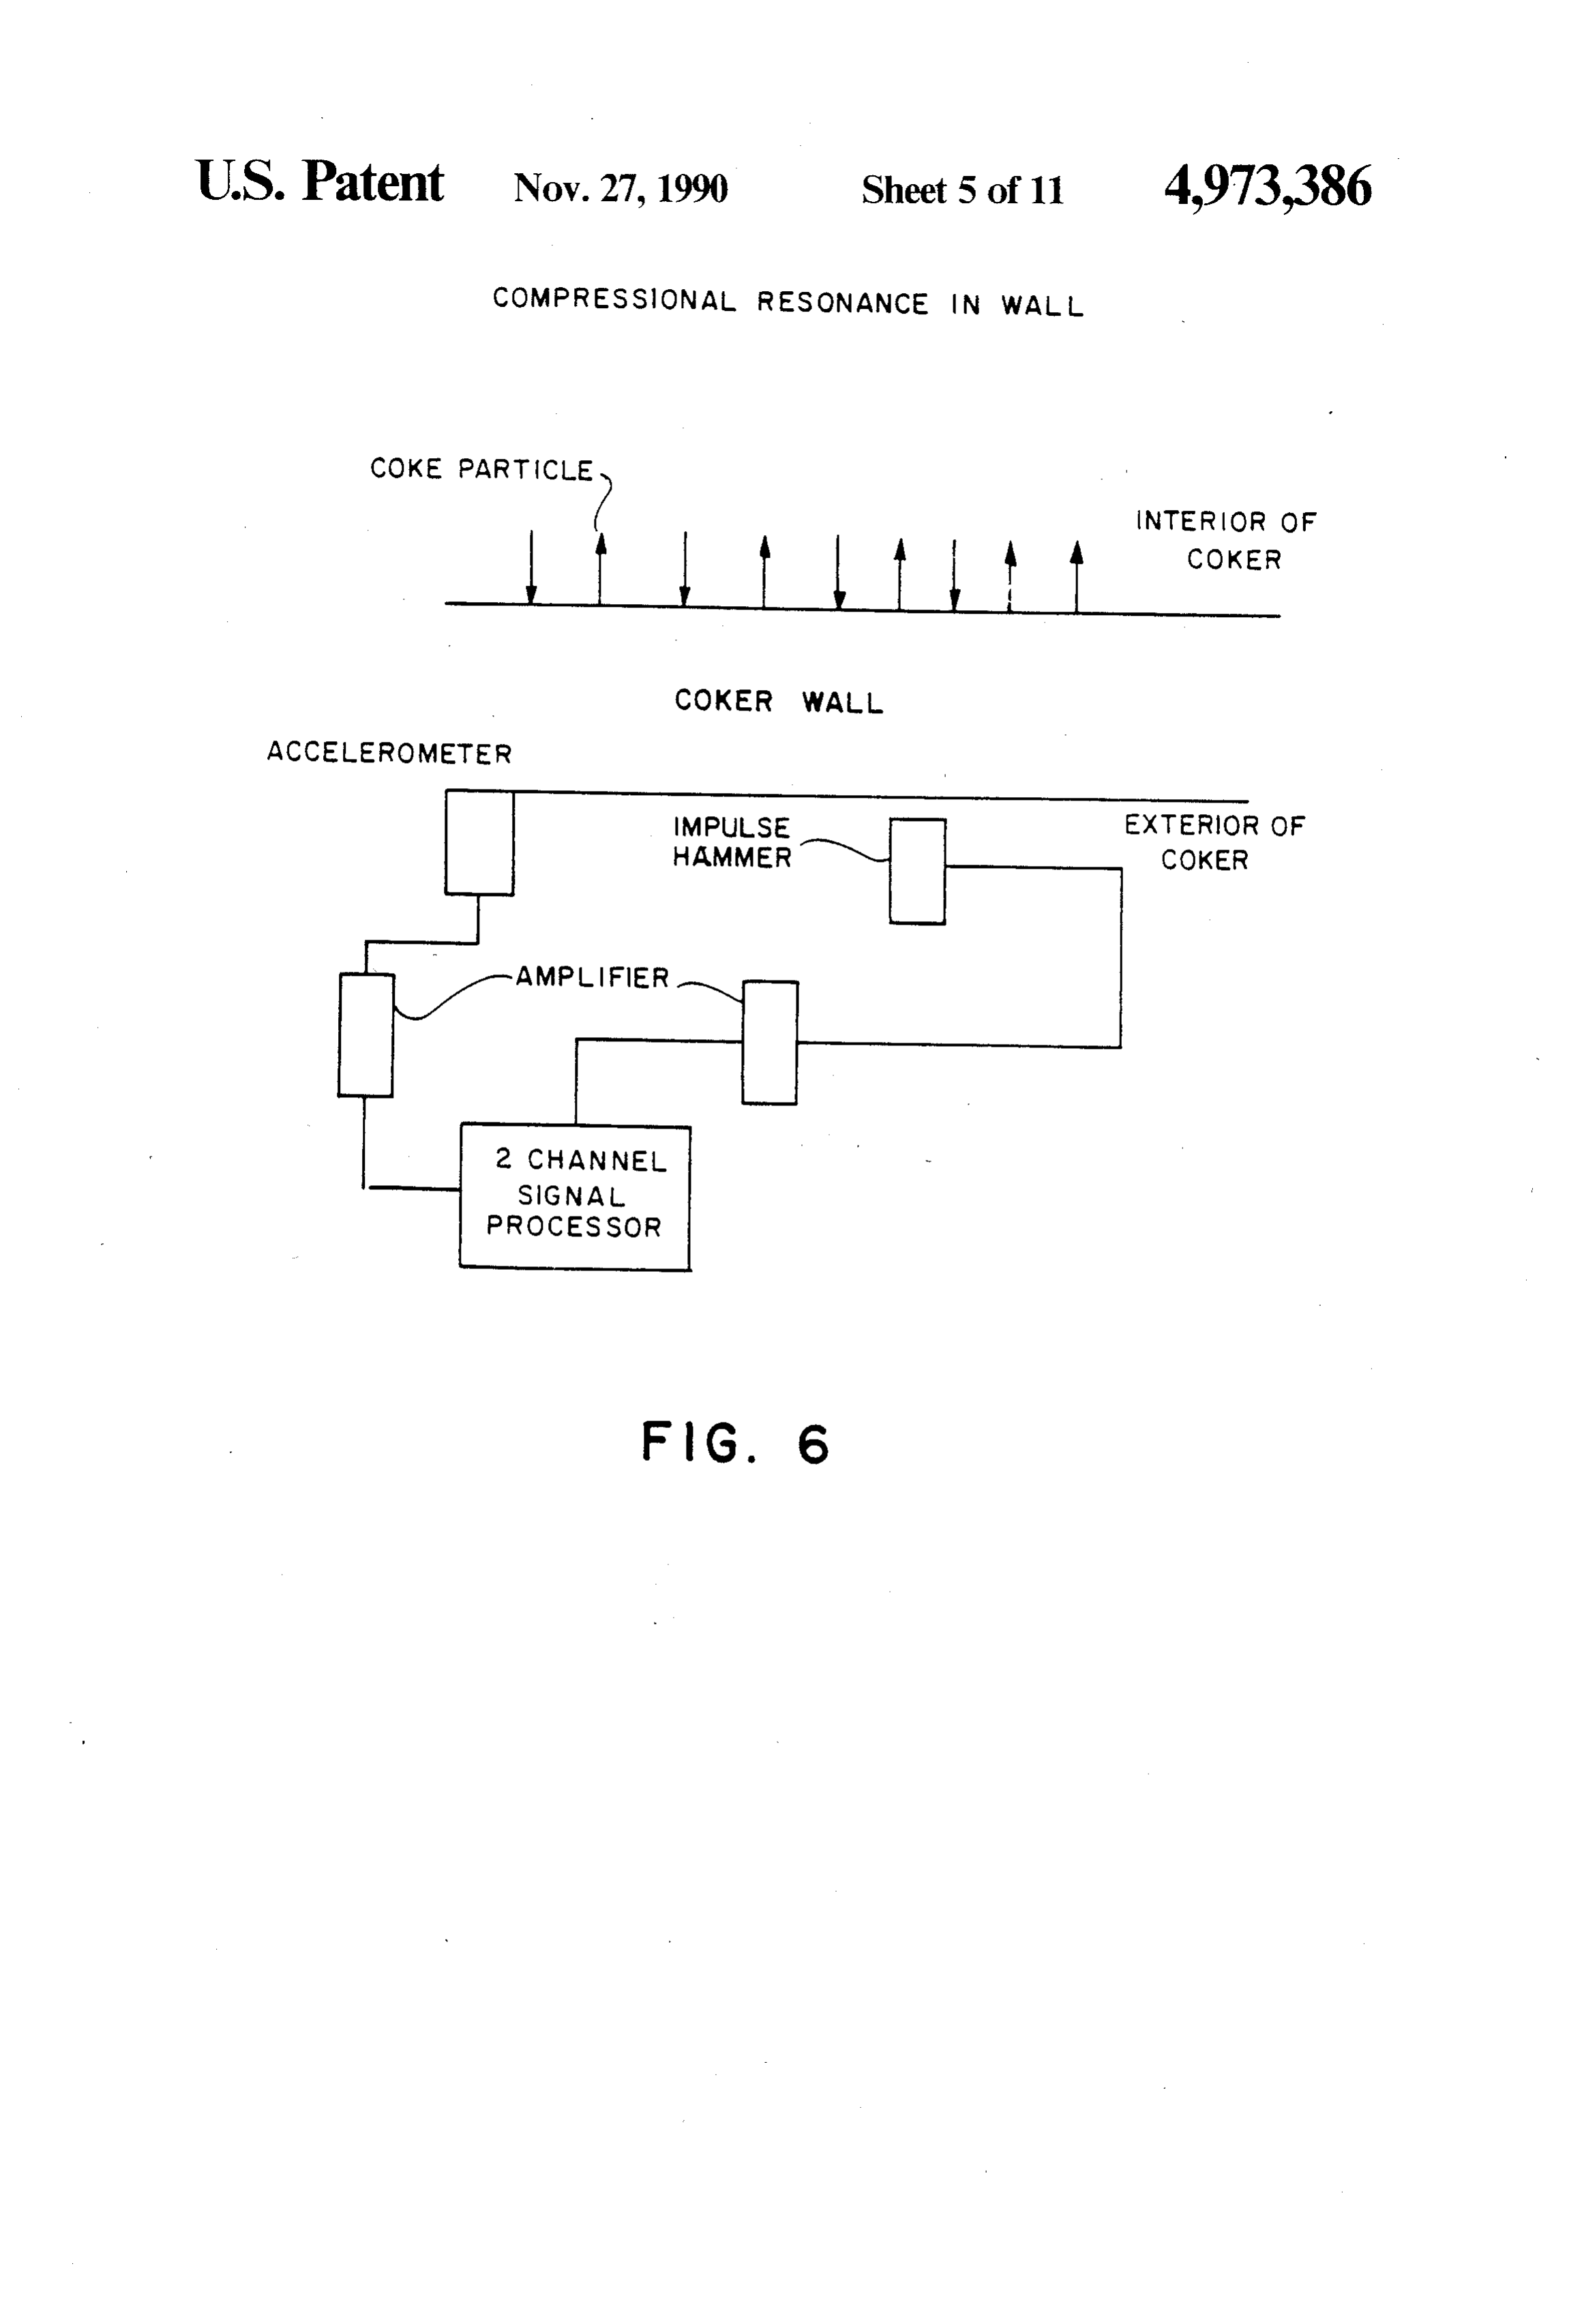
FIG. 6 shows how the wall can be excited either by Li(t) = (o)f(o)/f(t) (1) coke particles or by an impulse hammer.
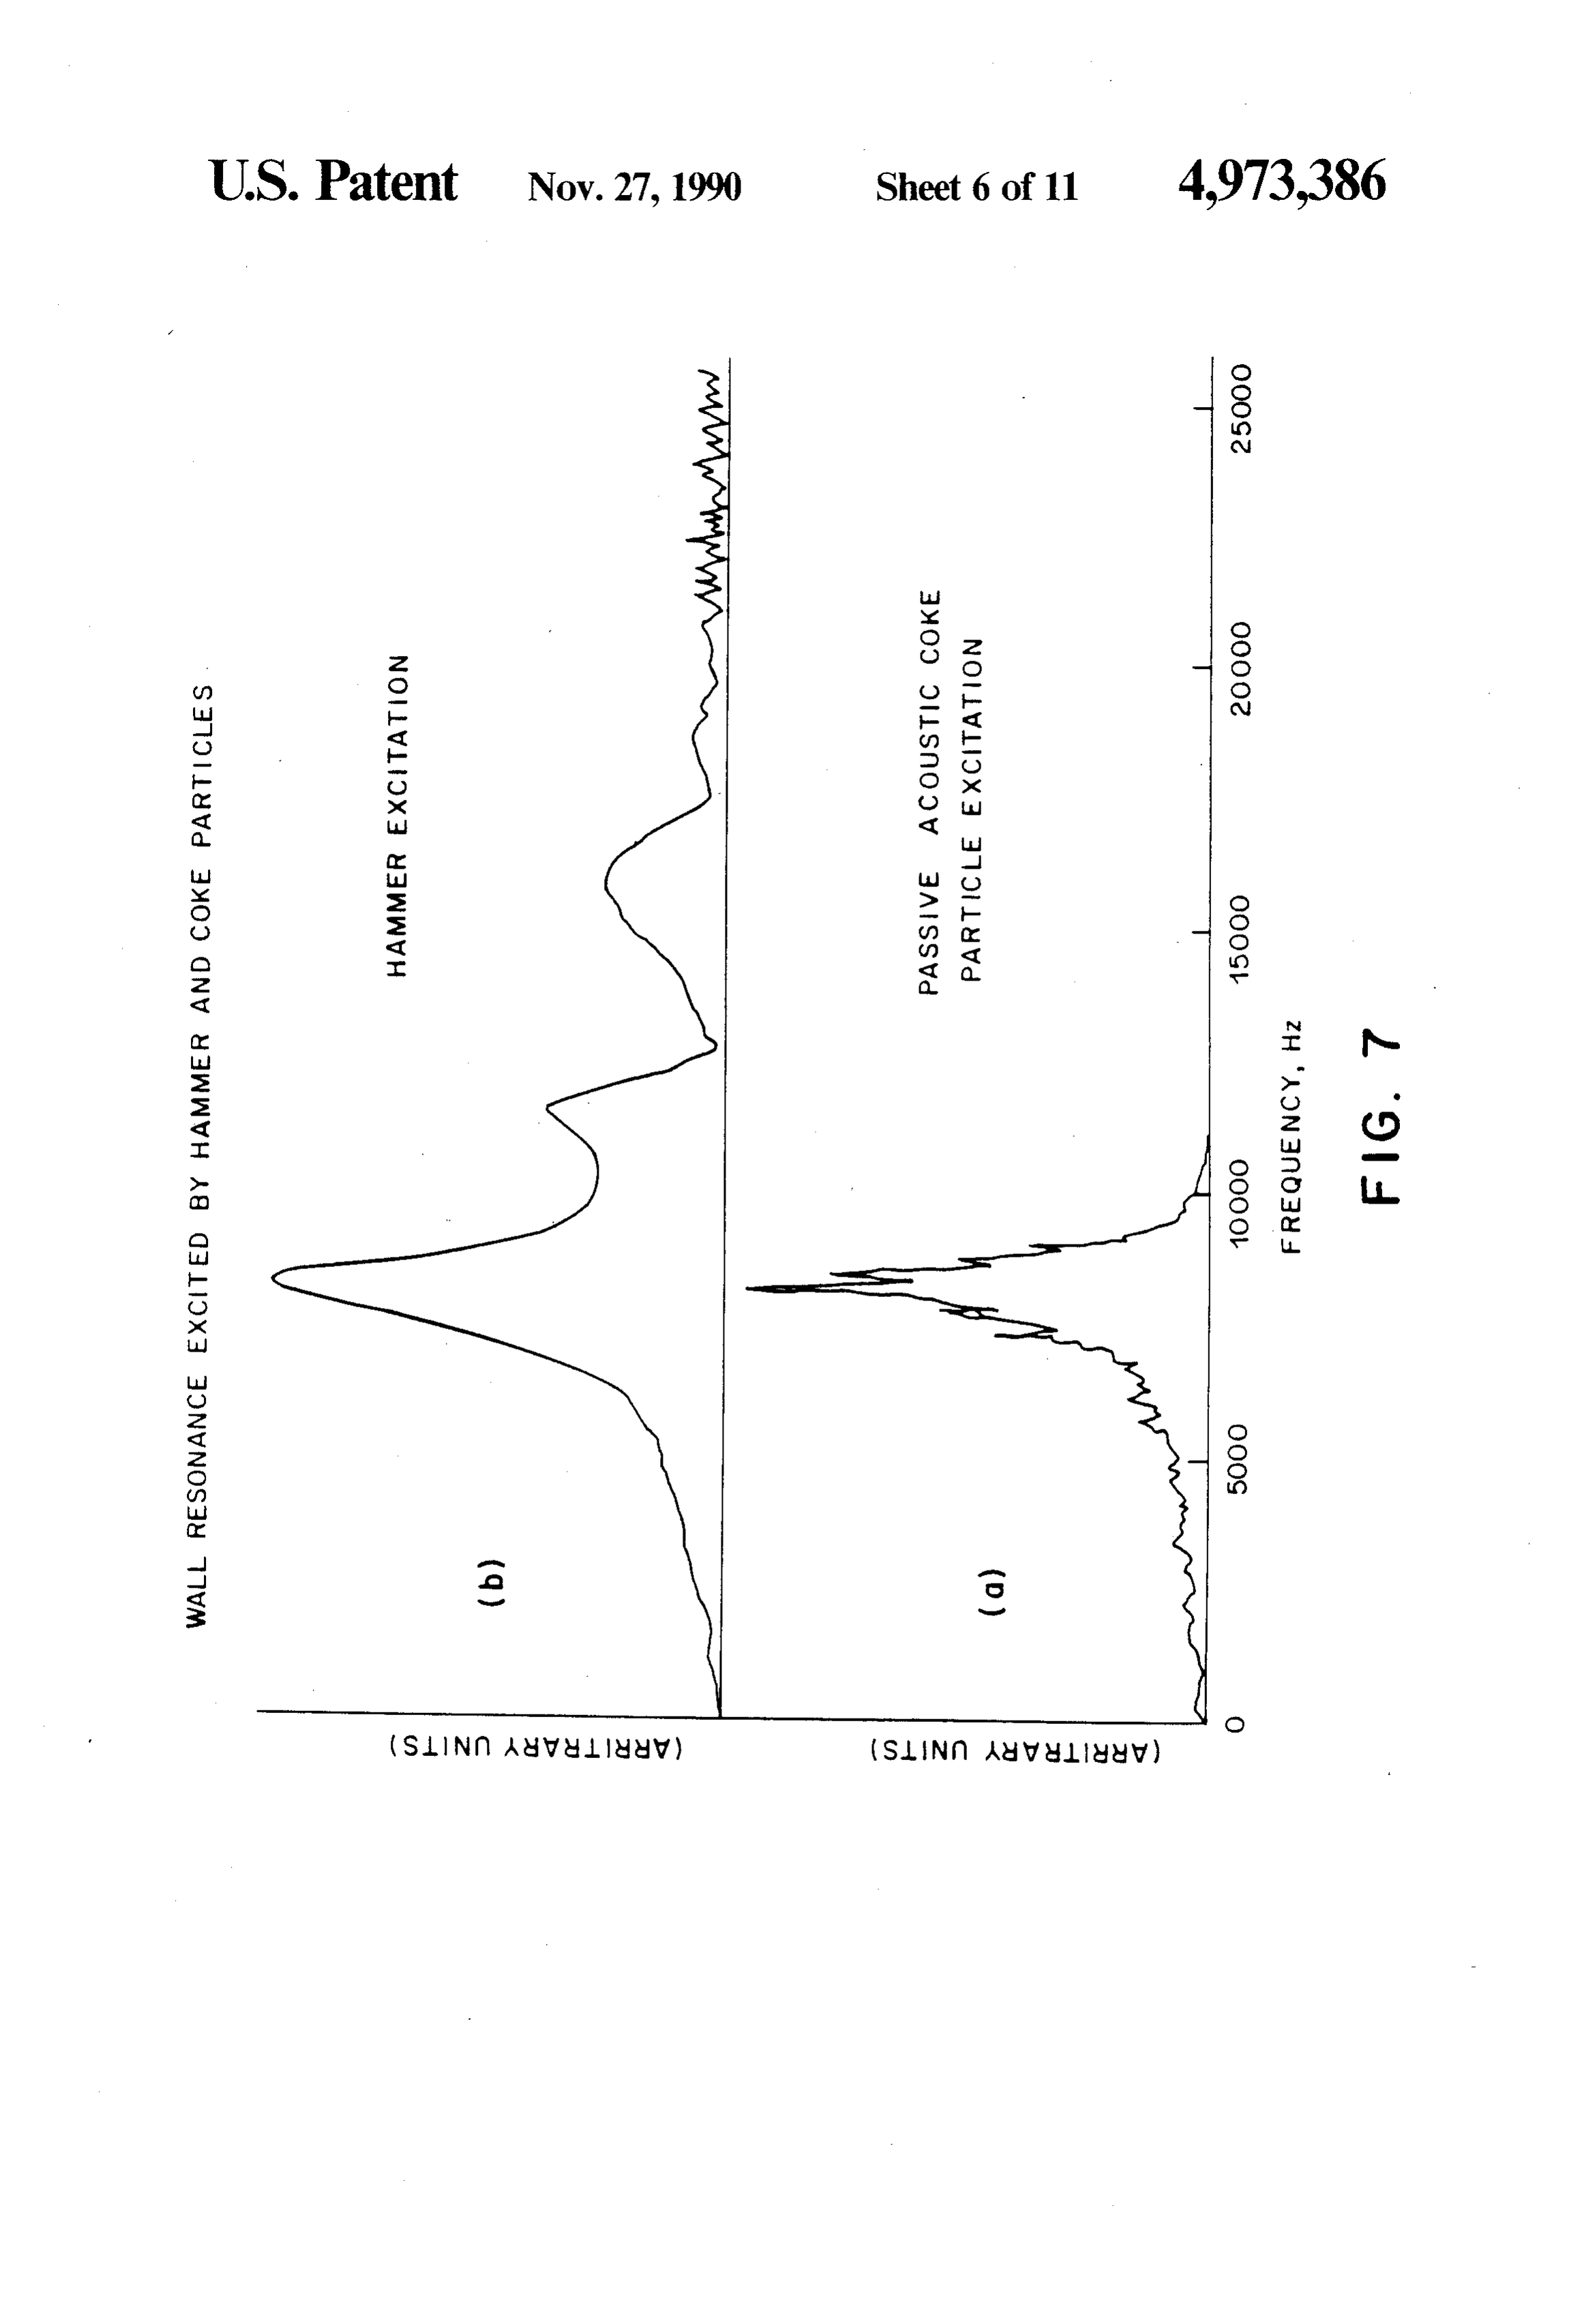
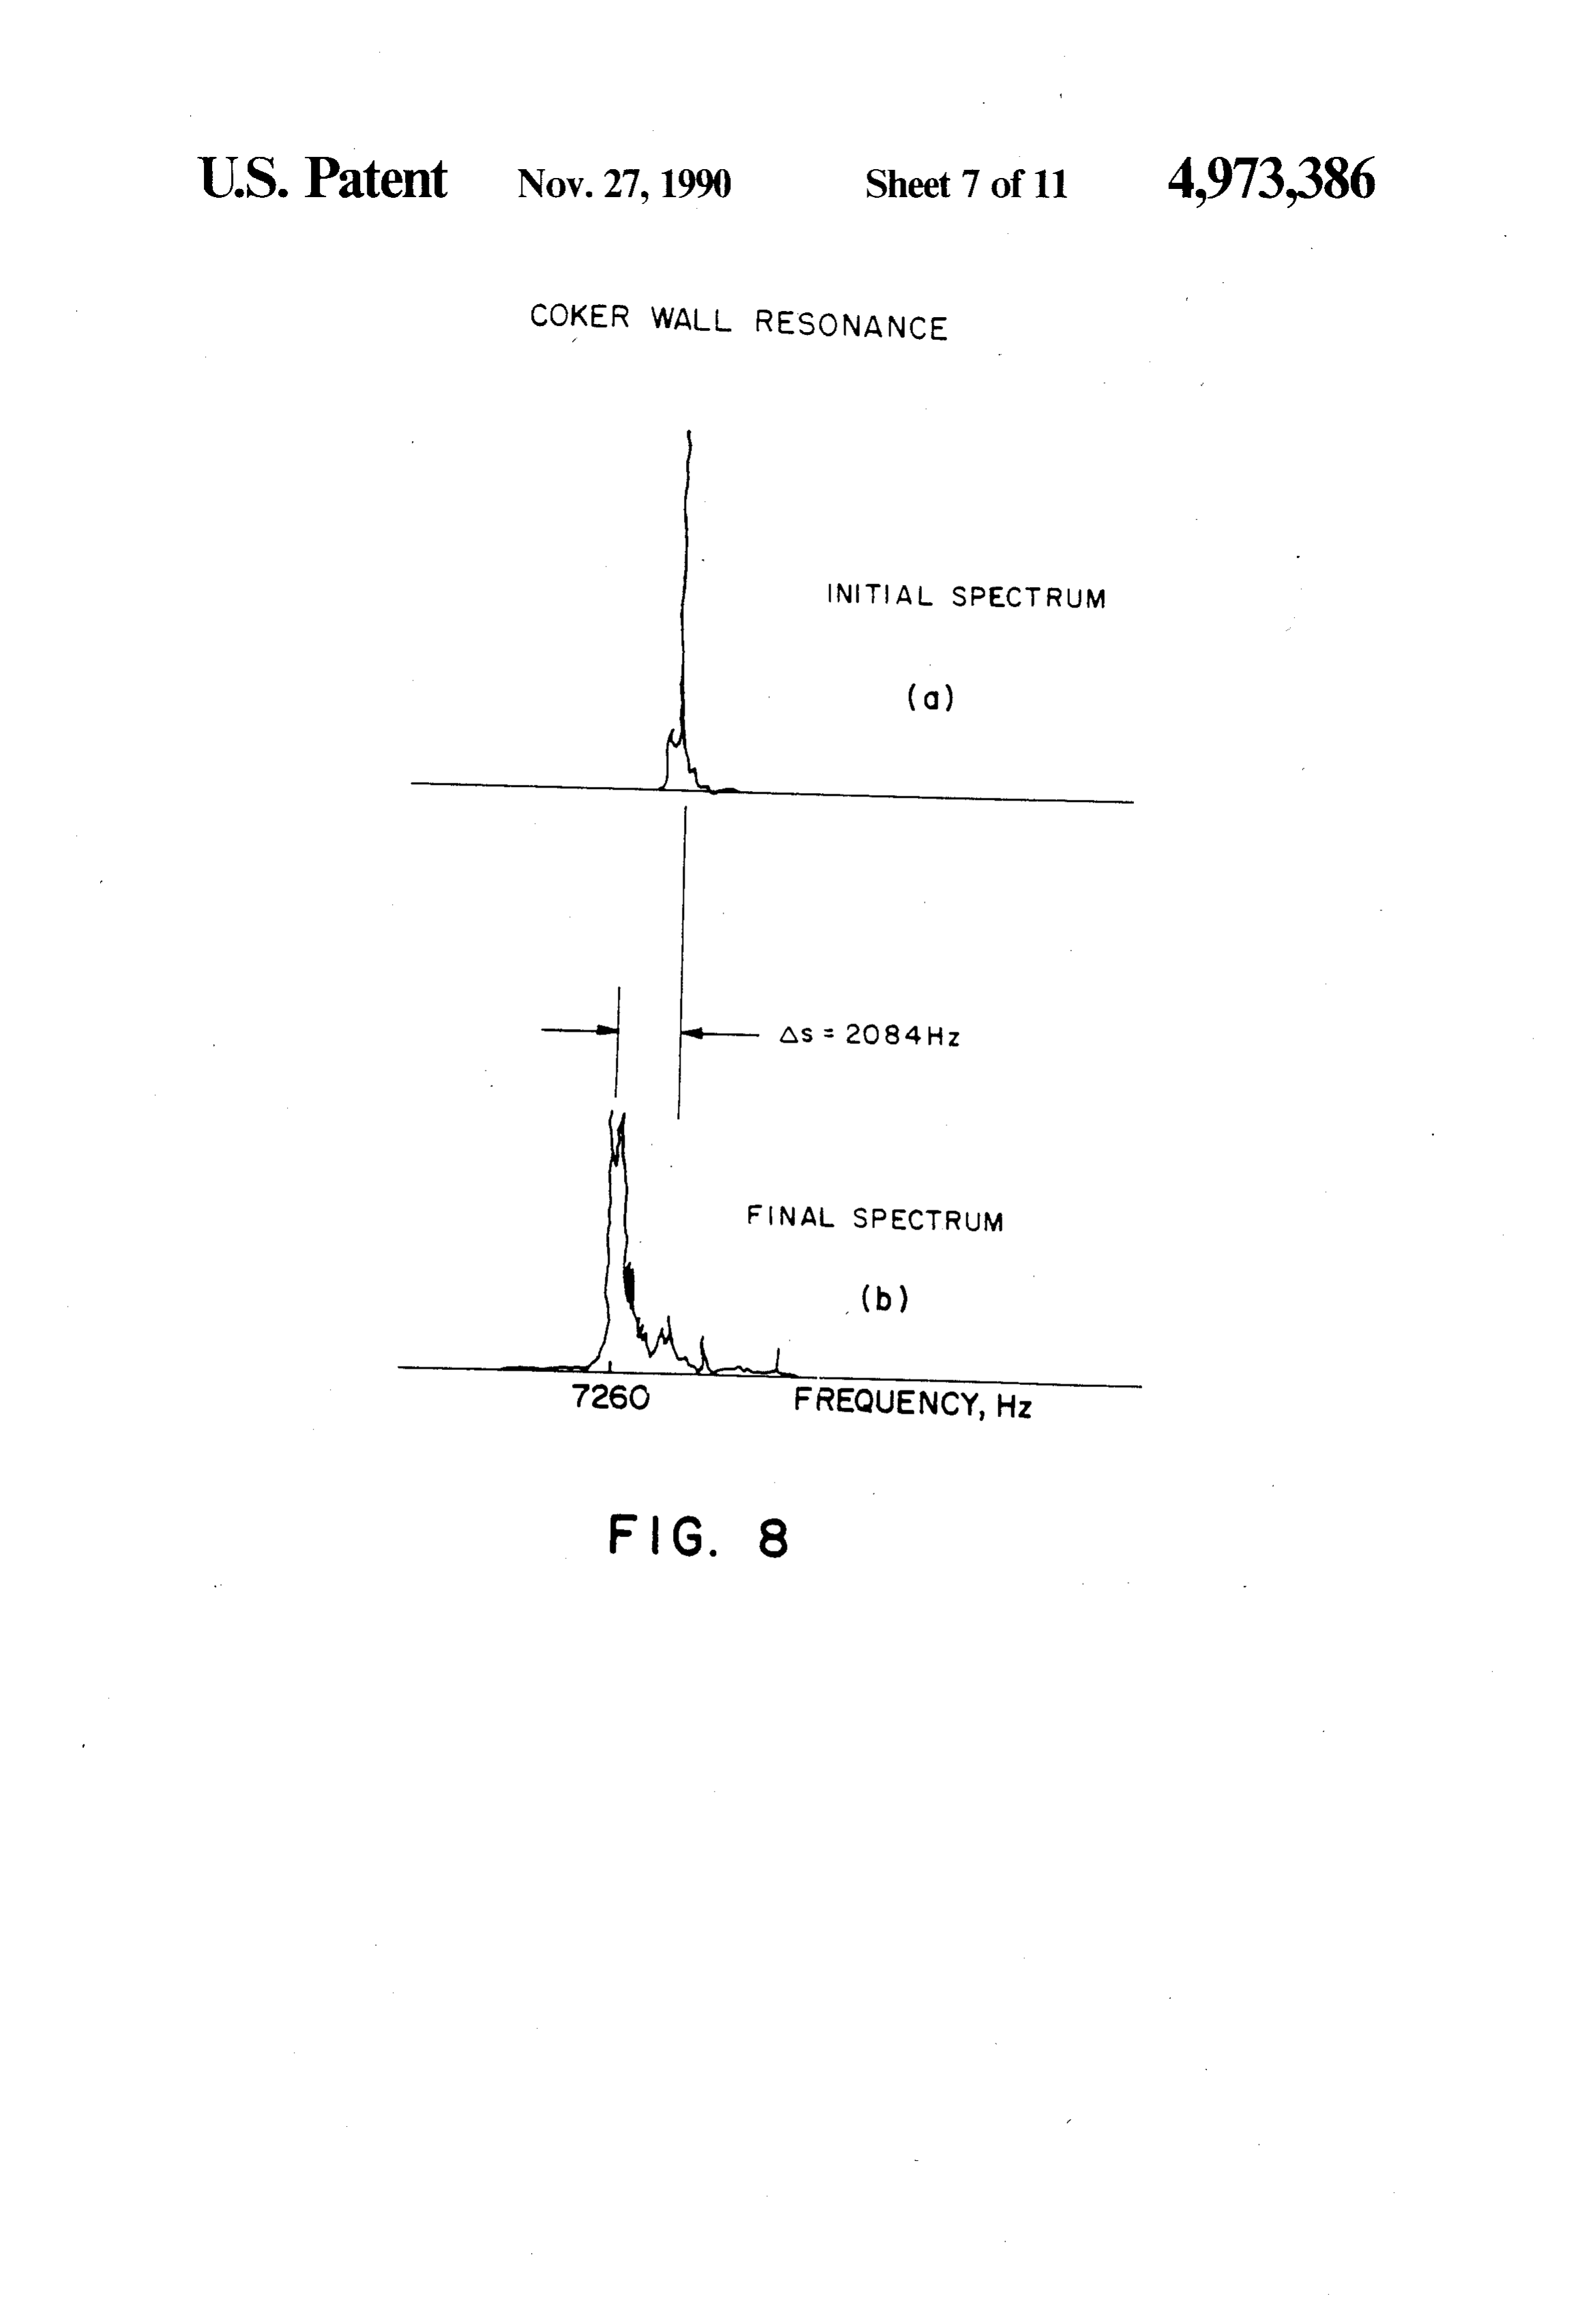
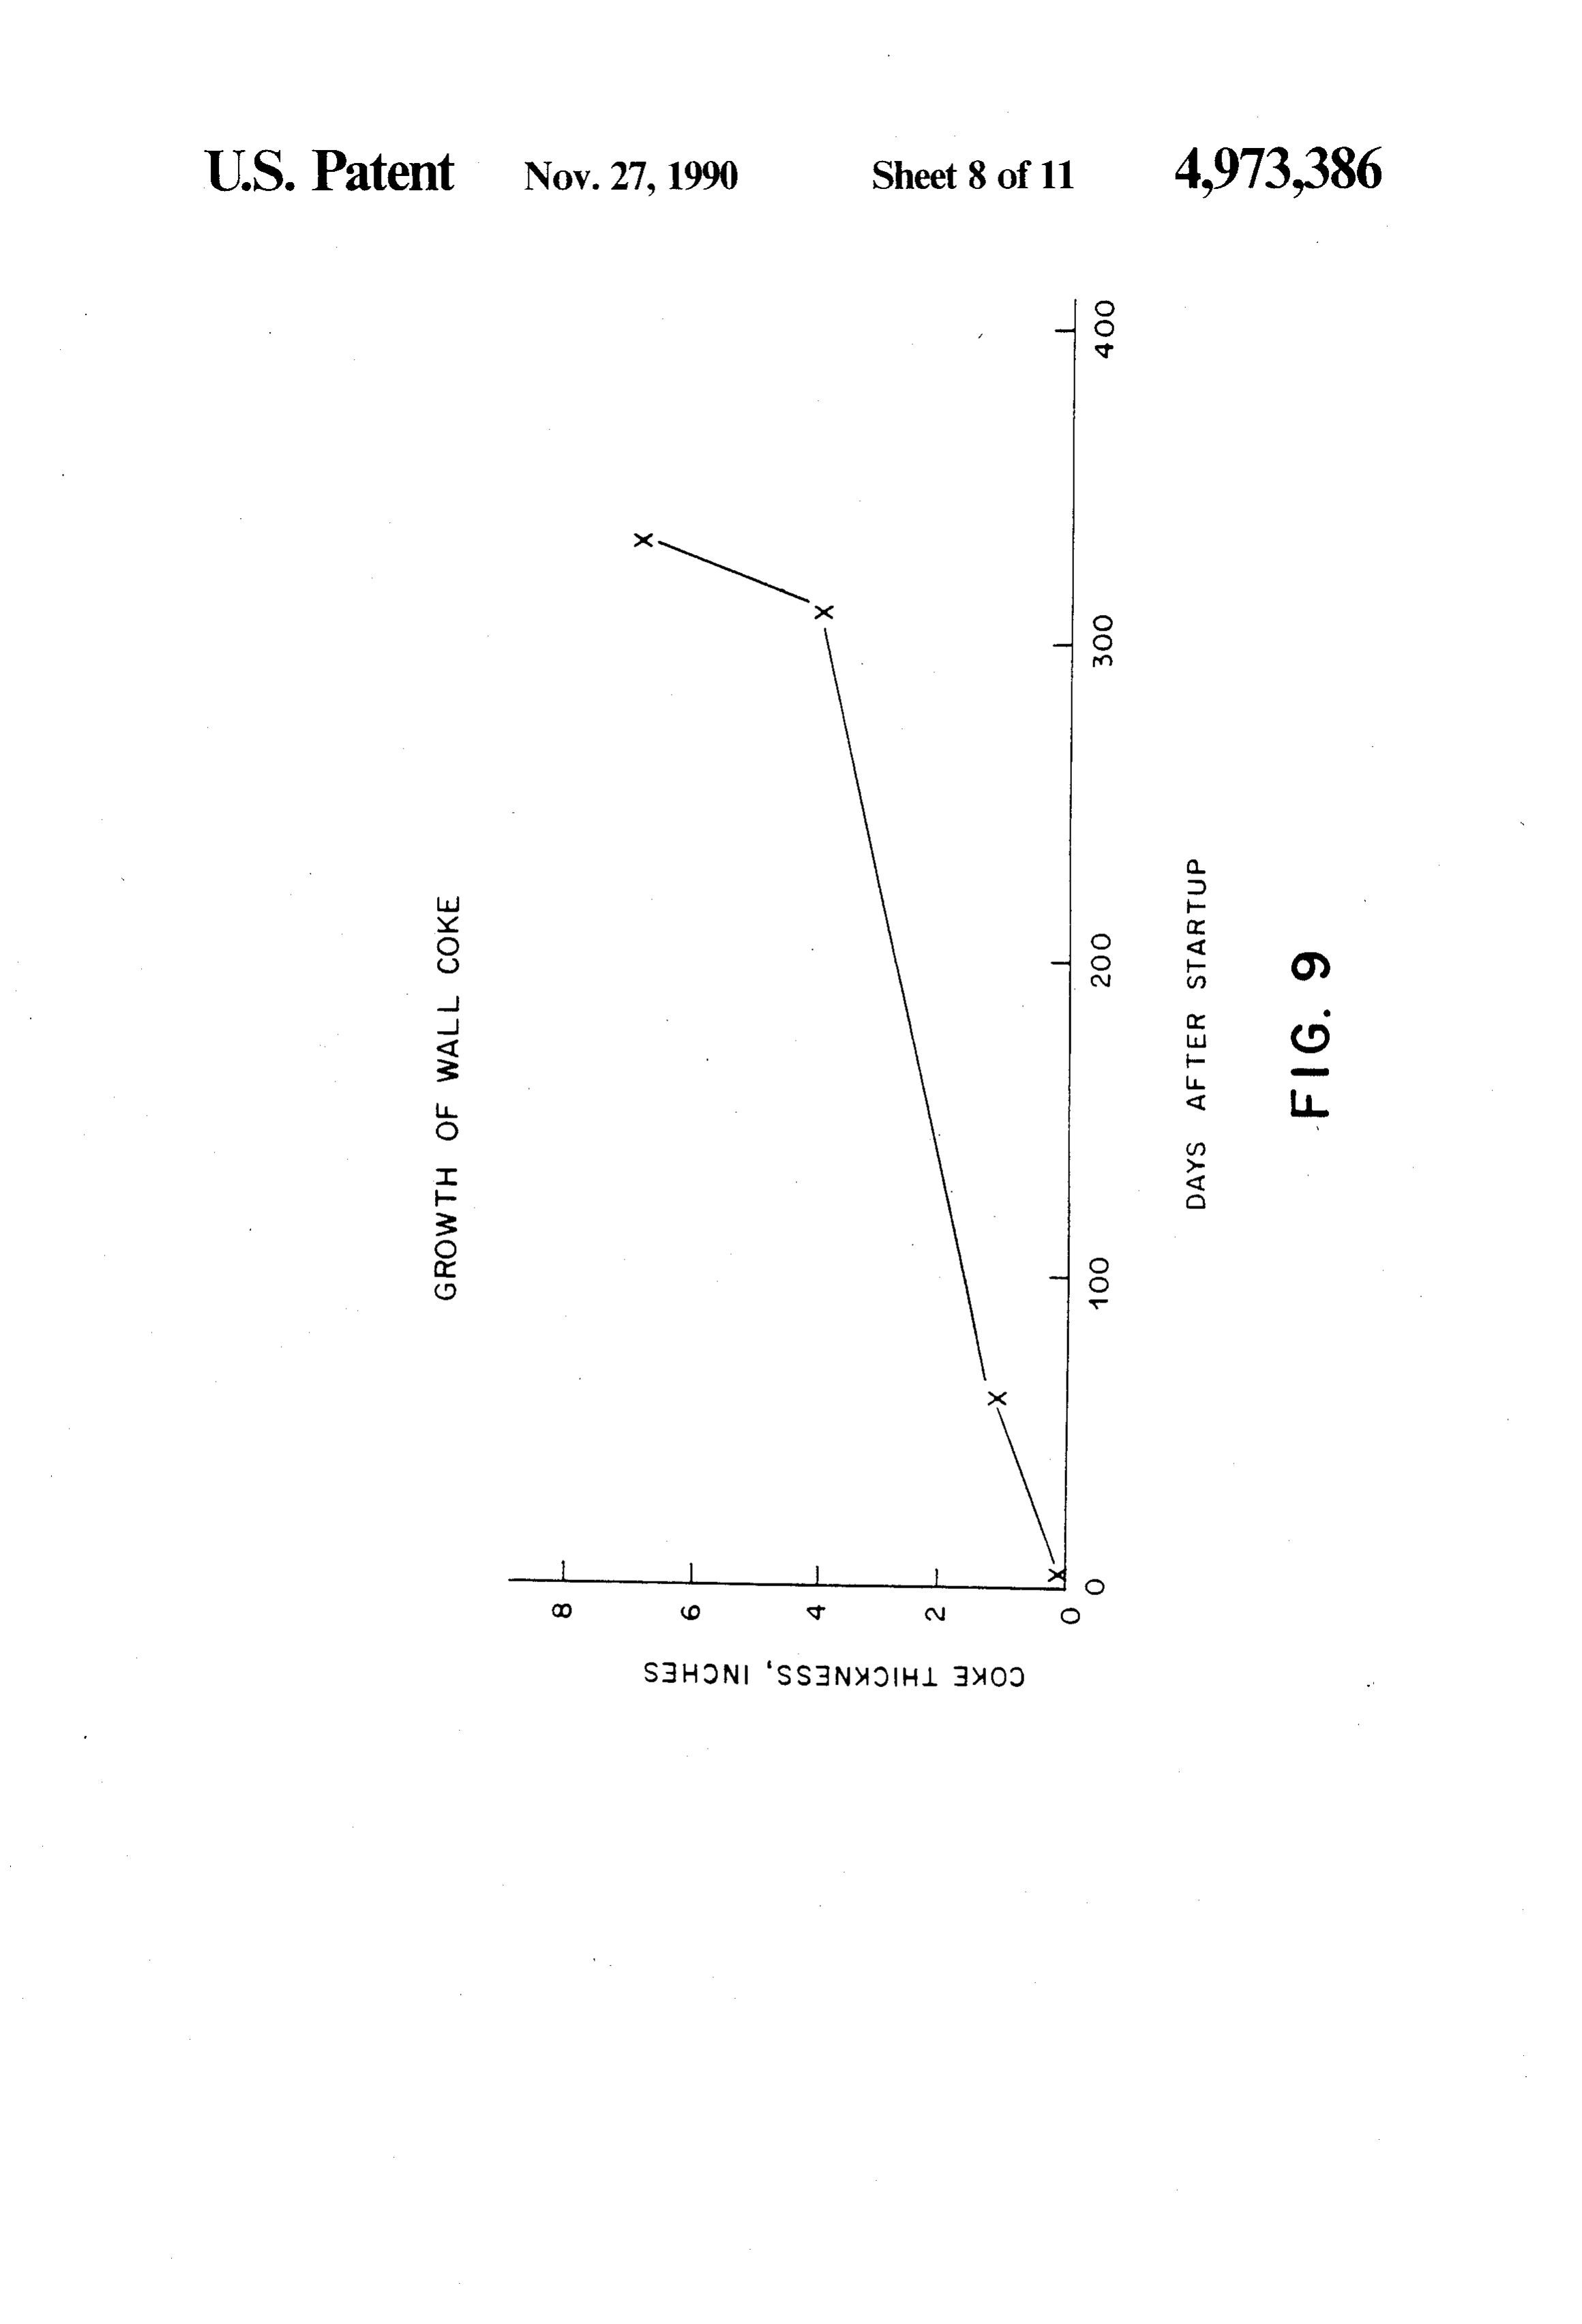
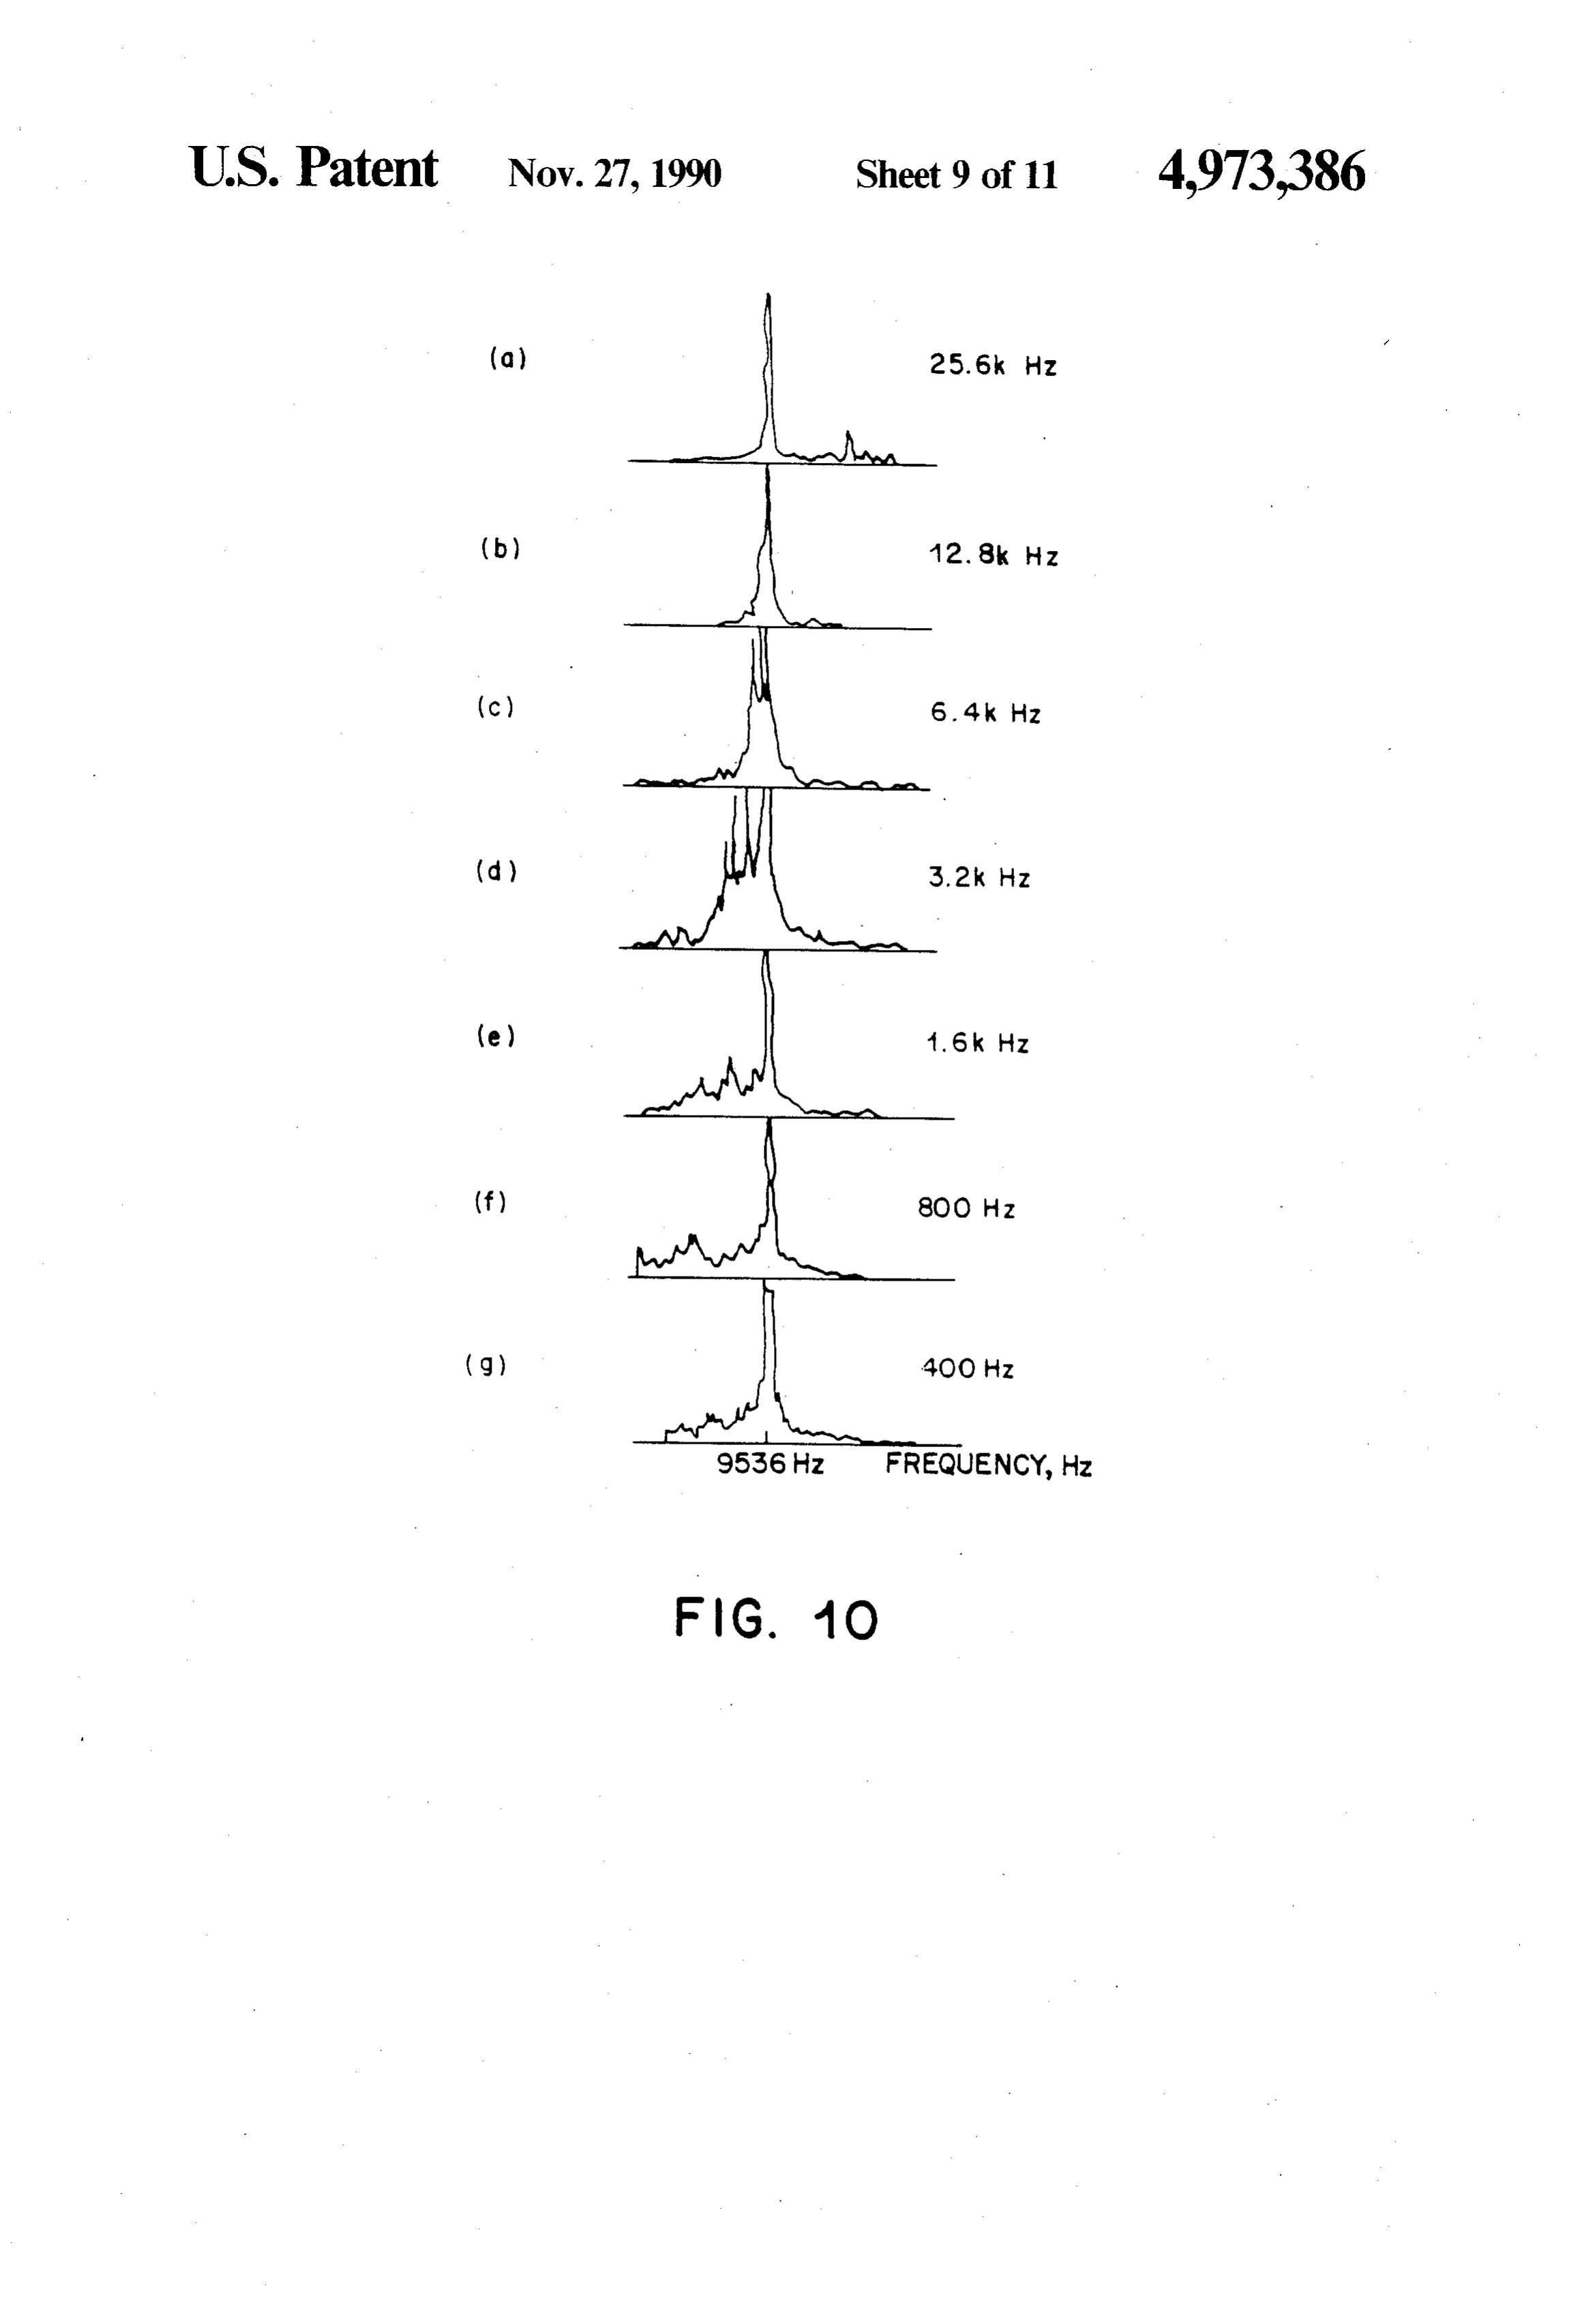
FIG. 7(a) shows the power spectra for the wall ex where f(t) is the frequency of the peak in the power cited by coke particles and FIG. 7(b) shows the power 35 Spectrum at a time t and L(o)f(o) are the same quanti spectrum for the wall excited by the impulse hammer. ties at an earlier time when both L(o) and f(o) were FIG. 8(a) shows the power spectra taken at a specific known. FIG. 4 illustrates the placement of the acceler location on the coker initially. FIG. 8(b) shows the ometer on the wall of the vessel containing the dense power spectrum taken at the same location after nearly bed, and the spatial variation of the acceleration normal a year of operation. to the wall at the fundamental mode of wall vibration. FIG. 9 shows the growth of coke at one location on Under these circumstances, for a homogeneous wall the coker wall. bounded by two media whose density and sound veloc FIG. 10 illustrates the sharpness of the wall reso ity is much less than that of the wall, it is known that the nance. Starting with (a), where the band width is 25.6 fundamental mode has a node in the center and an anti kHz, the band width in each succeeding spectrum is 45 node at the two boundaries. The frequency of the wall reduced by a factor of 2. Power Spectrum (g) has a peak resonance is then simply given by the compressional
sound velocity of the wall divided by twice the thick
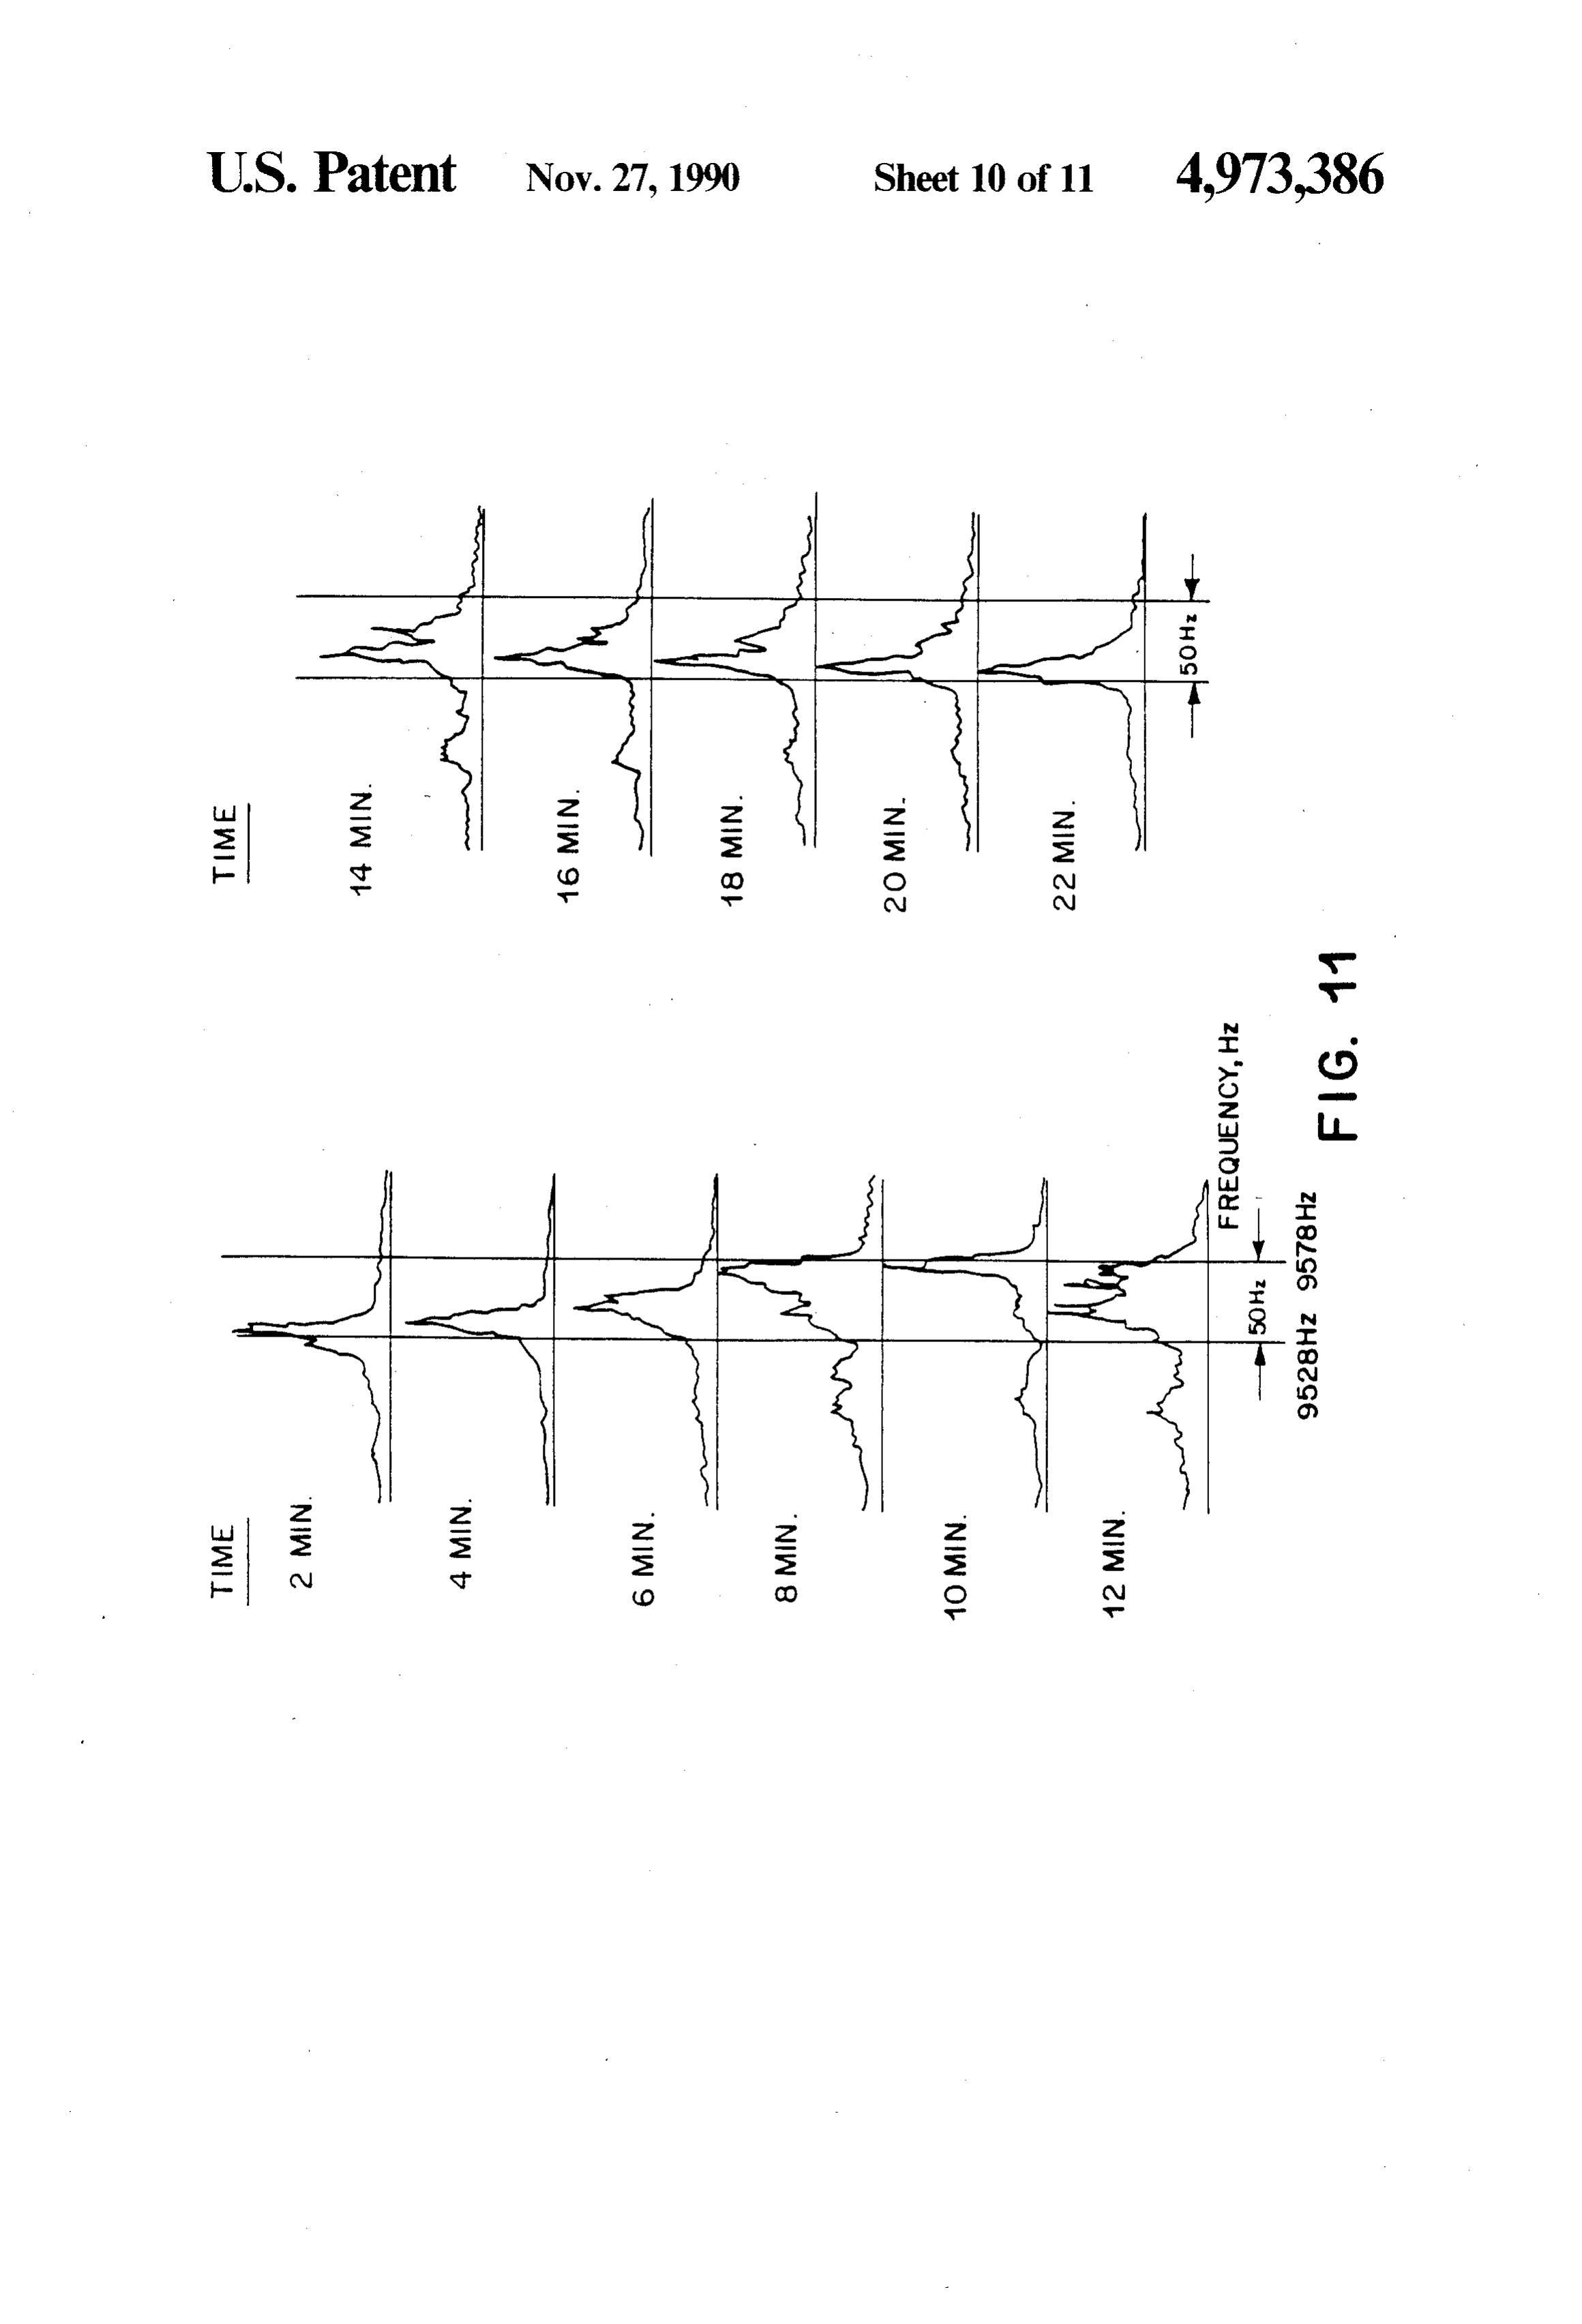
FIG. 11 shows the shift in this peak over a 20 minute ness of the wall. FIG. 4 also illustrates one (and the most period. The total shift is 50 Hz corresponding to a net common) excitation of the wall resonance, namely the erosion/deposition of about 26 mils of coke. 50 impact of the particles of the fluid bed which produces
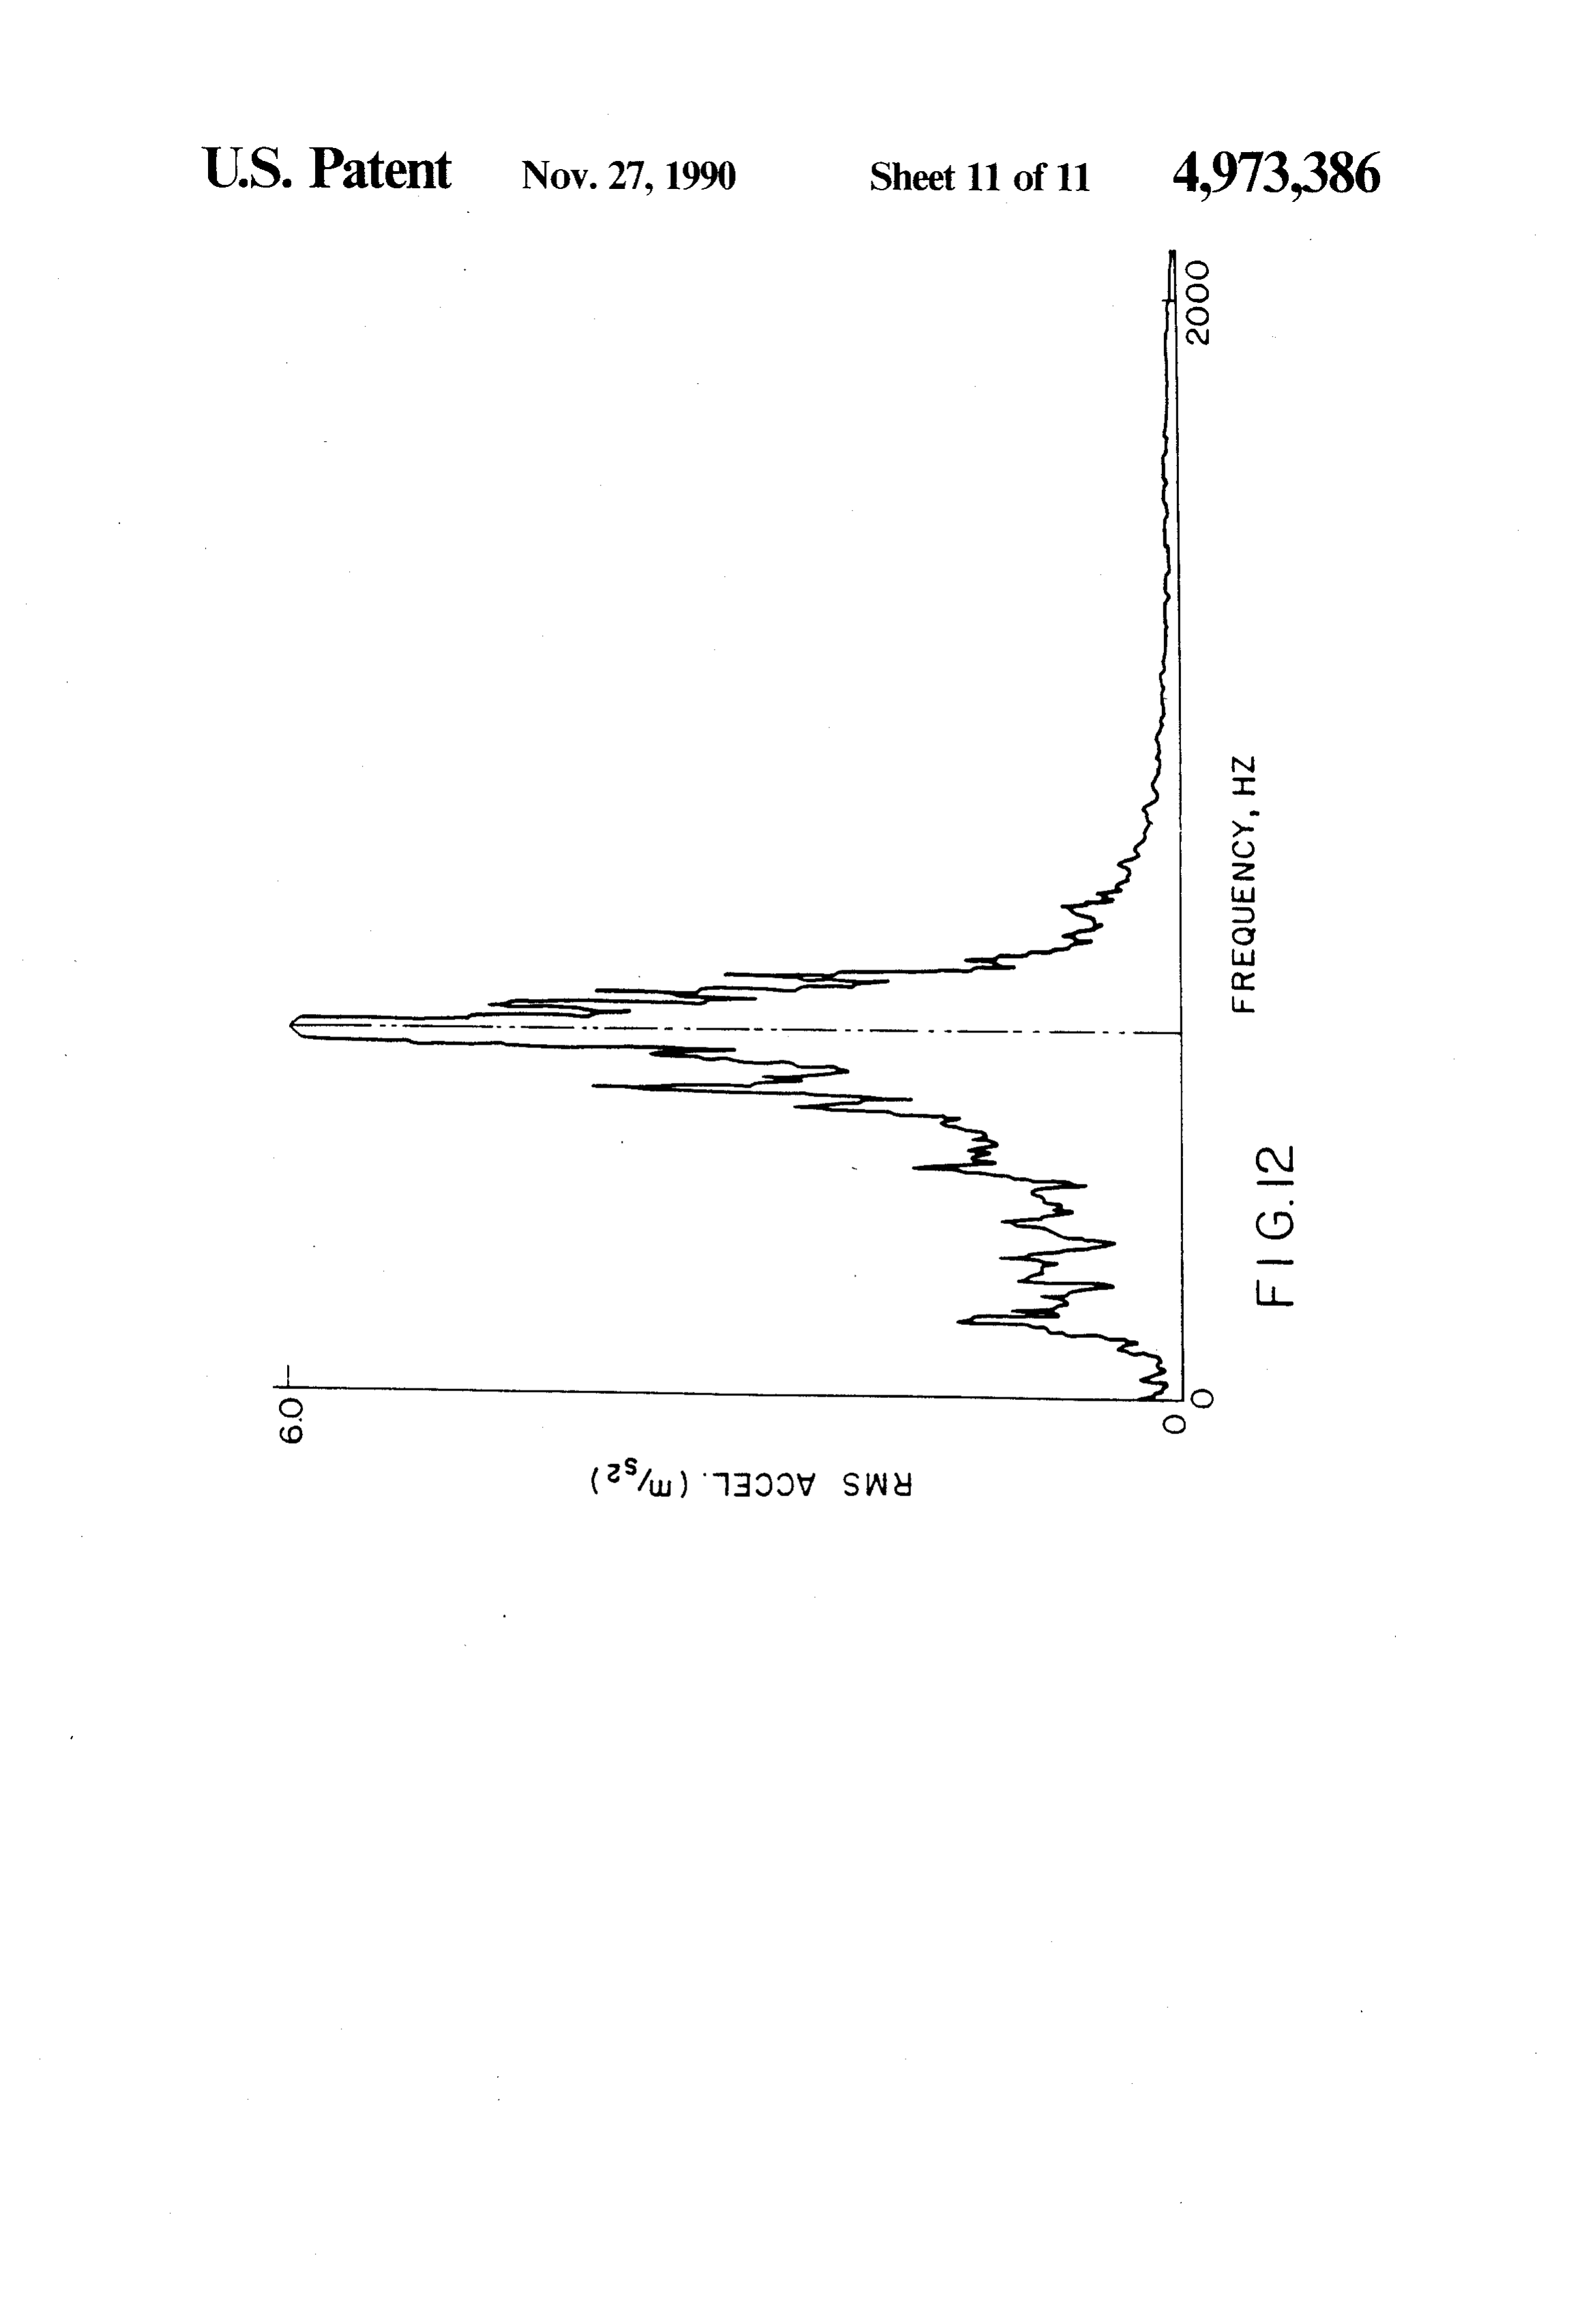
FIG. 12 shows the power spectrum for the wall ex a steady state wall resonance peak in the power spec cited by sound pressure from an open flame within the trum of the accelerometer output.
reactor.
We define coke buildup at time, t, at the location, i, by
the quantity D(t). To an excellent approximation:
The present invention is a passive acoustic process to (t) = LCt)-L(o) (2) monitor wall coke in a fluid bed coker. The process is intended to permit operation of the coker under condi If one had complete information on the geometry and tions that increase liquid yield as well as to supply accu composition of the reactor, then using known acoustical rate estimates of run length for efficient utilization of 60 wave equation techniques, one could calculate the reac refinery resources. tor wall resonances as a function of frequency and relate In order to utilize the invention, accelerometers 2 are the resonances to the change in interior wall thickness. attached to the wall of the coker vessel where it is de However, if only a nominal thickness for the composite sired to measure wall coke, FIG. 1. The electrical signal wall is known, at a give time, then we can define an from the accelerometers proportional to the wall's nor 65 effective velocity of sound "C", for the composite wall mal acceleration is amplified and transmitted either by by the expression cable or optical link to a control room, FIG. 2. In the control room by suitable electronics, the power spec
Page 15
wall under two modes of excitation. The top illustration where C is the effective compressional sound velocity is the power spectrum excited by the impulse hammer of the wall considered as a single layer of a acoustic with no coke particles hitting the inside wall. The lower material. Then using equations (1) and (3), is the power spectrum taken by the accelerometer at the same location when excited under steady state condi tions from the impact of coke particles. The wall reso nant peak is the dominant feature in both power spectra and has a similar shape and location for the pulsed (ham
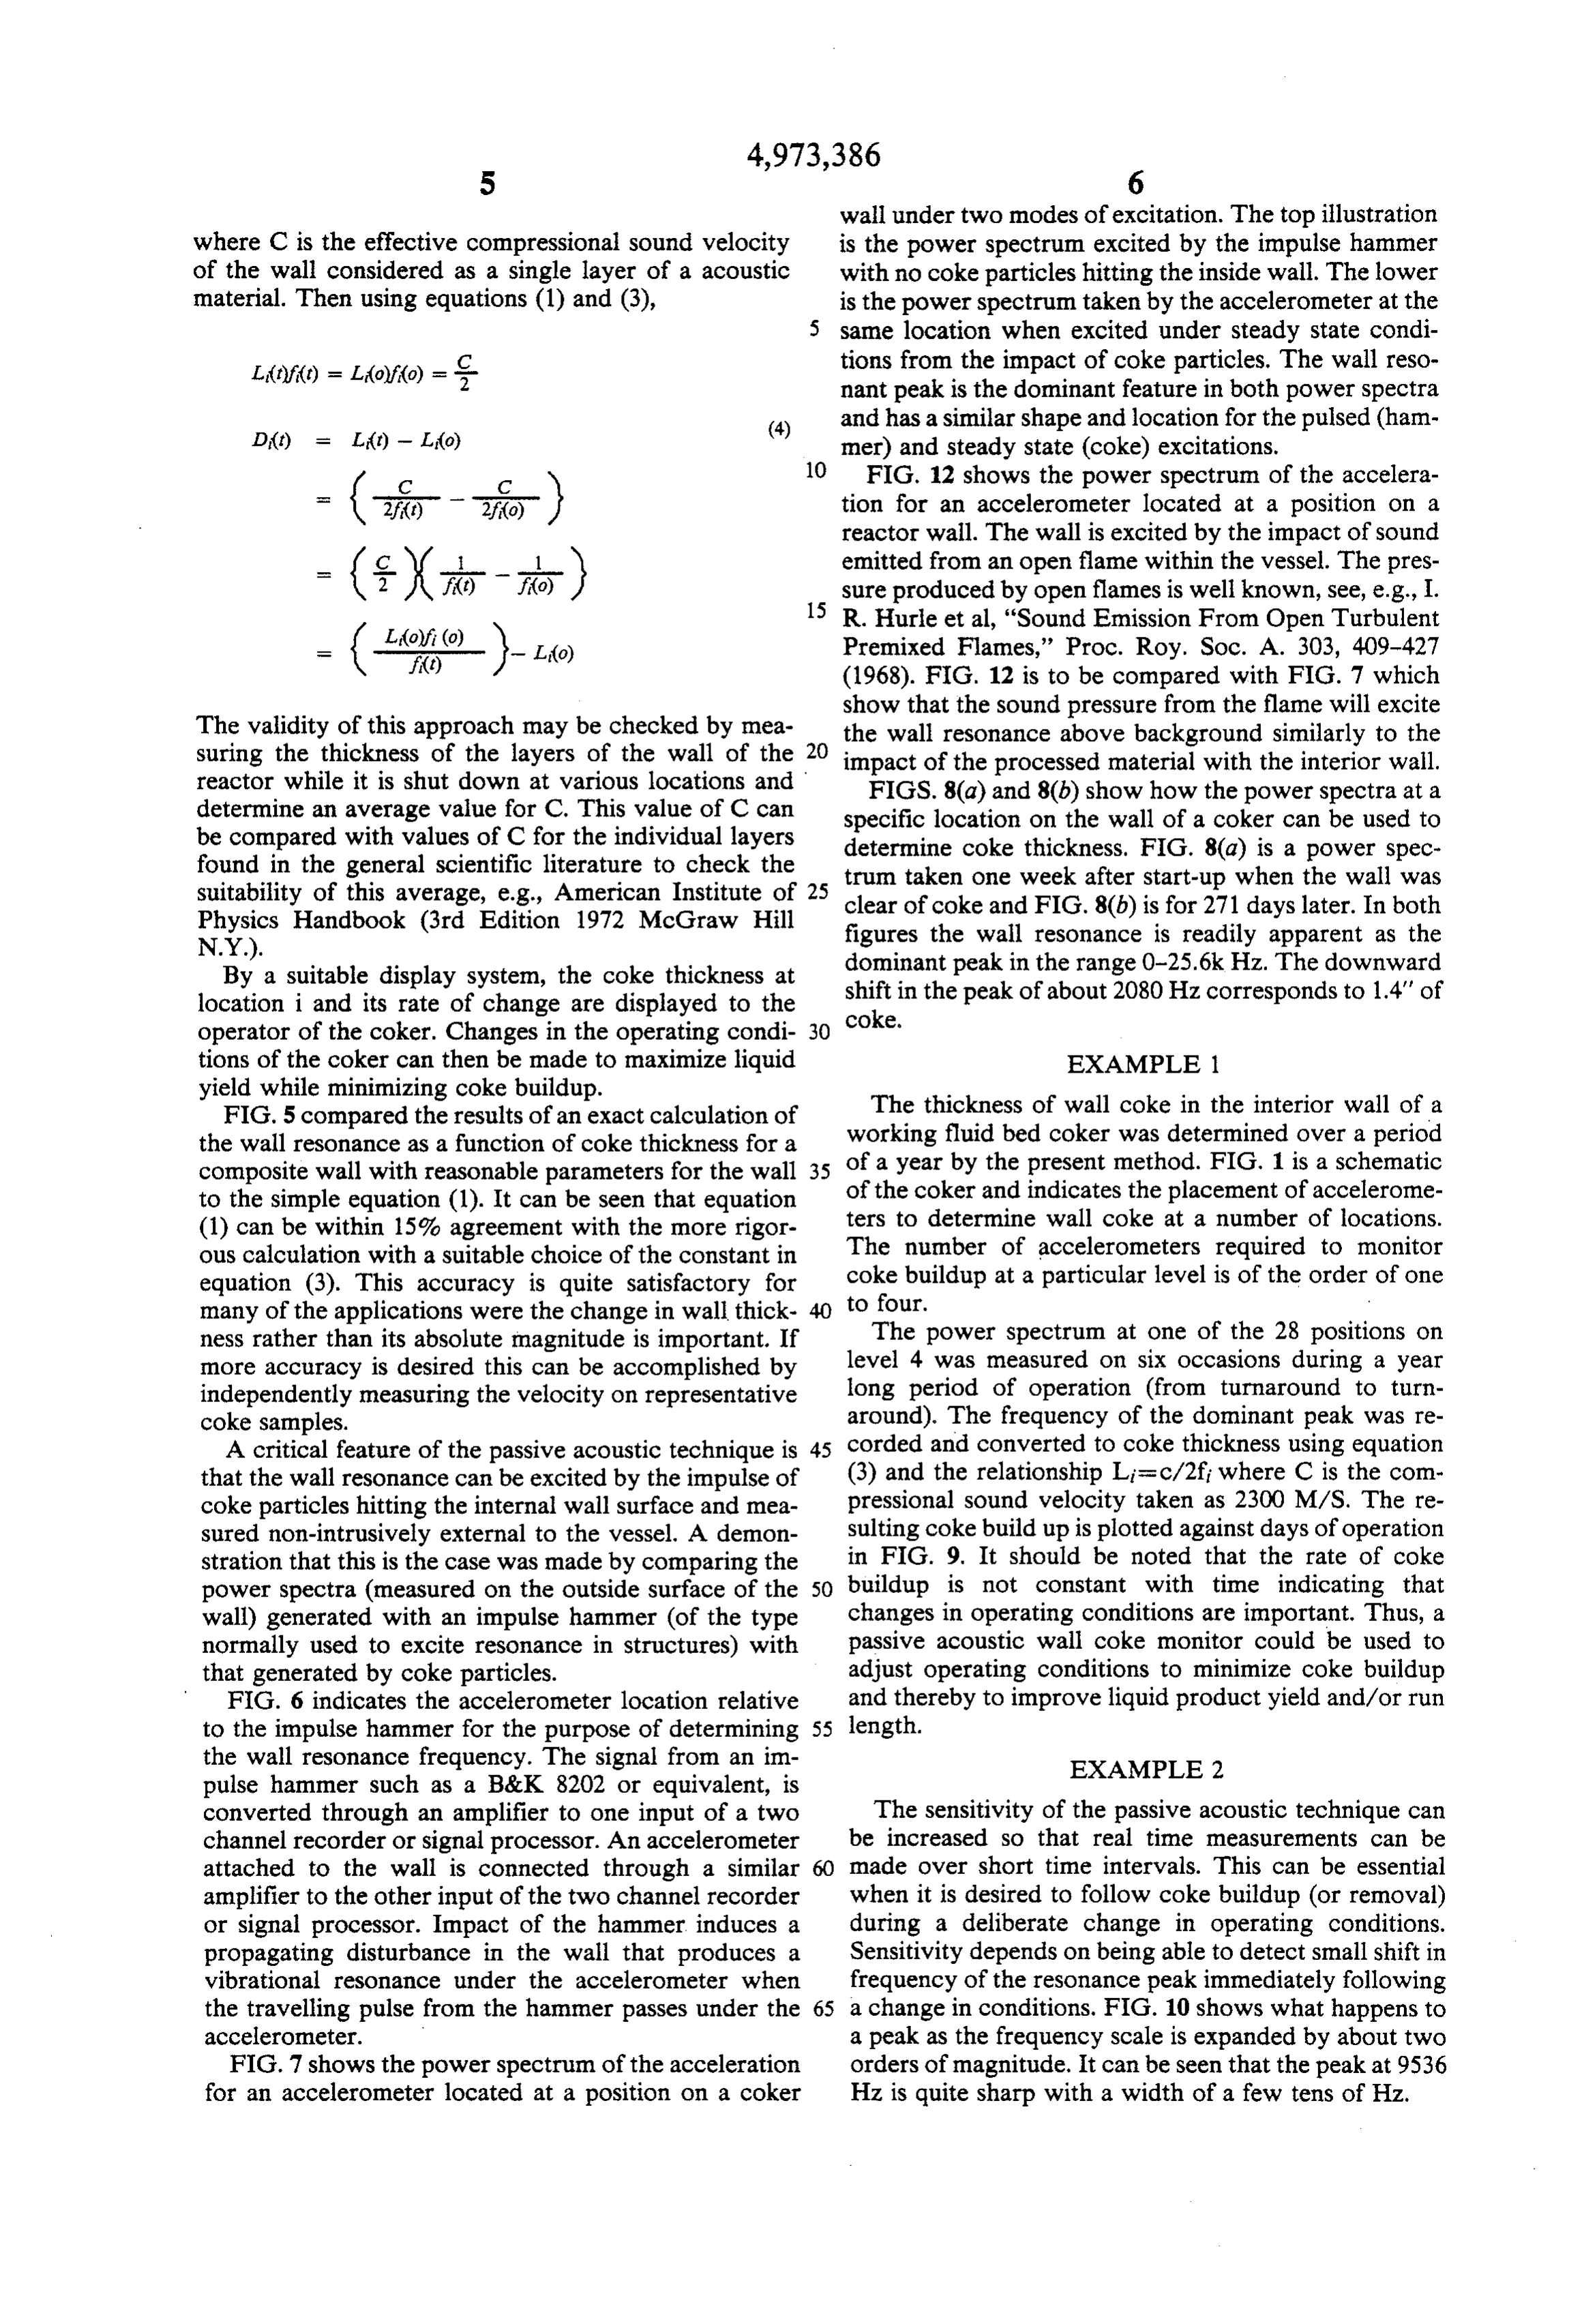
D(t) Li(t) - Li(o) (4) mer) and steady state (coke) excitations. 10 FIG. 12 shows the power spectrum of the accelera ----- tion for an accelerometer located at a position on a
reactor wall. The wall is excited by the impact of sound
C. - - -- - emitted from an open flame within the vessel. The pres 2 JV f(t) f(o) sure produced by open flames is well known, see, e.g., I. 15 R. Hurle et al, "Sound Emission From Open Turbulent
Premixed Flames,' Proc. Roy. Soc. A. 303, 409-427 (1968). FIG. 12 is to be compared with FIG. 7 which show that the sound pressure from the flame will excite
The validity of this approach may be checked by mea the wall resonance above background similarly to the suring the thickness of the layers of the wall of the impact of the processed material with the interior wall. reactor while it is shut down at various locations and FIGS. 8(a) and 8(b) show how the power spectra at a determine an average value for C. This value of C can specific location on the wall of a coker can be used to be compared with values of C for the individual layers determine coke thickness, FIG. 8(a) is a power spec found in the general scientific literature to check the trum taken one week after start-up when the wall was suitability of this average, e.g., American Institute of 25 clear of coke and FIG. 8(b) is for 271 days later. In both Physics Handbook (3rd Edition 1972 McGraw Hill figures the wall resonance is readily apparent as the
By a suitable display system, the coke thickness at dominant shift in the peak in the range 0-25.6kHz. The downward peak of about 2080 Hz corresponds to 1.4" of location i and its rate of change are displayed to the operator of the coker. Changes in the operating condi 30 coke.
tions of the coker can then be made to maximize liquid EXAMPLE yield while minimizing coke buildup. The thickness of wall coke in the interior wall of a FIG. 5 compared the results of an exact calculation of working fluid bed coker was determined over a period the wall resonance as a function of coke thickness for a composite wall with reasonable parameters for the wall 35 of a year by the present method. FIG. 1 is a schematic to the simple equation (1). It can be seen that equation of the coker and indicates the placement of accelerome (1) can be within 15% agreement with the more rigor ters to determine wall coke at a number of locations. ous calculation with a suitable choice of the constant in The number of accelerometers required to monitor equation (3). This accuracy is quite satisfactory for coke buildup at a particular level is of the order of one many of the applications were the change in wall thick 40 to four.
ness rather than its absolute magnitude is important. If The power spectrum at one of the 28 positions on more accuracy is desired this can be accomplished by level 4 was measured on six occasions during a year independently measuring the velocity on representative long period of operation (from turnaround to turn coke samples. around). The frequency of the dominant peak was re A critical feature of the passive acoustic technique is 45 corded and converted to coke thickness using equation that the wall resonance can be excited by the impulse of (3) and the relationship Lisc/2ft where C is the com coke particles hitting the internal wall surface and mea pressional sound velocity taken as 2300 M/S. The re sured non-intrusively external to the vessel. A demon sulting coke build up is plotted against days of operation stration that this is the case was made by comparing the in FIG. 9. It should be noted that the rate of coke power spectra (measured on the outside surface of the 50 buildup is not constant with time indicating that wall) generated with an impulse hammer (of the type changes in operating conditions are important. Thus, a normally used to excite resonance in structures) with passive acoustic wall coke monitor could be used to that generated by coke particles. adjust operating conditions to minimize coke buildup FIG. 6 indicates the accelerometer location relative and thereby to improve liquid product yield and/or run to the impulse hammer for the purpose of determining 55 length.
the wall resonance frequency. The signal from an im EXAMPLE 2 pulse hammer such as a B&K 8202 or equivalent, is converted through an amplifier to one input of a two The sensitivity of the passive acoustic technique can channel recorder or signal processor. An accelerometer be increased so that real time measurements can be attached to the wall is connected through a similar made over short time intervals. This can be essential amplifier to the other input of the two channel recorder when it is desired to follow coke buildup (or removal) or signal processor. Impact of the hammer induces a during a deliberate change in operating conditions. propagating disturbance in the wall that produces a Sensitivity depends on being able to detect small shift in vibrational resonance under the accelerometer when frequency of the resonance peak immediately following the travelling pulse from the hammer passes under the 65 a change in conditions. FIG. 10 shows what happens to accelerometer. a peak as the frequency scale is expanded by about two FIG.7 shows the power spectrum of the acceleration orders of magnitude. It can be seen that the peak at 9536 for an accelerometer located at a position on a coker Hz is quite sharp with a width of a few tens of Hz.
Page 16
This sharpness in the resonance peak can be used to indicative of the measured wall vibrations as a follow coke thickness over short time intervals. In FIG. function of frequency at said time, t; 11 we follow the peak during a 20 minute period and (d) determining a frequency shift of a resonance on note an increase of about 50 Hz during the first 8 min said first spectrum from the corresponding reso utes followed by a decrease of about the same amount nance on said second spectrum, and; during the next 14 minutes. The initial shift of 50 Hz (e) correlating said frequency shift with the change in corresponds to coke erosion of about 50 mils with sub thickness of the reactor wall. sequent redeposition of the same 50 mils. 2. The process of claim 1 wherein said reactor is a This data is sufficient to indicate the degree to which fluid bed coker reactor and said change in thickness of the operator can utilize the passive acoustic technique 10 said wall is due to coke buildup on the interior surface to monitor wall coke buildup within the coker while it of said wall.
is operating. 3. The process of claim 1 wherein said steps of mea The data shown here are for a given coker with a suring said wall vibrations are performed by using an given refractory, Similar results may be obtained for accelerometer attached to the exterior surface of said any coker. The frequency of the fundamental will 15 reactor wall.
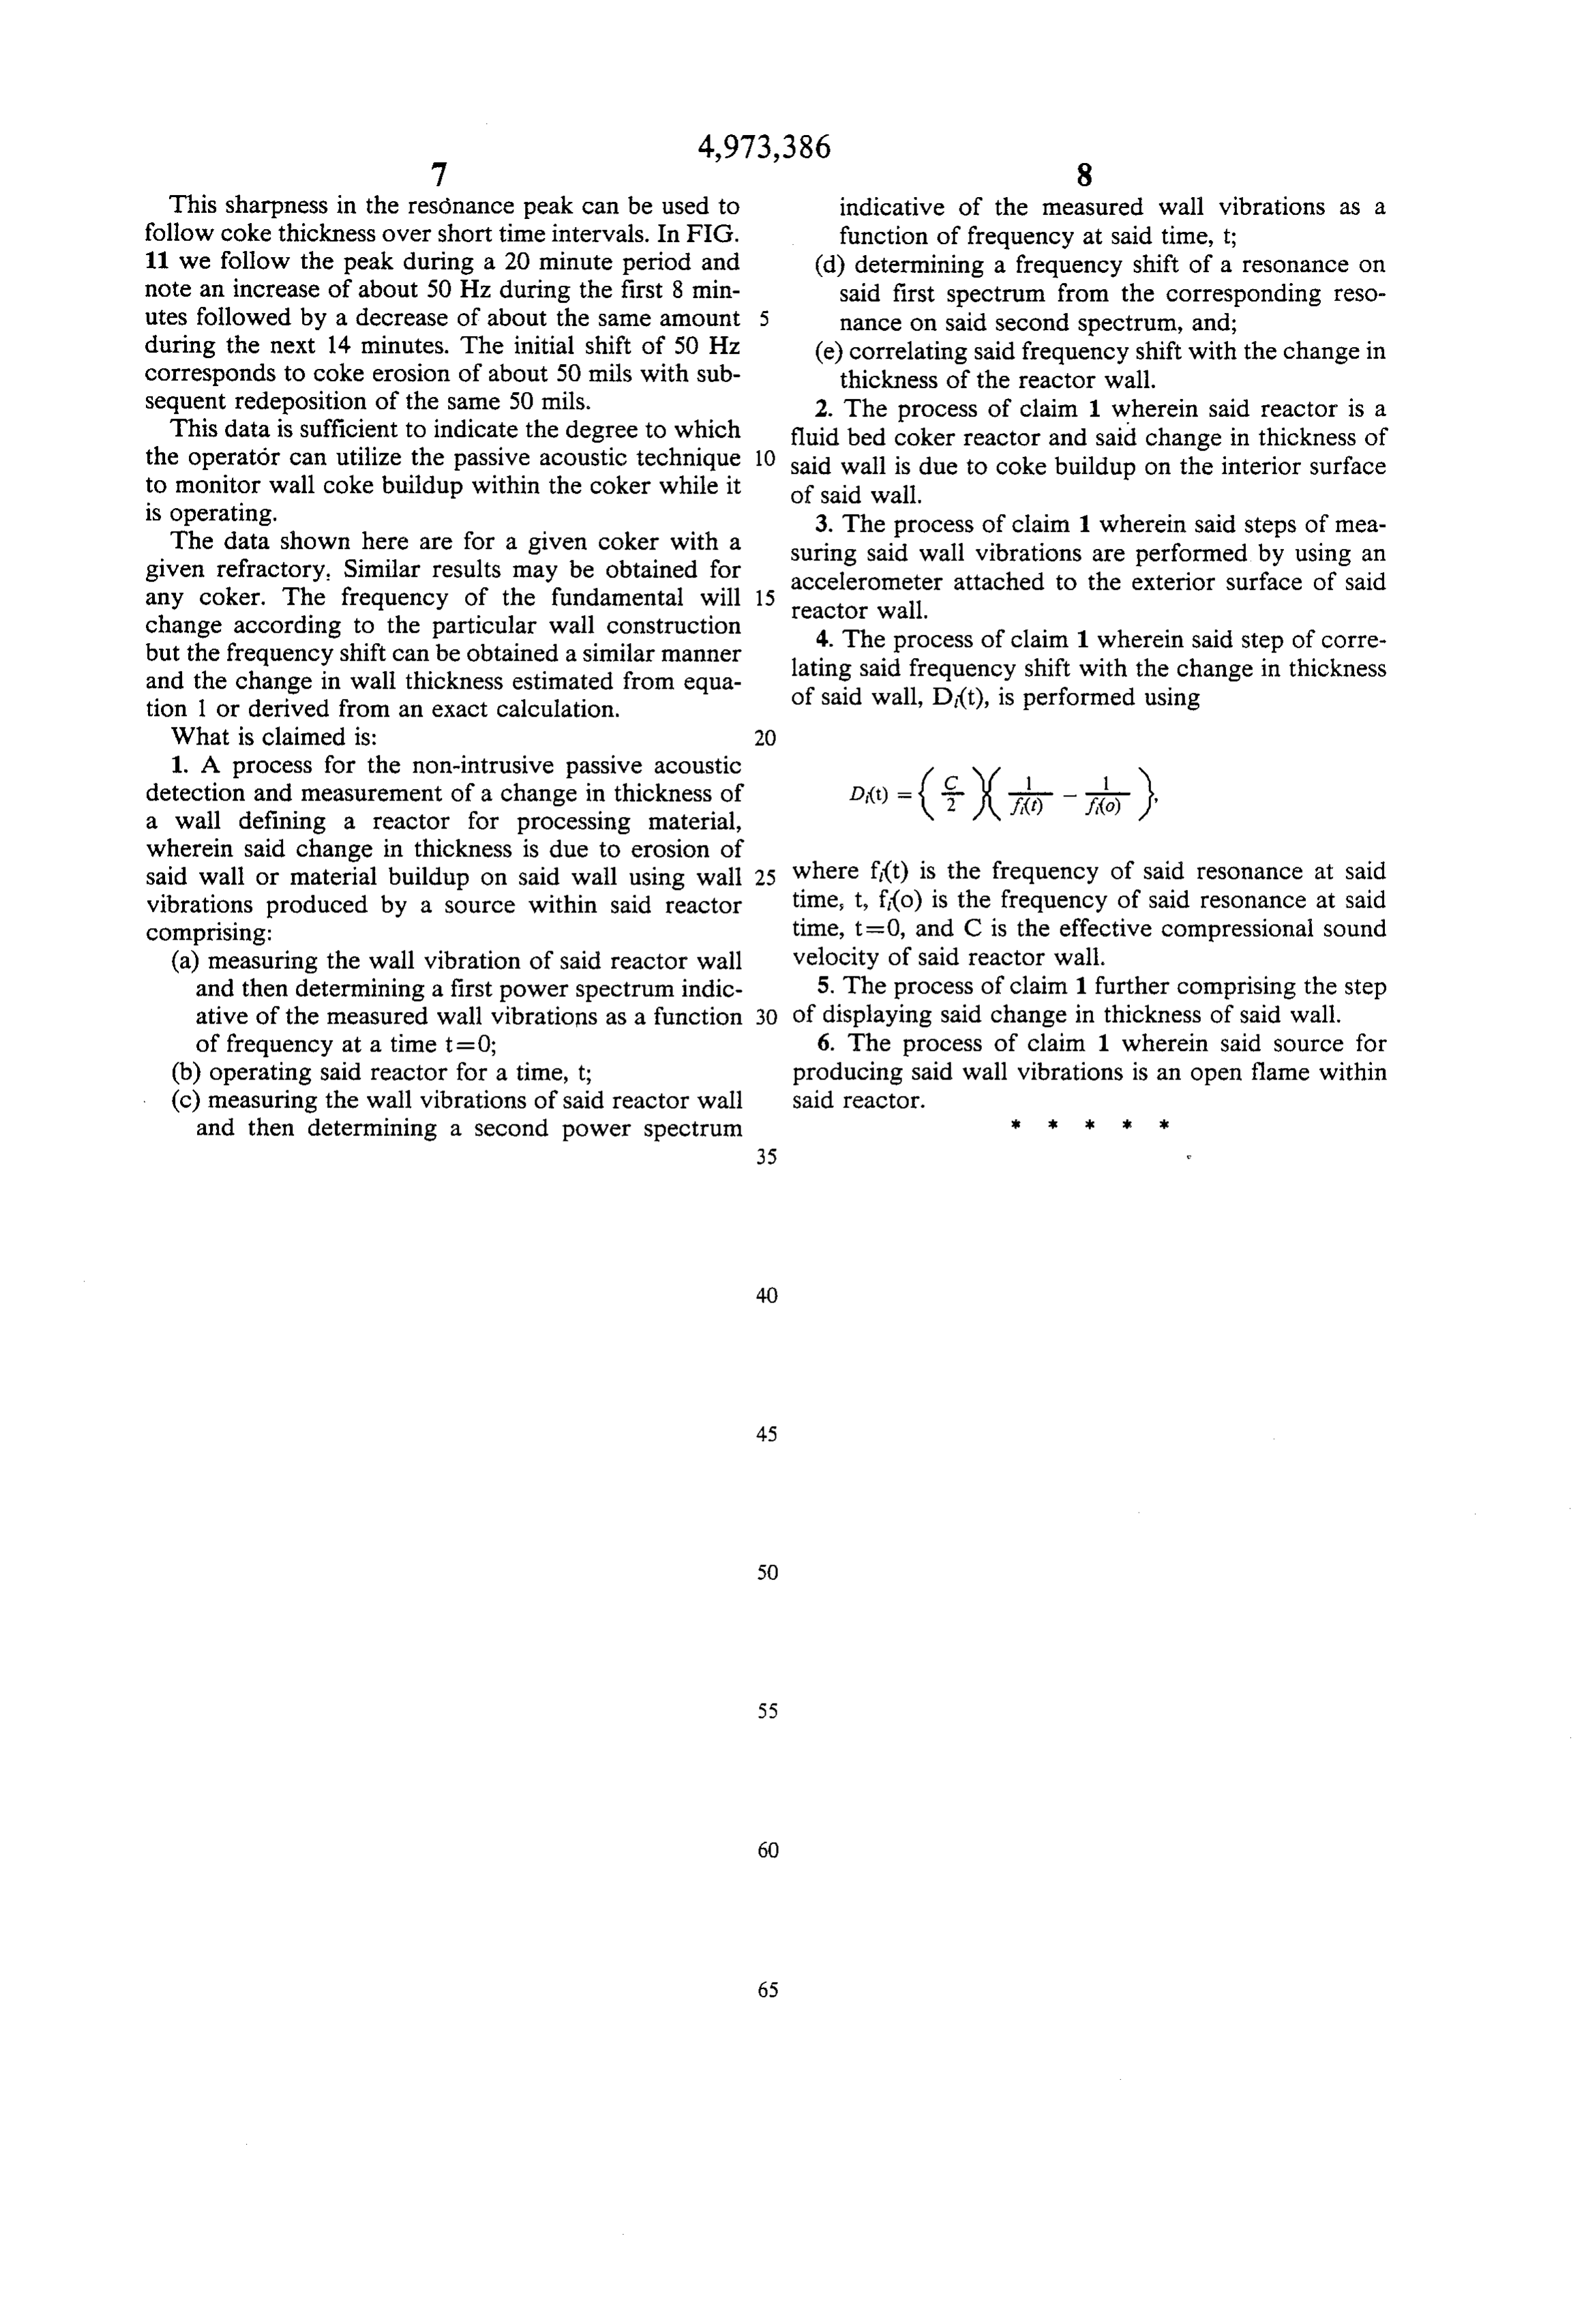
change according to the particular wall construction 4. The process of claim 1 wherein said step of corre but the frequency shift can be obtained a similar manner lating and the change in wall thickness estimated from equa of saidsaid frequency shift with the change in thickness wall, D(t), is performed using tion 1 or derived from an exact calculation.
What is claimed is:
1. A process for the non-intrusive passive acoustic C detection and measurement of a change in thickness of a wall defining a reactor for processing material, D()-(f)(d. - d. s wherein said change in thickness is due to erosion of said wall or material buildup on said wall using wall 25 where f(t) is the frequency of said resonance at said vibrations produced by a source within said reactor time, t, f(o) is the frequency of said resonance at said comprising: time, t=0, and C is the effective compressional sound (a) measuring the wall vibration of said reactor wall velocity of said reactor wall.
and then determining a first power spectrum indic 5. The process of claim 1 further comprising the step ative of the measured wall vibrations as a function 30 of displaying said change in thickness of said wall. of frequency at a time t = 0; 6. The process of claim 1 wherein said source for (b) operating said reactor for a time, t; producing said wall vibrations is an open flame within (c) measuring the wall vibrations of said reactor wall said reactor.
and then determining a second power spectrum
Provenance
- Collection
- Cited prior art
- Original PDF
- patentimages.storage.googleapis.com →
- Filed
- 1988-06-29
- Pages
- 16
- Method
- pdftotext (the PDF's own text layer) + pdftoppm 300dpi page scans
- Source
- Google Patents bibliographic record
- Granted
- 1990-11-27
- Inventors
- Andrew J. Callegari; Eugene R. Elzinga, Jr.; George D. Cody; Roger W. Cohen; Exxon Research and Engineering Co
- Transcribed from
- patentimages.storage.googleapis.com →